From May 11–20, 2017, Bright Line Watch conducted its second expert survey of political scientists assessing the state of democracy in the United States. BLW’s first survey (Wave 1) was conducted at the outset of the Trump administration in February 2017. This report presents results from the second survey (Wave 2), which was completed soon after the first 100 days of the Trump presidency. It evaluates how experts view the United States in comparison to Wave 1 and to prior periods in U.S. history.
In this wave, we invited 9,539 political science faculty at 511 U.S. institutions to participate. By Saturday morning, May 20, we received 1,126 qualified responses (a response rate of 12 percent). This report is based on those data, which are available here.
The Wave 2 survey had two goals. The first was to assess how our respondents rate the current state of democracy in the United States. To do that, we asked them to evaluate the United States using a battery of twenty-nine statements of democratic principles. The second purpose was to evaluate the performance of American democracy in historical context, which we accomplish by (a) comparing responses between our Wave 1 and Wave 2 surveys and (b) asking respondents in Wave 2 to rate the overall quality of U.S. democracy at different times from 1800 to the present.
The twenty-nine statements of democratic principles are as follows:
1. Elections are conducted, ballots counted, and winners determined without pervasive fraud or manipulation
2. All adult citizens have equal opportunity to vote
3. Voter participation in elections is generally high
4. Elections are free from foreign influence
5. The geographic boundaries of electoral districts do not systematically advantage any particular political party
6. All votes have equal impact on election outcomes
7. Parties and candidates are not barred due to their political beliefs and ideologies
8. All adult citizens enjoy the same legal and political rights
9. Government does not interfere with journalists or news organizations
10. Government effectively prevents private actors from engaging in politically-motivated violence or intimidation
11. Government protects individuals’ right to engage in unpopular speech or expression
12. Government protects individuals’ right to engage in peaceful protest
13. Government officials are legally sanctioned for misconduct
14. Government officials do not use public office for private gain
15. Government agencies are not used to monitor, attack, or punish political opponents
16. Government leaders recognize the validity of bureaucratic or scientific consensus about matters of public policy
17. Even when there are disagreements about ideology or policy, political leaders generally share a common understanding of relevant facts
18. Executive authority cannot be expanded beyond constitutional limits
19. The legislature is able to effectively limit executive power
20. The judiciary is able to effectively limit executive power
21. The elected branches respect judicial independence
22. In the elected branches, majorities act with restraint and reciprocity
23. Elected officials seek compromise with political opponents
24. Political competition occurs without criticism of opponents’ loyalty or patriotism
25. Information about the sources of campaign funding is available to the public
26. Public policy is not determined by large campaign contributions
27. Citizens can make their opinions heard in open debate about policies that are under consideration
28. Citizens have access to information about candidates that is relevant to how they would govern
29. Law enforcement investigations of public officials or their associates are free from political influence or interference
The first battery of questions asked, “How well do the following statements describe the United States as of today?” Each respondent was then asked to rate a randomly selected subset of fifteen statements drawn from the list above using the following response options for each statement:
-
The U.S. does not meet this standard
-
The U.S. partly meets this standard
-
The U.S. mostly meets this standard
-
The U.S. fully meets this standard
-
Not sure
(Note: The list of statements of democratic principles has grown from Wave 1, which included nineteen statements. Appendix A below describes changes from the Wave 1 survey to Wave 2.)
Respondents were then asked to evaluate the overall performance of U.S. democracy today on a 0–100 scale. After providing a rating, they were then asked to provide a similar rating at nine historical points: 1800, 1850, 1900, 1950, 1975, 1985, 1995, 2005, and 2015.
How is U.S. democracy doing?
According to our experts, the performance of U.S. democracy varies widely across different types of democratic principles. Rights of expression are perceived as well-protected, but ratings of elections and political accountability are mixed and standards of political equality and civility are overwhelmingly rated as not being met.
The figure below shows the distribution of responses on the democratic performance battery for each of the statements. The statements are ordered vertically according to the combined share of responses indicating that the United States fully or mostly meets the standard (as opposed to partly or not at all or not sure). (Summary statistics in tabular form can be viewed here.)
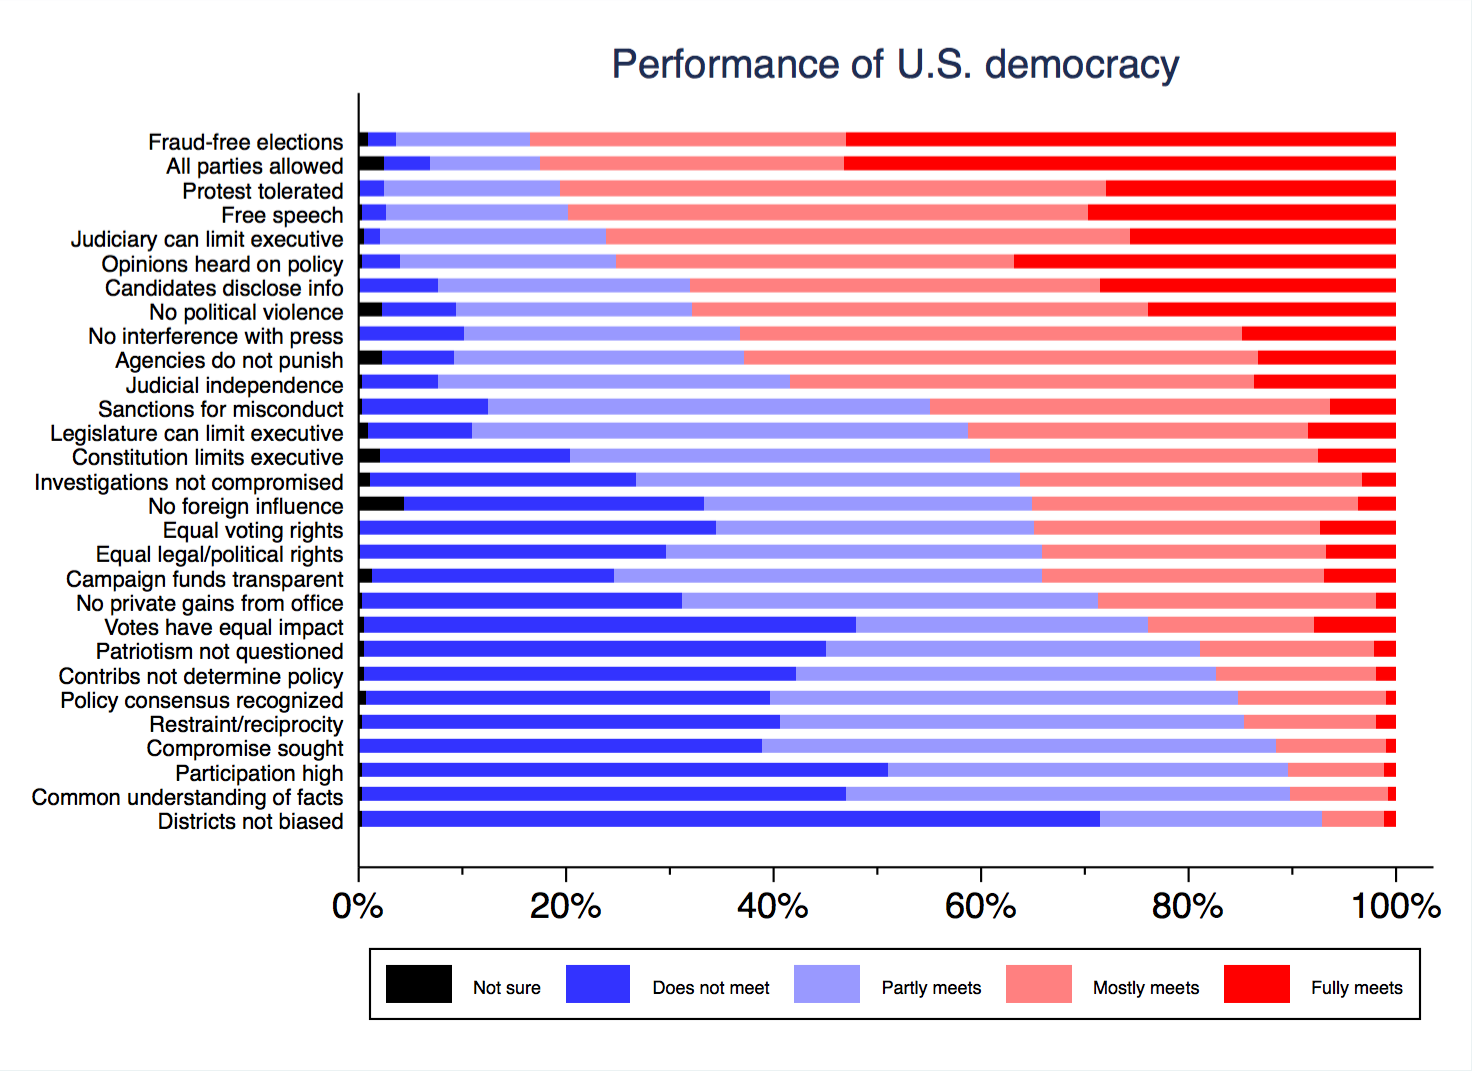
As the figure illustrates, there is a sharp break in performance assessments between statements for which over half of our respondents rated the United States as “mostly” or “fully” meeting the standard and statements for which over half said the United States “does not meet” or only “partly meets” the standard. We use this fifty percent cutoff to distinguish strong from weak performance.
To facilitate overall assessment of the results for our extensive list of democratic principles, we sort the survey statements into groups reflecting broader themes and present the average percentage of respondents who think the U.S. mostly or fully meets the standard in question for each.
-
Freedom of expression (average: 72%)
-
Quality of elections (average: 46%)
-
Accountability (average: 46%)
-
Political equality (average: 28%)
-
Norms of civility (average: 14%)
(The full set of statements corresponding to each theme is listed in Appendix B below along with the percentage of “Mostly meets standard” and “Fully meets standard” responses for each.)
As these values indicate, respondents generally view the U.S. as performing well on democratic principles related to freedom of expression. However, views are more mixed on principles related to political and legal accountability. The judiciary’s independence (58%) and check on executive power (76%) are rated highly, but other checks on misconduct and the exercise of executive power receive lower ratings (29%-45%). Similarly, most experts believe U.S. elections are conducted without fraud (83%) or interference in the parties who can participate (82%), but ratings of other aspects of elections related to foreign influence (35%), campaign funding (34%), participation (10%), and boundaries of electoral districts (7%) are much lower. Finally, ratings are consistently dismal for measures of political, legal, and electoral equality (average: 28%) and respect for norms of political civility and consensus about the validity of information on politics and policy (average: 14%).
What changes do we see over time?
Our Wave 2 survey provides perspective on changes over time in expert assessments of democracy at three levels of granularity — changes while our survey was being administered, changes from Wave 1 to Wave 2, and changes across broader eras of U.S. history. Our initial intention was to focus on the latter two comparisons, but the dramatic events of the week of May 15–20, 2017 also allow us to evaluate how responses changed while our survey was in the field.
Changes during the survey week
In the six days after we first issued survey invitations on Thursday, May 11, the political news cycle was dominated by President Trump’s firing of FBI director James Comey on May 9 and subsequent revelations about the motivations for Comey’s dismissal. However, the news cycle took a dramatic turn on the evening of Wednesday, May 17, when Justice Department announced that Robert Mueller had been appointed as a special counsel to investigate Russian interference into the 2016 election and whether it included collusion with Trump campaign officials. He was also given authority to consider any potential efforts to obstruct the investigation.
Mueller’s appointment as special counsel has implications for many of the democratic principles reflected in our statements. For this reason, we examined whether the patterns of responses to any of our questions differed systematically between the period before and after the Mueller appointment. Approximately seven in 10 respondents (783, or 70%) began answering the survey before 6 PM on May 17; the rest (343, or 30%) began afterward. On most statements, differences between early and late responses were minor. On two statements, however, the percentages who said the U.S. “mostly” or “fully” meets the standard in question shifted by more than ten percentage points (both differences are statistically significant):
-
“Executive authority cannot be expanded beyond constitutional limits” increased from 35% to 48%.
-
“Law enforcement investigations of public officials or their associates are free from political influence or interference” increased from 32% to 45%.
These shifts suggest that our respondents were reassured by Mueller’s appointment.
Changes from February 2017 to May 2017
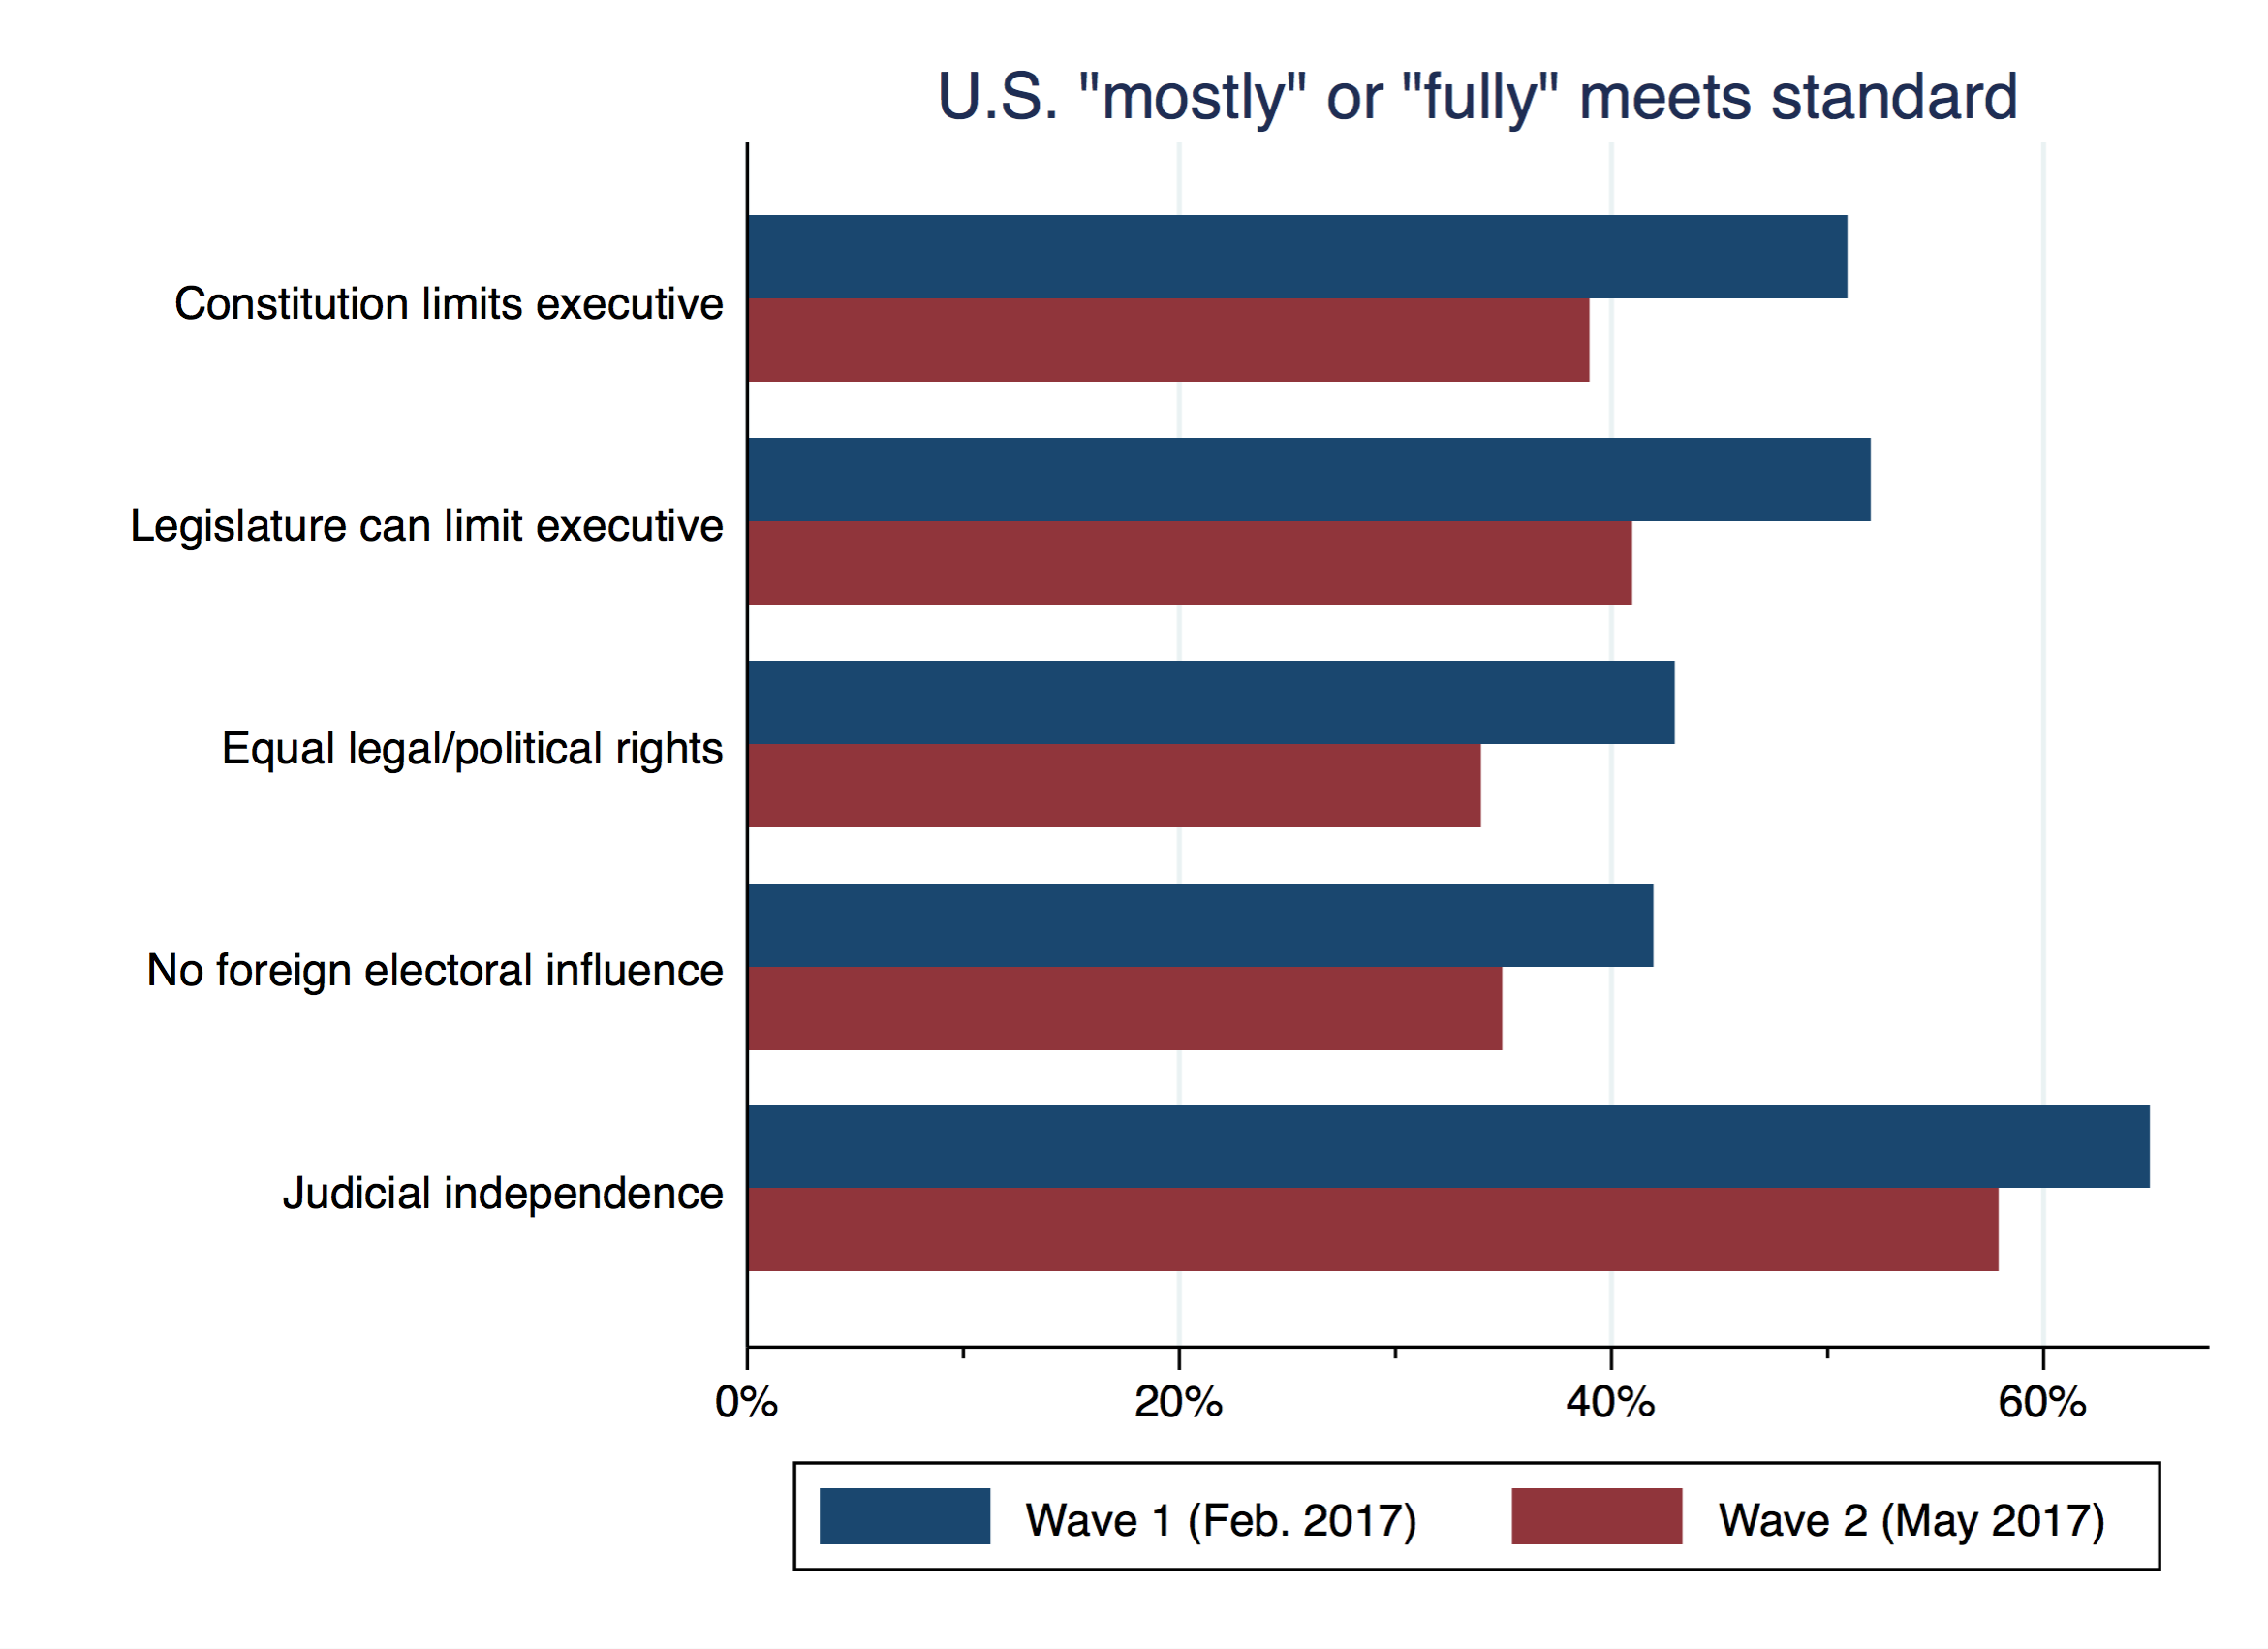
We also evaluate shifts in our expert respondents’ assessments between our Wave 1 survey, which was conducted in February 2017, and our Wave 2 survey. To do so, we compare responses on the nineteen statements that were asked in both waves.
We observe a significant decrease in the proportion of respondents who think the U.S. “mostly” or “fully” meets the standard in question from Wave 1 to Wave 2 for five democratic principles:
-
Constitutional limits on executive (-12%)
-
Legislative check on the executive (-11%)
-
Equal legal and political rights (-9%)
-
Foreign influence on elections (-8%)
-
Judicial independence (-6%)
(A comparison of ratings for all 19 items in Waves 1 and 2 is provided in Appendix C below.)
This deterioration was likely driven by events in the news. From the first to the second waves of our surveys, the Russian influence scandal attracted increasing attention, which may have contributed to declining expert ratings of constitutional limits on, and legislative control over, the executive, as well as foreign electoral influence. (Our analysis above suggests the Mueller appointment mitigated the perceived deterioration of constitutional limits on the executive.) Finally, the observed deterioration in perceptions of judicial independence and equal legal/political rights may reflect the dissipation of attention to actions by courts blocking the Trump administration’s executive order banning travel from majority-Muslim countries, which was intense at the time of Wave 1.
Changes over time across eras of US history
The second main battery of questions on the Wave 2 survey asked respondents to rate the overall quality of U.S. democracy on a 0–100 scale in 1800, 1850, 1900, 1950, 1975, 1985, 1995, 2005, 2015, and 2017. The years we selected corresponded to distinct eras in American history. For instance, the first four cover the time period shortly after the founding (1800), the middle of the 19th century but before the Civil War (1850), the era of progressive reforms but also Jim Crow in the South (1900), and the mid-20th century period after the New Deal but before the main gains of civil rights movement (1950). As we moved toward the present day, we expected our respondents’ knowledge of U.S. democracy and ability to discern differences in quality would grow. Accordingly, we asked for assessments across narrower time gaps (1975, 1985, 1995, and 2005). Finally, we asked for assessments in 2015 and 2017 to measure any perceived shift in democratic quality under the Trump administration.
The results are reported in Appendix D, and plotted in the figure below:
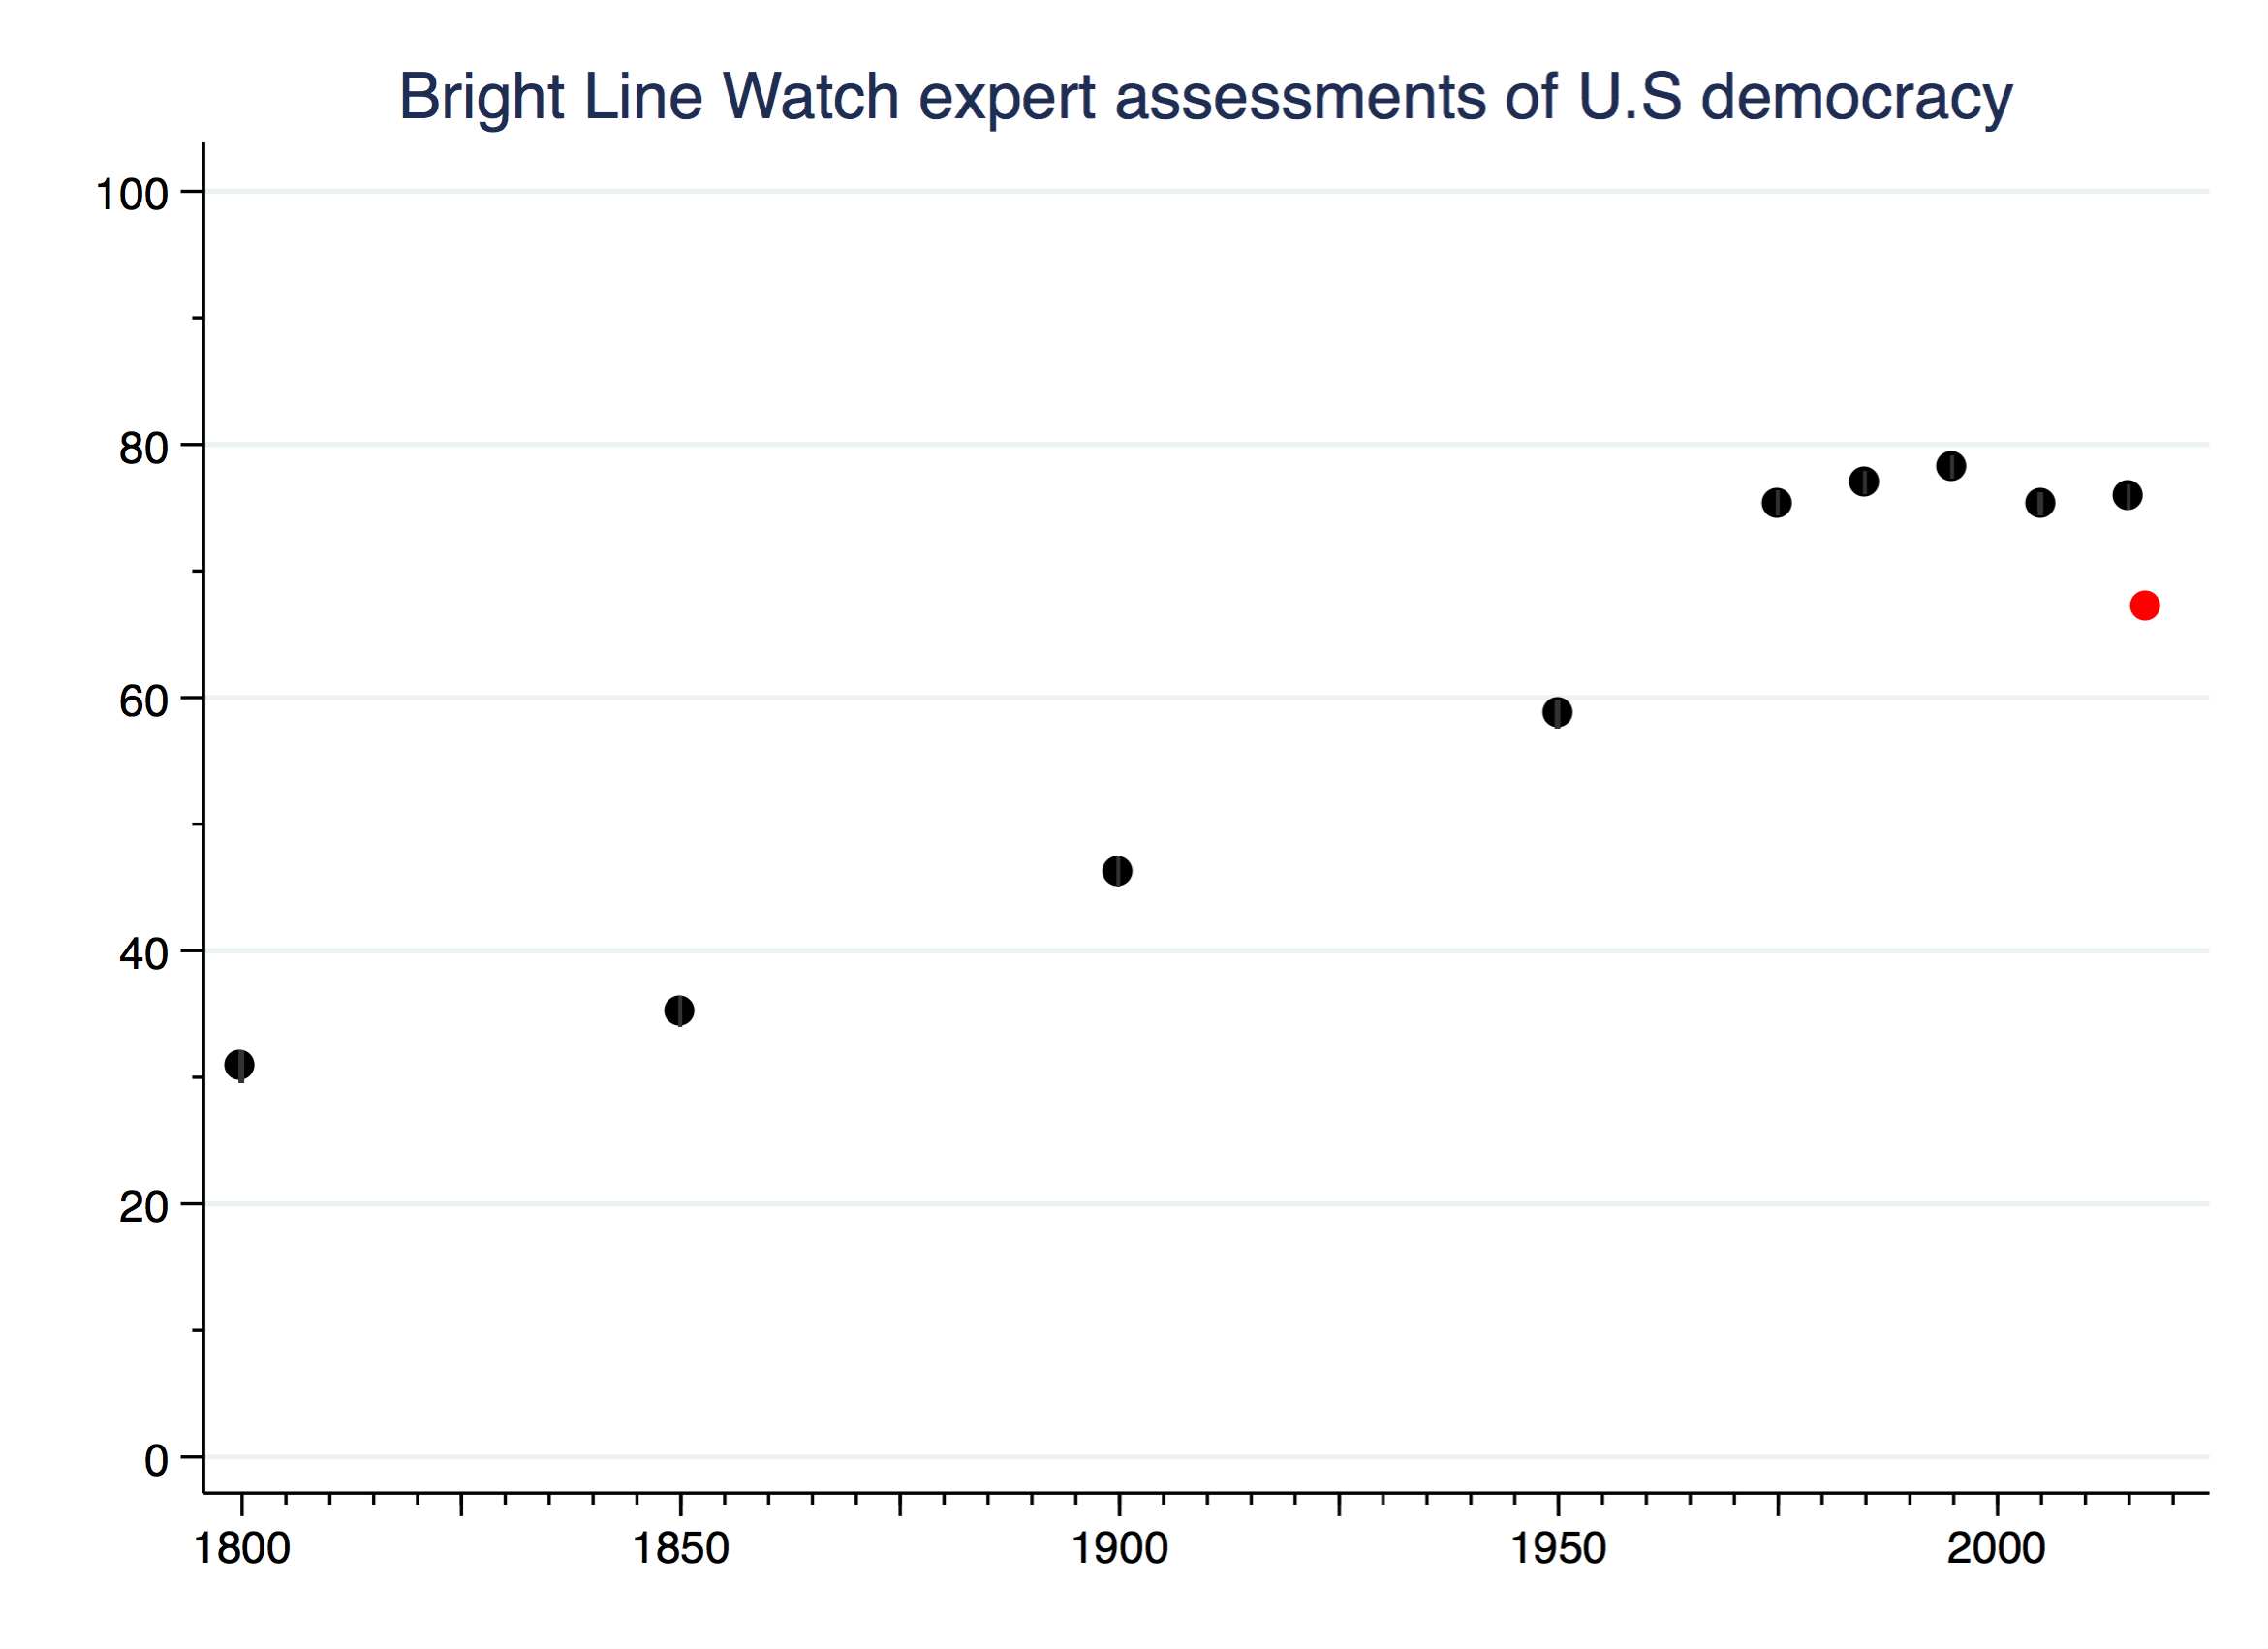
(95% confidence intervals are similar in height to the points in the graph and are thus omitted.)
We observe steady and dramatic increases in the assessments of the quality of U.S. democracy from the founding era up to the late 20th century. The increase from 1800–1850 coincides with expansion of suffrage beyond property holders to most of the white male population. The period from 1850–1900 saw the Civil War, the abolition of slavery, the Civil Service Act, and the beginning of the Progressive Era reforms, but also the abandonment of Reconstruction and the establishment of Jim Crow in the South (1850–1900). The period from 1900–1950 saw the ratification of the 19th Amendment to the Constitution guaranteeing women’s voting rights as well as the vast expansion of the federal welfare state under Roosevelt’s New Deal and the first achievements of the civil rights movement. Our respondents rated U.S. democracy as improving steadily during this period, surpassing a mean score of 50 on the 100-point scale for the first time.
The time lapses in our survey question shortened at this point. Between 1950 to 1975, the country experienced the high water mark of the civil rights movement, including landmark civil rights legislation in 1957 and 1964 and the Voting Rights Act of 1965. The average rating for US democracy rose more steeply during this 25-year span than it did on average during the prior 50-year intervals.
Subsequently, the assessments from our experts plateau over the next four decades, remaining roughly stable over ten-year intervals from 1975–2015. During this period, there is no clear difference in overall evaluations of U.S. democracy across administrations with diametrically different governing ideologies, including the two-term presidencies of Ronald Reagan, Bill Clinton, George W. Bush, and Barack Obama. In 2017, however, we observe a decline in the final rating after the beginning of the Trump administration.
The Trump slump is worth examining more closely. As summarized in the chart below, fully three-quarters of the experts surveyed registered a decline in the quality of U.S. democracy between 2015 and 2017. About a quarter regarded this as minor (between 1 and 5 points on the 100-point scale), another quarter gauged it as moderate (6 to 10 points), and 27% estimated it as larger than 10 points. By contrast, 21% perceived no change across the most recent two years and only 4% rate U.S. democracy as stronger in 2017 than in 2015.

Clearly, our expert sample of political scientists views the quality of US democracy more negatively in May 2017 than it did in the past.
Conclusion
Findings from the Wave 2 Bright Line Watch survey indicate that confidence in parts of the basic framework of liberal democracy in the U.S. remain solid, but significant concerns exist and are growing in numerous areas.
Respondent assessments of the U.S. vary widely across different dimensions of democracy. Evaluations of the rights that guarantee freedom of expression, including of unpopular ideas, are consistently positive. However, assessments of the quality of elections and mechanisms of accountability are mixed; some specific principles are widely regarded as met whereas others are seen as deficient. For example, there is widespread confidence that the minimum conditions for democratic elections, such as the absence of fraud, are fulfilled but other elements of electoral quality, including unbiased electoral districts, high participation rates, and transparent disclosure of campaign funding, are held to be lacking.
The variation in in our respondents’ judgments of mechanisms of accountability is not quite so wide but still remains uneven. The U.S. judiciary is held in high regard for its independence and its ability to exercise a check on executive authority, but other checks on government power and forms of accountability command far less esteem. Most respondents are skeptical about the effectiveness of Congress as a check on the executive, whether public officials can be constrained from abusing their authority, and whether investigation and enforcement mechanisms are uncompromised by political considerations.
Finally, our respondents rate the United States as deficient on metrics of political equality, including voting, legal, and political rights, as well as on equality of influence both at the ballot box and in shaping public policy. Assessments of respect for the behavioral norms that sustain civil discourse, including decency toward political opponents, willingness to compromise, and even to seek common understandings on basic facts, are lower still.
Over time, our expert respondents perceive the quality of U.S. democracy as increasing steadily for the first two centuries after independence, with the most dramatic gains concentrated in the decades immediately following World War II. Those gains were preserved through the Cold War era and into the 21st century despite the turmoil following the 9/11 attacks and the war on terror.
Between 2015 and the present, however, our respondents perceive a sharp decline in the quality of democracy, the first for any time interval we examined. We will continue to explore the sources and persistence of this shift in future surveys, but the evidence from February to May points toward intensifying concerns about whether constitutional limits on executive authority can be enforced, whether Congress is willing or able to enforce those limits, and whether legal and political rights will be equally guaranteed to all Americans. We are not shocked by our results given the ongoing political battles over these core democratic principles, but their familiarity in no way limits their urgency. We will continue to monitor the quality of democracy in the United States in future reports.
Appendix A: Changes to the survey
Bright Line Watch conducted its first expert survey on U.S. democracy in February 2017 (Wave 1). We received comments and feedback on the instrument from dozens of political science faculty who took the survey as well as from journalists and other scholars who took an interest in the project. We incorporated many of those suggestions in designing the Wave 2 instrument.
Our intention is to repeat variants of the survey quarterly, maintaining the core battery of statements evaluating democratic performance and rotating additional questions into the mix to explore historical and comparative cases. For the core battery, we will prioritize stability for purposes of comparisons over time, but we also aim to establish the best possible instrument.
The most significant change to the study was the expansion of the list of statements included in the Wave 2 survey from 19 to 29. Readers can view the full lists of statements from Wave 1 and Wave 2 here. The list of newly added statements is as follows:
- Voter participation in elections is generally high
- The geographic boundaries of electoral districts do not systematically advantage any particular political party
- Government protects individuals’ right to engage in peaceful protest
- Information about the sources of campaign funding is available to the public
- Public policy is not determined by large campaign contributions
- Citizens can make their opinions heard in open debate about policies that are under consideration
- Citizens have access to information about candidates that is relevant to how they would govern
- Law enforcement investigations of public officials or their associates are free from political influence or interference
- Even when there are disagreements about ideology or policy, political leaders generally share a common understanding of relevant facts
- Elected officials seek compromise with political opponents
In Wave 1, we asked respondents to evaluate all 19 of the statements twice — first in a battery asking how important each principle is to democracy in general and then again in battery asking about the performance of U.S. democracy. With the expanded list of statements in Wave 2, we decided to reduce the burden on respondents by requesting an evaluation of a randomly selected subset of 15 of the 29 statements. This change lightened the load on respondents considerably, although it reduced the number of responses we received evaluating any given statement (which ranged from 531 to 612).
The first eight of the new statements listed above were intended to expand the range of democratic principles that our survey evaluates. The last two statements have a different intent. We regard them as improvements over two Wave 1 statements that we concluded were awkward and unclear:
- Government leaders recognize the validity of bureaucratic or scientific consensus about matters of public policy
- In the elected branches, majorities act with restraint and reciprocity
On Wave 2, we included all four statements in order to confirm that the proposed replacements tap into related ideas as the originals. The responses for each pairing in Wave 2 suggests they do. For instance, the 84% of respondents for the original consensus question indicated the U.S. “does not” or only “partly meets” the standard versus 90% for the new common understanding question (correlation = 0.56 among those who answered both questions). Similarly, 85% of respondents said the U.S. “does not” or only “partly meets” the standard for the original majority restraint question versus 89% for the new compromise question (correlation = 0.43).
We therefore plan to drop the two original statements in future waves of the survey.
Appendix B: Statements by theme
| Statement | U.S. mostly+fully meets standard |
| Expression | |
| Protest tolerated | 80% |
| Free speech | 80% |
| Opinions heard on policy | 75% |
| No political violence | 68% |
| No interference with press | 63% |
| Agencies do not punish | 63% |
| Average | 72% |
| Accountability | |
| Judicial check | 76% |
| Judicial independence | 58% |
| Sanctions for misconduct | 45% |
| Legislative check | 41% |
| Constitutional limits on executive | 39% |
| Investigations not compromised | 36% |
| Public office for private gain | 29% |
| Average | 46% |
| Elections | |
| Fraud-free elections | 83% |
| All parties allowed | 82% |
| Candidates disclose information | 68% |
| No foreign influence | 35% |
| Campaign funds transparent | 34% |
| Participation high | 10% |
| Districts not biased | 7% |
| Average | 46% |
| Equality | |
| Equal opportunity to vote | 35% |
| Equal legal and political rights | 34% |
| Votes have equal impact | 24% |
| Contributions do not determine policy | 17% |
| Average | 28% |
| Norms | |
| Patriotism not attacked | 19% |
| Policy consensus recognized | 15% |
| Restraint and reciprocity | 15% |
| Compromise sought | 11% |
| Common understanding of facts | 10% |
| Average | 14% |
Appendix C: Changes in ratings of democratic performance (Waves 1/2)
| Statement | W1: Mostly + fully | W2: Mostly + fully | W2-W1 |
| Constitution limits executive | 51% | 39% | -12%* |
| Legislature can limit executive | 52% | 41% | -11%* |
| Equal legal/political rights | 43% | 34% | -9%* |
| No foreign influence | 42% | 35% | -8%* |
| Judicial independence | 65% | 58% | -6%* |
| Judiciary can limit executive | 80% | 76% | -4% |
| Fraud-free elections | 86% | 83% | -3% |
| No interference with press | 65% | 63% | -2% |
| Equal voting rights | 37% | 35% | -2% |
| Free speech | 81% | 80% | -1% |
| Restraint/reciprocity | 15% | 15% | -1% |
| All parties allowed | 83% | 82% | -1% |
| Sanctions for misconduct | 45% | 45% | -1% |
| Policy consensus recognized | 15% | 15% | 0% |
| Votes have equal impact | 24% | 24% | 0% |
| No political violence | 68% | 68% | 0% |
| No private gains from office | 28% | 29% | +1% |
| Patriotism not questioned | 17% | 19% | +2% |
| Agencies do not punish | 60% | 63% | +2% |
| Protest tolerated | 80% | ||
| Opinions heard on policy | 75% | ||
| Candidates disclose information | 68% | ||
| Investigations not compromised | 36% | ||
| Campaign funds transparent | 34% | ||
| Contributions not determine policy | 17% | ||
| Compromise sought | 11% | ||
| Participation high | 10% | ||
| Common understanding of facts | 10% | ||
| Districts not biased | 7% |
* p<.05
Appendix D: Assessments of U.S. Democracy
| Year | Rating |
| 1800 | 30.78 |
| 1850 | 35.10 |
| 1900 | 46.18 |
| 1950 | 58.67 |
| 1975 | 75.31 |
| 1985 | 76.90 |
| 1995 | 78.16 |
| 2005 | 75.27 |
| 2015 | 75.78 |
| 2017 | 67.11 |