American Democracy on the Eve of the 2022 Midterms
Bright Line Watch October 2022 surveys
Two years ago, America’s democracy was tested when Donald Trump refused to concede Joe Biden’s presidential win, a violent mob stormed the Capitol to try to prevent the certification of Biden’s victory, and a majority of congressional Republicans, including two-thirds of House members, voted against certifying the result. Public confidence in democratic institutions dropped immediately afterward among Republicans and did not rebound in 2021. As the country approaches its first national elections since the failed effort to overturn the 2020 election and the January 6 insurrection, numerous tallies show that substantial numbers of Republican candidates for federal or statewide office deny the legitimacy of the 2020 election, including nominees for Secretary of State in states like Arizona and Nevada that could decide the 2024 election.
In this context, we fielded parallel public and expert surveys to assess the status of U.S. democracy. These surveys were conducted October 5–14 among 682 political scientists and a representative sample of 2,778 Americans. Our key findings are the following:
-
The gap between Republicans and Democrats in confidence in American elections remains large, but has diminished in the past year. Compared to November 2021, somewhat more Republicans recognize the legitimacy of Biden’s 2020 victory and express confidence in the integrity of the vote count in the upcoming midterm elections.
-
Both experts and the public, including four in five Republicans, say it is important for candidates who lose fair elections to publicly acknowledge defeat, but hundreds of 2022 Republican candidates for Congress or statewide office continue to deny that former President Trump lost to Joe Biden in 2020 or question the legitimacy of Biden’s victory. Across the three most comprehensive media tallies, the estimated percentage of deniers among Republicans is 31% for Attorney General candidates, 49% for governor, 31–39% for Secretary of State, 41–55% for U.S. House, and 35–41% for U.S. Senate. These ratings are generally consistent; about 80% of ratings are identical between organizations.
-
Experts rate the prevalence of 2020 election denialism among Republican candidates for statewide office as the most abnormal and important event of the past year and one of the most extreme to take place since 2016.
-
91% of experts rate a 2024 Trump candidacy as a threat to democracy, including 35% who rate it as an extraordinary threat and 39% who rate it as a serious threat.
-
70% of experts view a prosecution of Trump as beneficial to U.S. democracy, including 16% who rate it as an extraordinary benefit and 35% who rate it as a serious benefit.
-
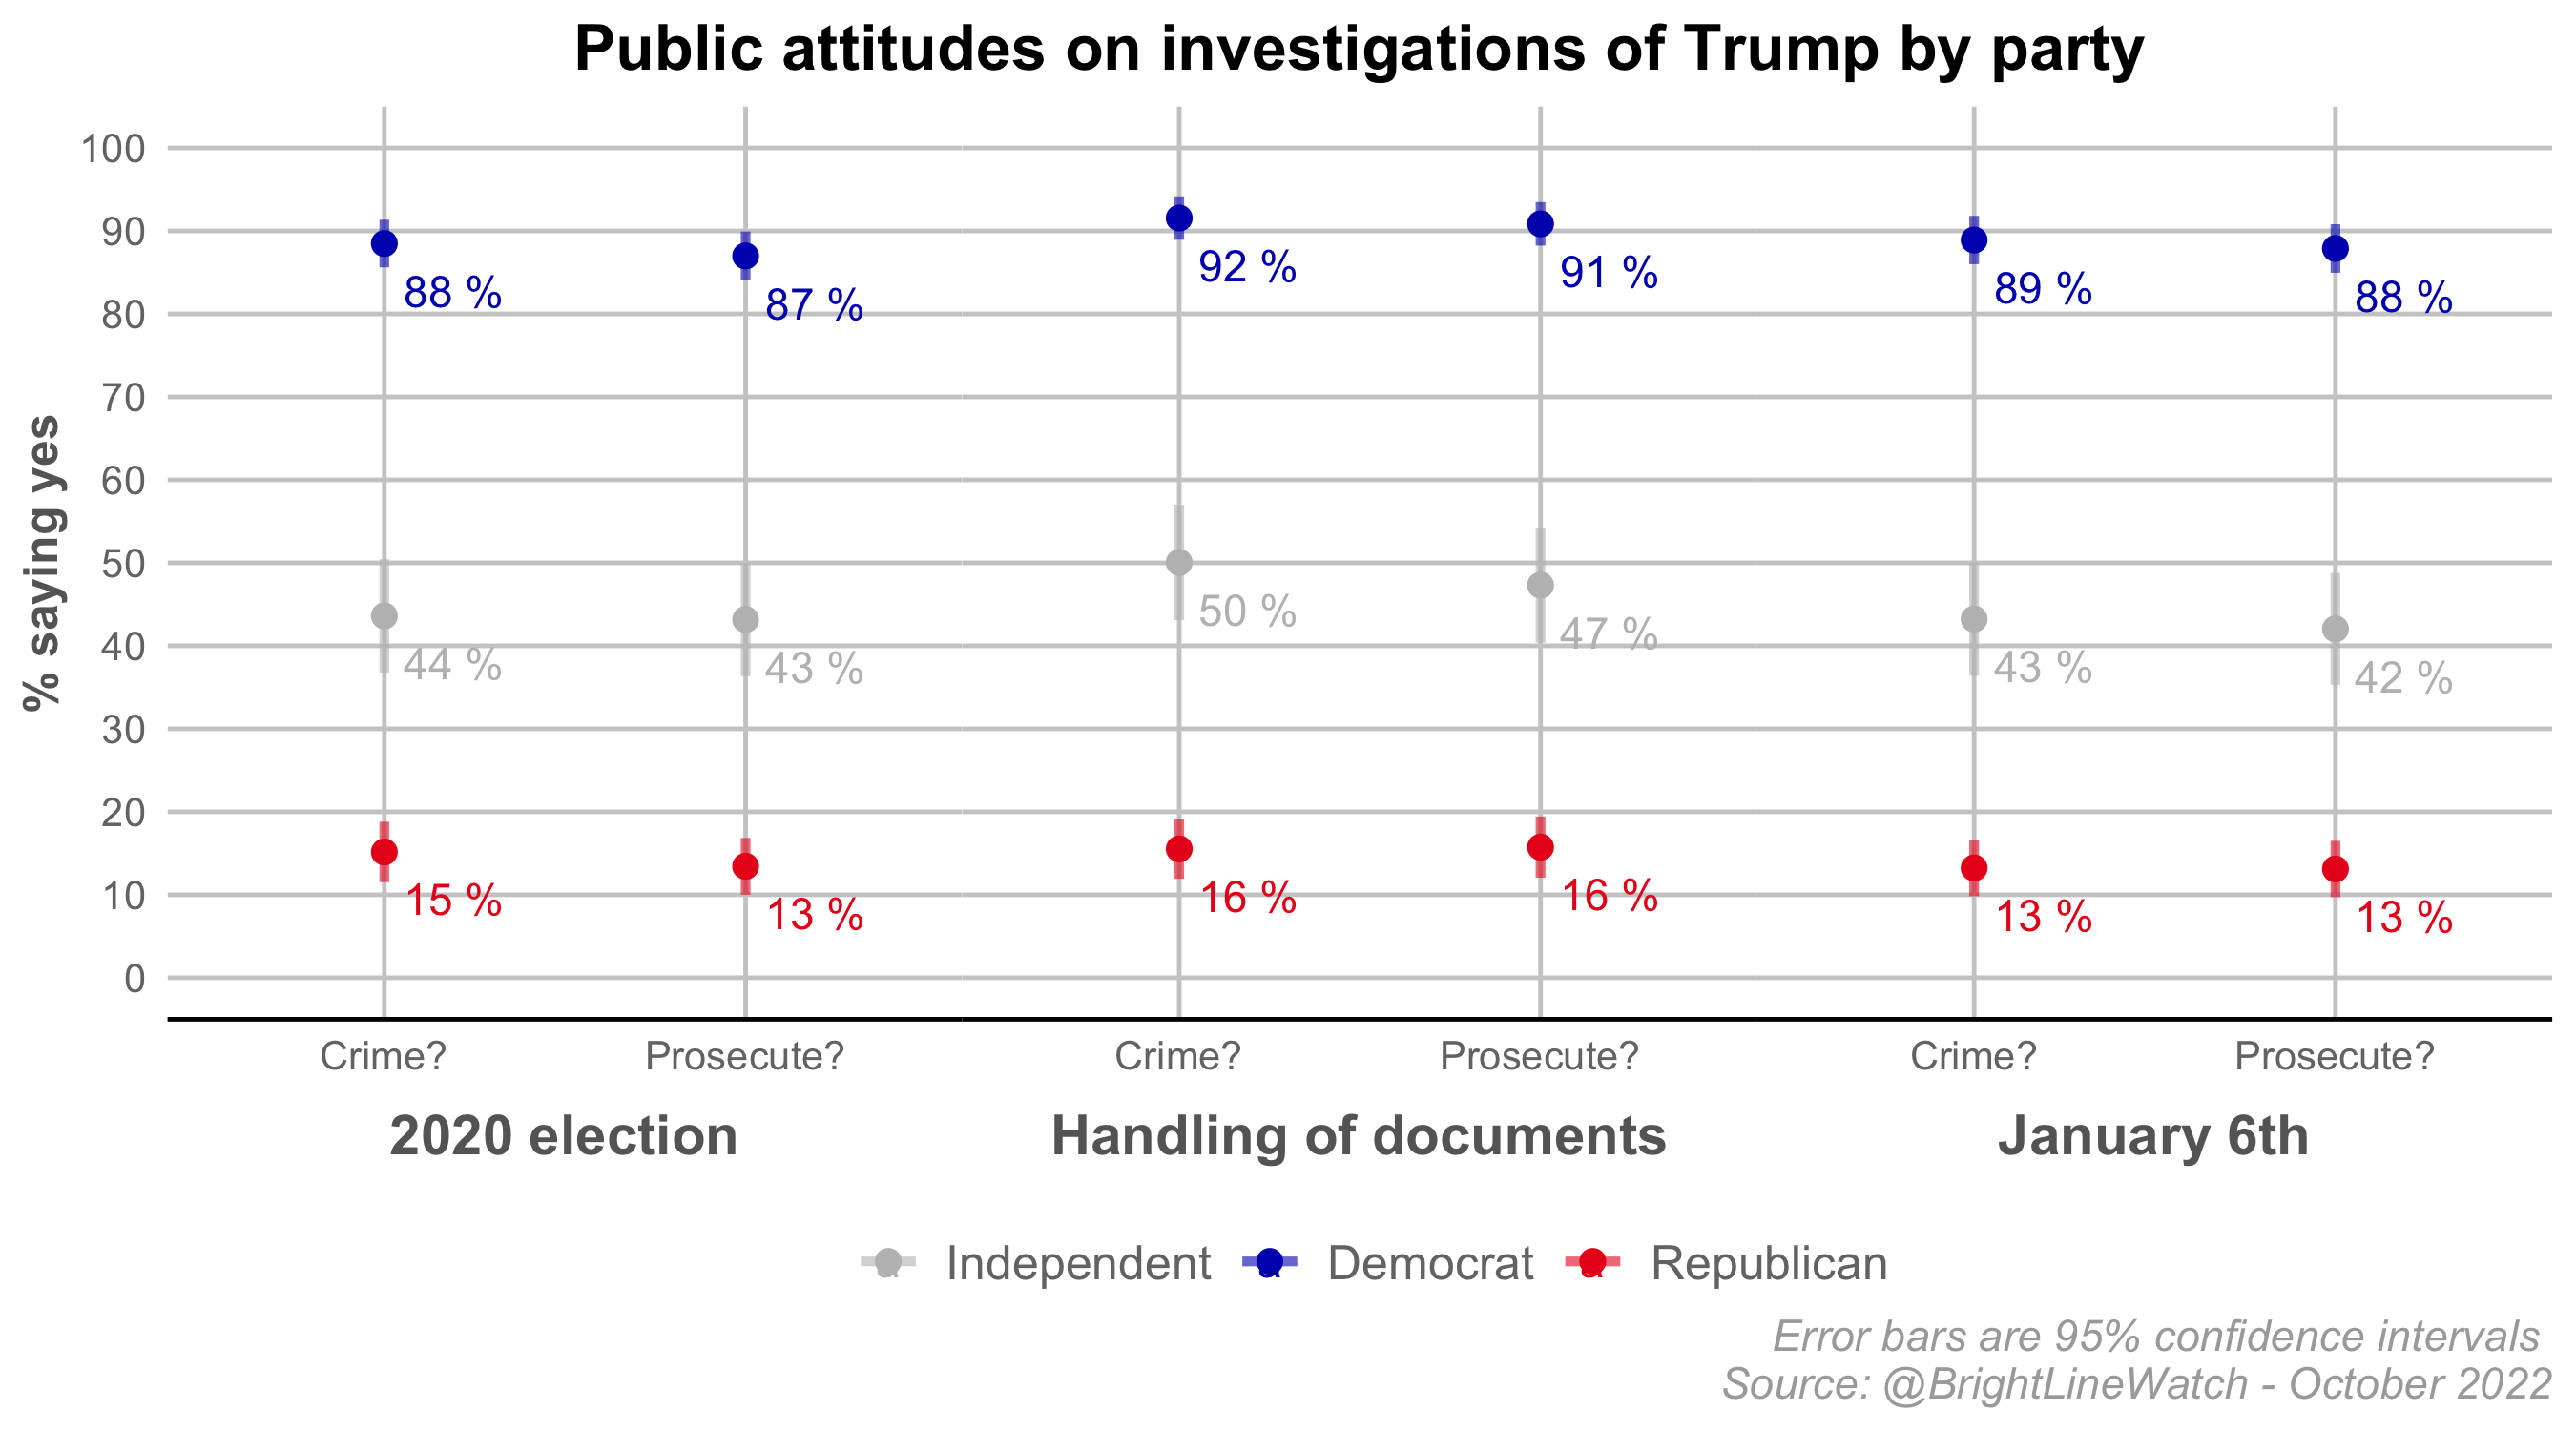
Majorities of the public believe Trump committed crimes in trying to overturn the 2020 election, in his actions related to the January 6 attack on the U.S. Capitol, and in handling classified documents and favor prosecution for each. However, the partisan splits on these issues are profound – approximately 90% of Democrats favor prosecution and close to 90% of Republicans oppose it. Experts overwhelmingly support prosecution.
-
The academic experts we surveyed anticipate that some high-profile candidates in the 2022 midterm elections will refuse to concede. They also anticipate continued politicization of Supreme Court appointments.
-
Experts are divided, however, on whether the Supreme Court will endorse the Independent State Legislature theory, which would allow state legislatures to regulate elections without constraint from institutions such as state courts and constitutions.
-
Assessments of the performance of U.S. democracy are stable and consistent with past surveys, but every group surveyed – experts and the public, Democrats and Republicans – anticipates a decline in the quality of U.S. democracy five and 10 years in the future.
-
Experts assess the quality of democracy in other countries as having mainly declined since we last surveyed on this in 2018. However, partisan polarization in perceptions of democracy abroad is less pronounced than for democracy in the United States.
-
Among our sample of academic experts, those who post regularly about democracy on Twitter are more pessimistic about democracy’s future than those who do not.
Confidence in the 2020 and 2022 elections
We start by revisiting the question of whether the public regards Joe Biden as the rightful winner of the 2020 presidential election – a key question for the legitimacy and stability of U.S. democracy. In surveys throughout 2021, we found stark partisan polarization, and remarkable stability, on this question. As the figure below indicates, that pattern persisted. However, Republican doubts about Biden’s legitimacy did soften since our last poll in November 2021.
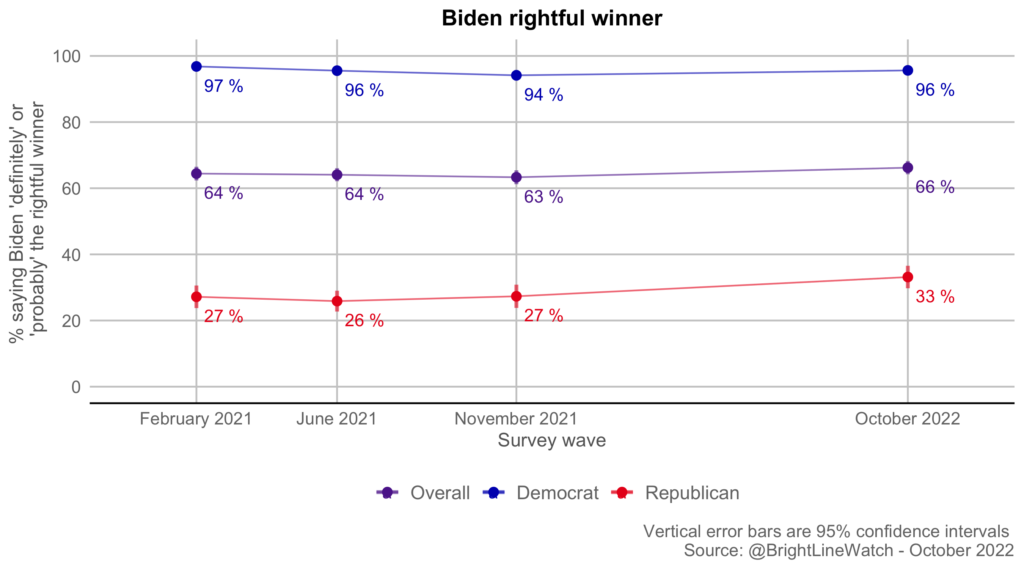
Overall, about two-thirds of Americans recognize Biden as the rightful winner. Democrats have been nearly unanimous on Biden’s win from the outset and remain so, with 96% recognizing his victory. For the first time since the 2020 election, we observe substantial movement among Republicans, 33% of whom now regard Biden as the rightful 2020 winner, up significantly from 27% in November 2021. The partisan gulf on this question remains vast, with a large majority of Republicans still not recognizing Biden’s win. Still, the measurable change in Republican recognition of Biden’s legitimacy, which mirrors other recent survey data, is noteworthy.1
We also asked respondents to separately report their confidence that their own vote, votes in their state, and votes nationwide in the November 2022 midterm elections would be counted as voters intend. The results are illustrated in the figure below. Two patterns are clear. First, consistent with other polls, confidence in the integrity of the vote count at each level is far higher among Democrats than among Republicans. Second, within each group, confidence is highest for one’s own vote and declines at higher levels of aggregation. The decline by level is most pronounced among Republicans – just 49% say they are “very” or “somewhat confident” in the national vote count compared to 67% for the state vote count and 68% for their own vote.
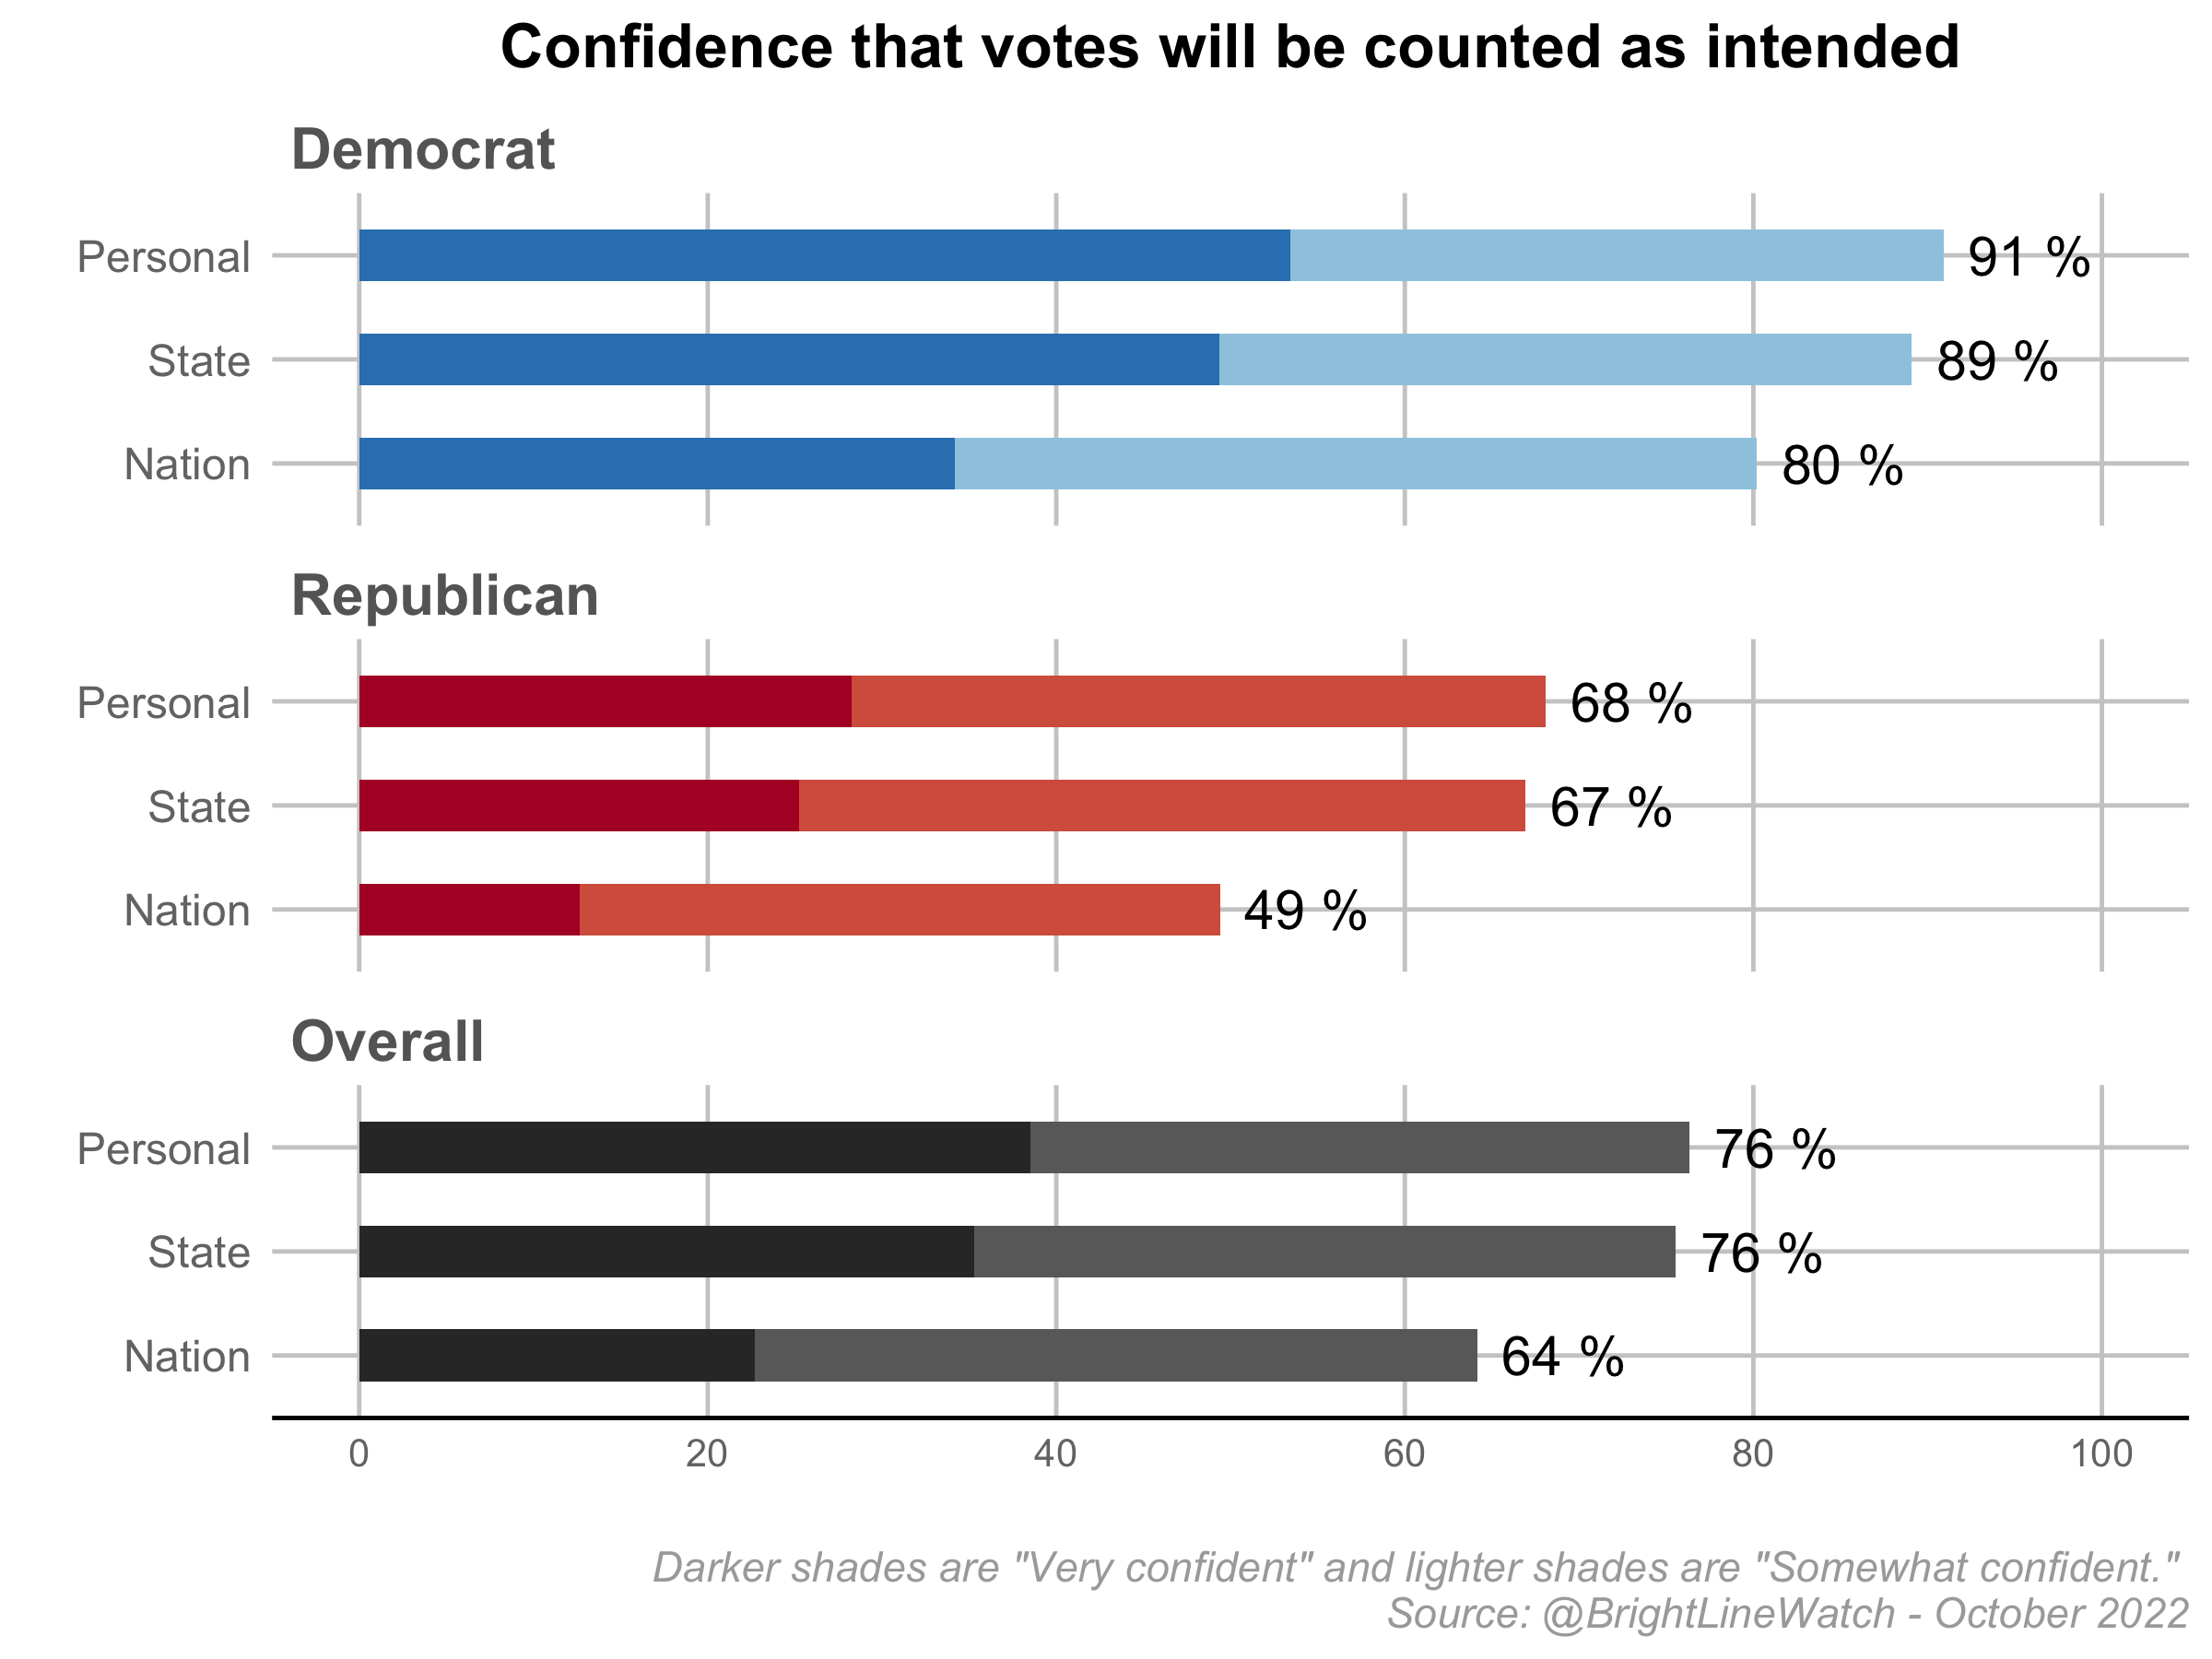
We note, however, that 49% of Republicans expressed confidence in the national vote count, which is seven percentage points higher than what we found in November 2021 – a trend that is consistent with the greater belief Republicans expressed in the legitimacy of Biden’s victory in this survey. However, confidence in the national vote count among Republicans is still well below the 58% we recorded in October 2020.
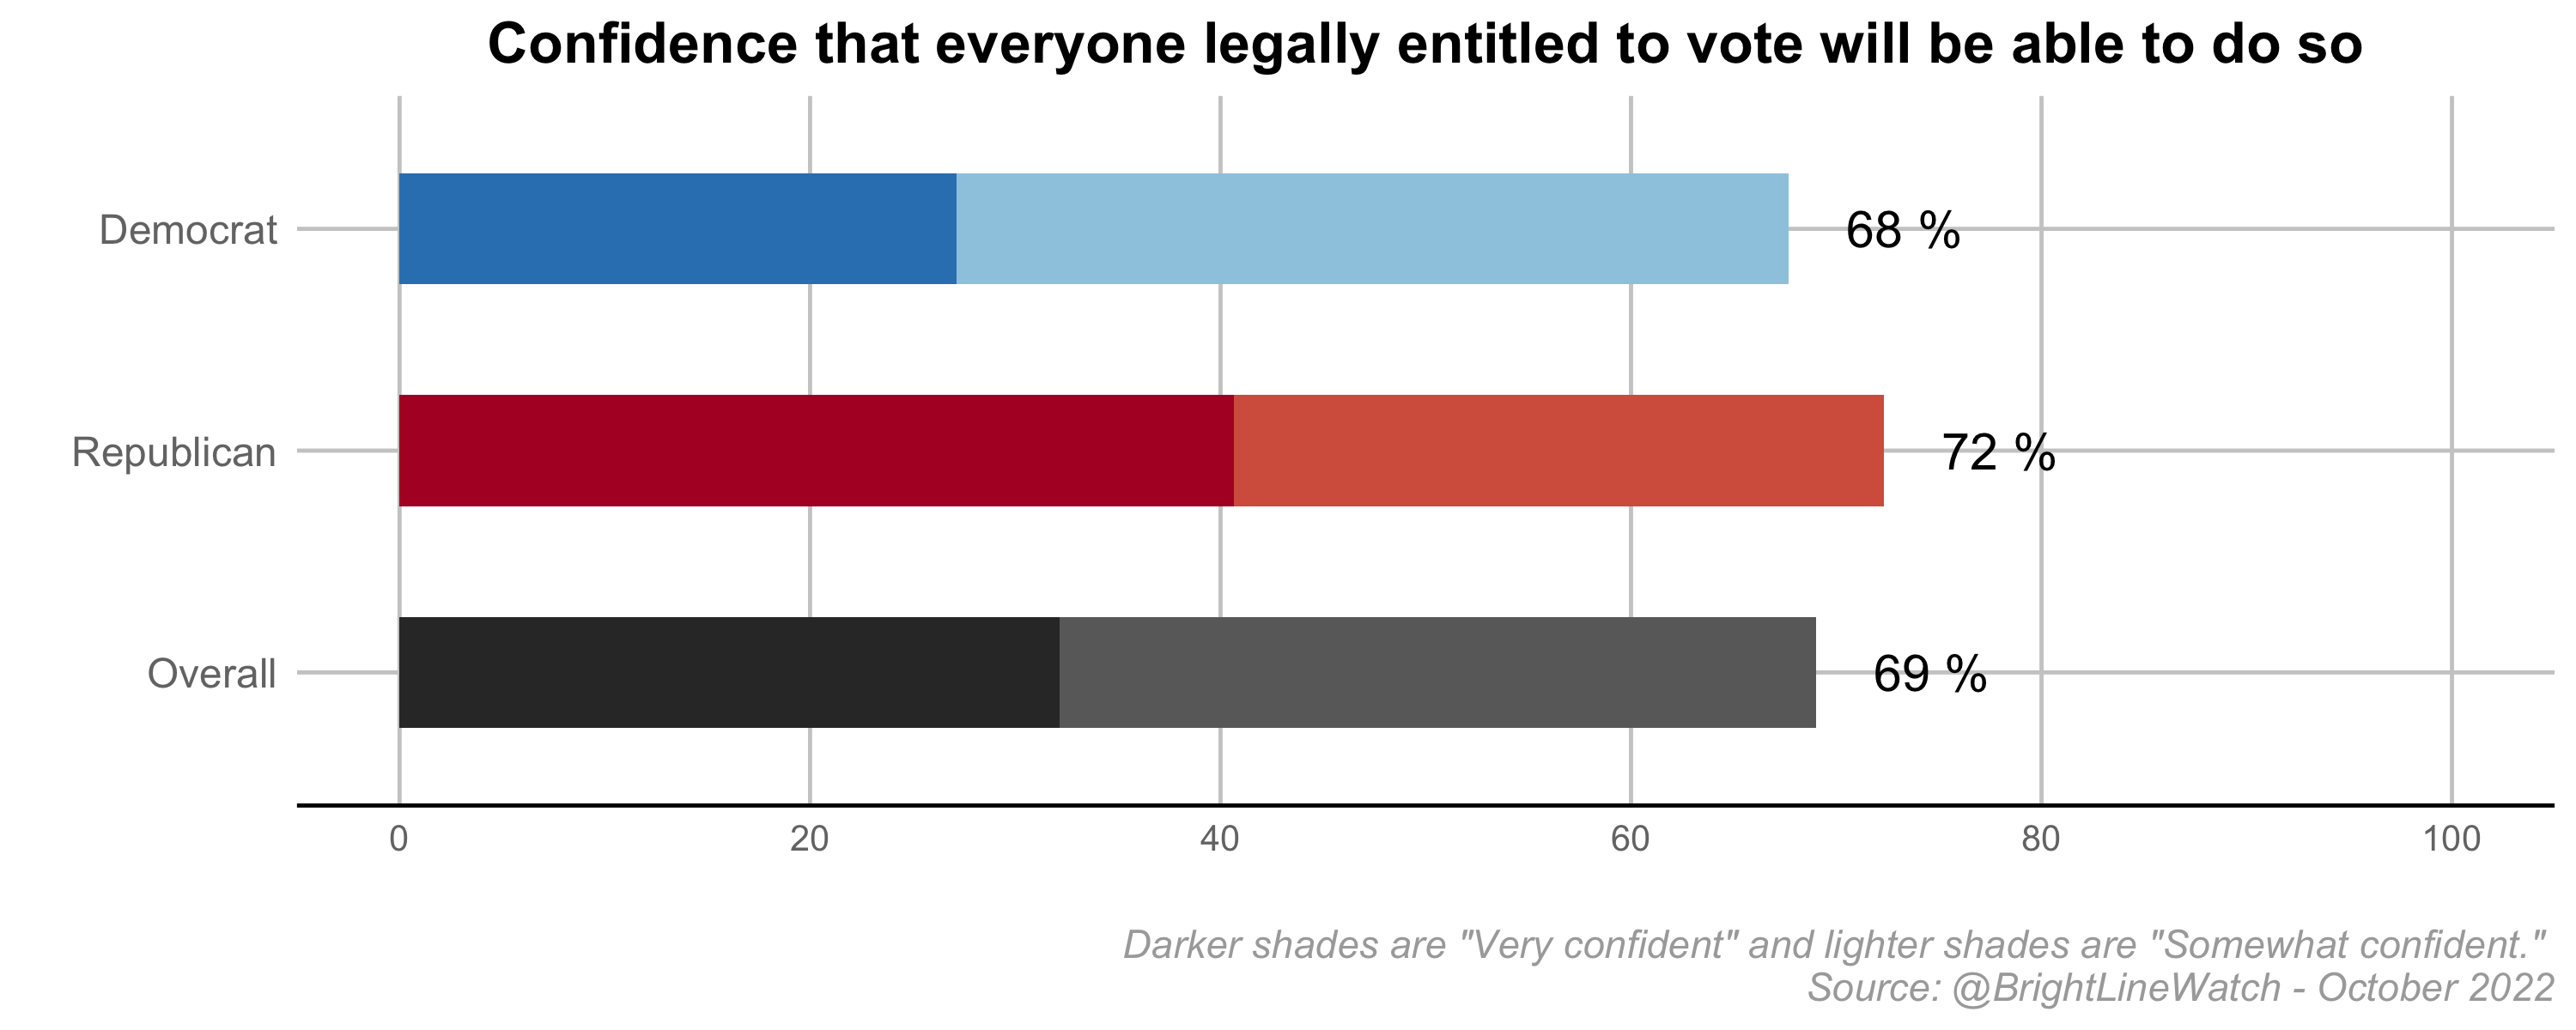
We also asked respondents about their confidence that everyone who is legally entitled to vote and seeks to do so will be able to cast a ballot in the November 2022 election. The next figure presents responses overall and by respondent partisanship. Seventy-two percent of Republicans are confident that voting is sufficiently accessible, a figure that hasn’t changed significantly from a year ago. On this issue, the movement is among Democrats, with 68% confident in ballot access versus 61% last year. This increase might be driven by a change in issue salience rather than a change of heart. Throughout 2021, Democrats were animated in opposition to initiatives in a number of states placing restrictions on voting. During 2022, Democratic preoccupations shifted toward reproductive rights and the economy.
Conceding defeat
In January 2021, we asked our expert and public respondents how important it is to democracy that “Politicians who lose free and fair elections will concede defeat.” The experts nearly uniformly (94%) rated conceding defeat as “essential” or “important” to democracy (versus “beneficial… but not required” or “not relevant” to democracy). The numbers were lower among the public (68%), with higher priority expressed by respondents who disapproved of former President Trump (79%) compared to Trump supporters (54%).
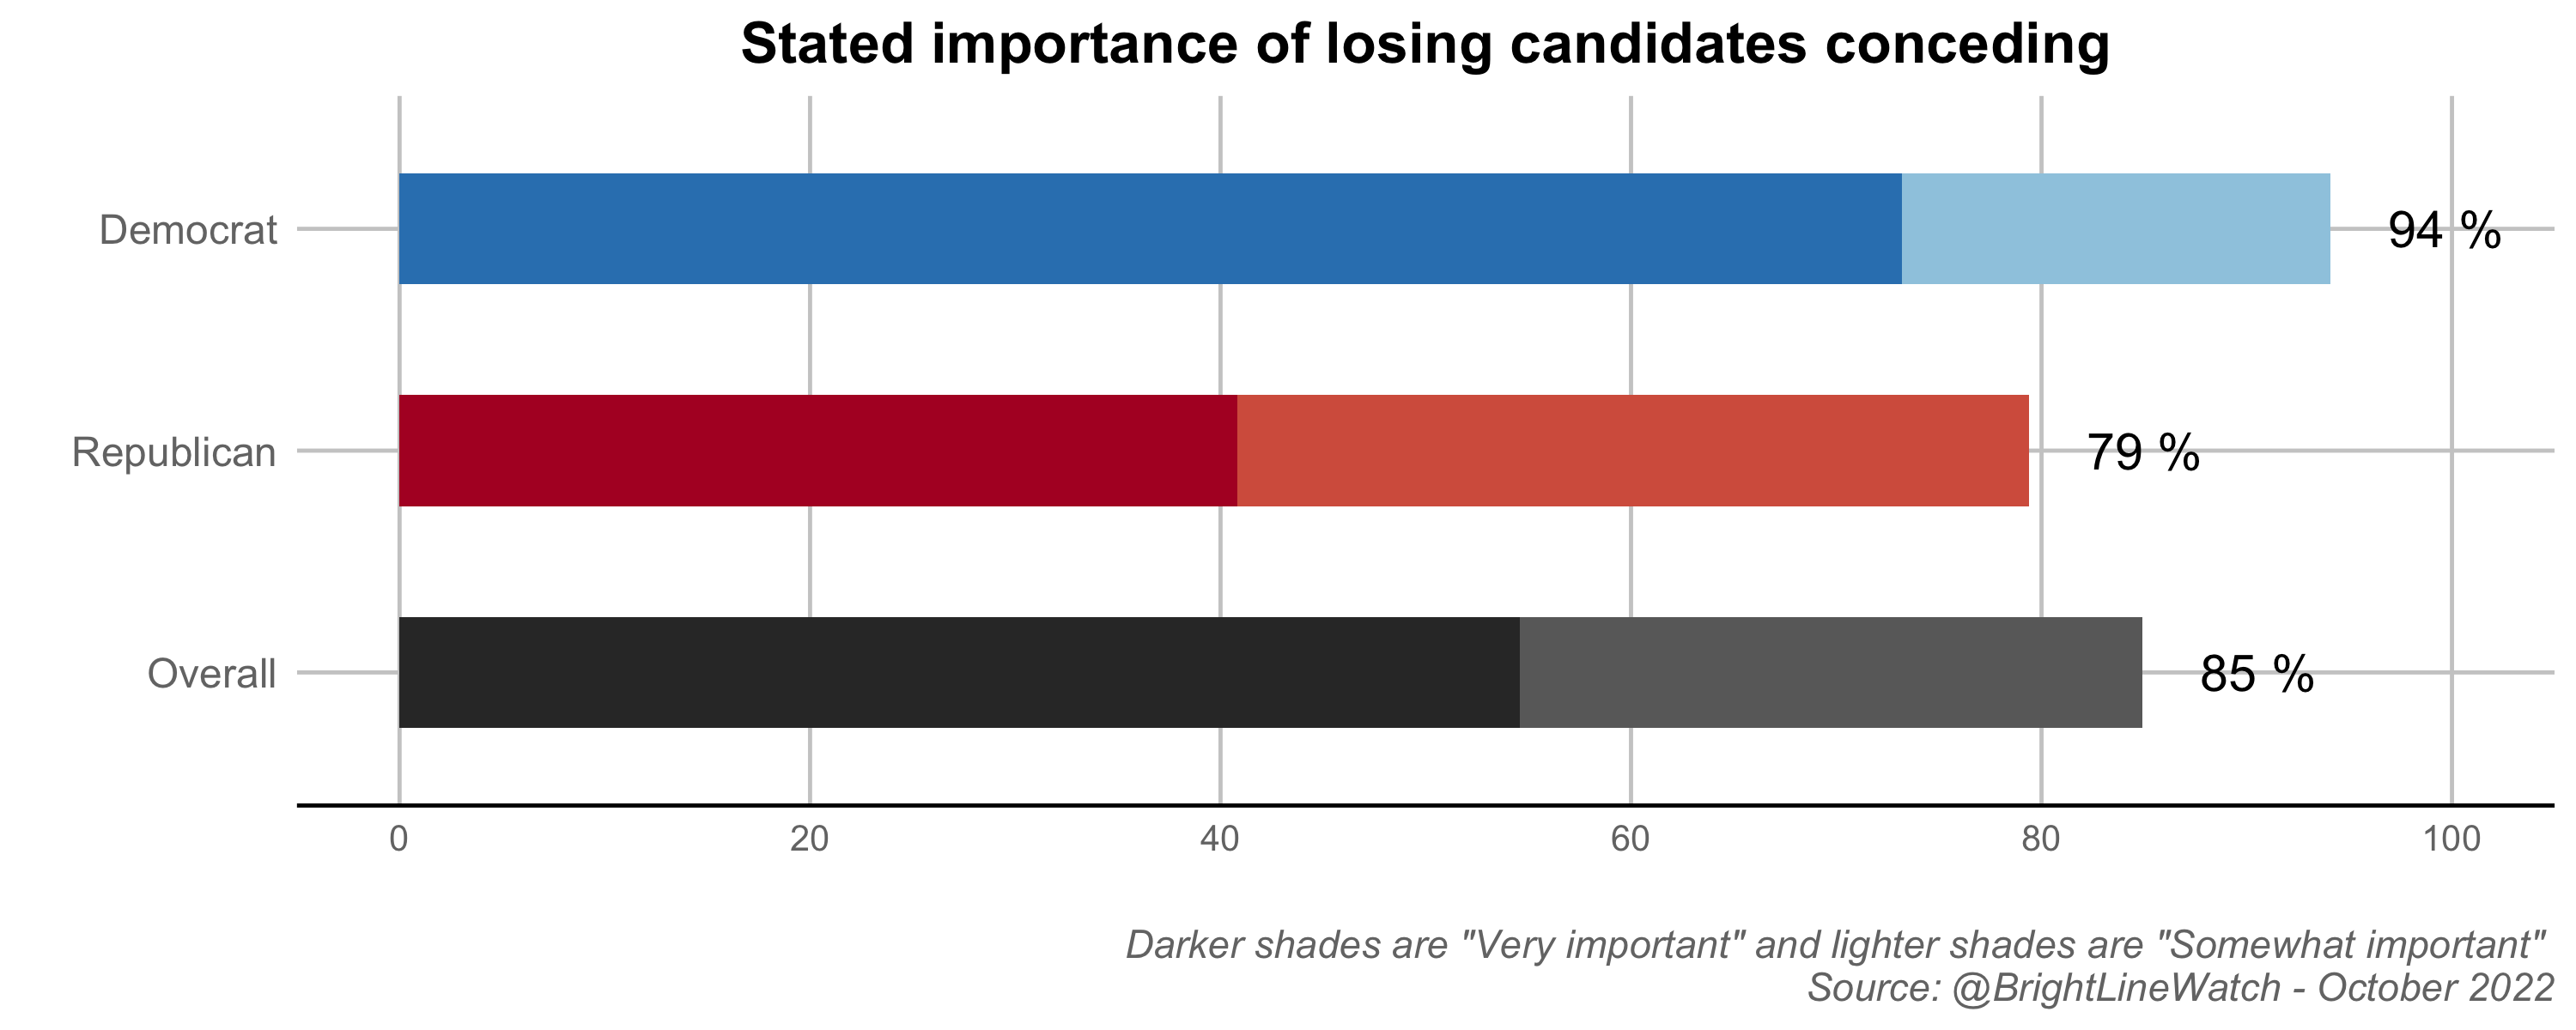
In our October 2022 survey, we asked our public sample to say how important they think it is “for a losing candidate for Congress to publicly acknowledge the winner as the legitimate representative of the state or district” in November’s elections. The figure below breaks out responses by partisan group. Overall, 85% regard it as “very” or “somewhat important” for losing candidates to acknowledge defeat publicly (versus “not too important” or “not at all important”), with a higher rate among Democrats (94%) than Republicans (79%).
We also asked the public and experts to evaluate the degree to which this principle is upheld in American politics. Ratings on performance are lower than on importance – 34% of experts and 38% of the public rated the U.S. as fully or mostly meeting this standard compared to 40% of experts and 34% of the public, respectively, in November 2021.
Willingness to concede defeat – in both past and future elections – has become a central point of contention among candidates around the country. In Republican primaries this year, denying the validity of President Biden’s 2020 election became a marker of fealty to the party base. A variety of news organizations published tallies of candidates who supported this narrative. To determine a candidate’s status as an election denier, these sources drew on candidates’ campaign statements, debate footage, and social media posts, endorsement of lawsuits, and (for members of Congress) opposition to certification of Biden’s election.2 We combined lists constructed by the Washington Post, Bloomberg, and FiveThirtyEight to provide the most comprehensive measure of the prevalence of Republican candidates for high office who deny the 2020 election result.3 Our results are illustrated in the figure below, which is based on data from the 522 candidates rated by all three outlets.
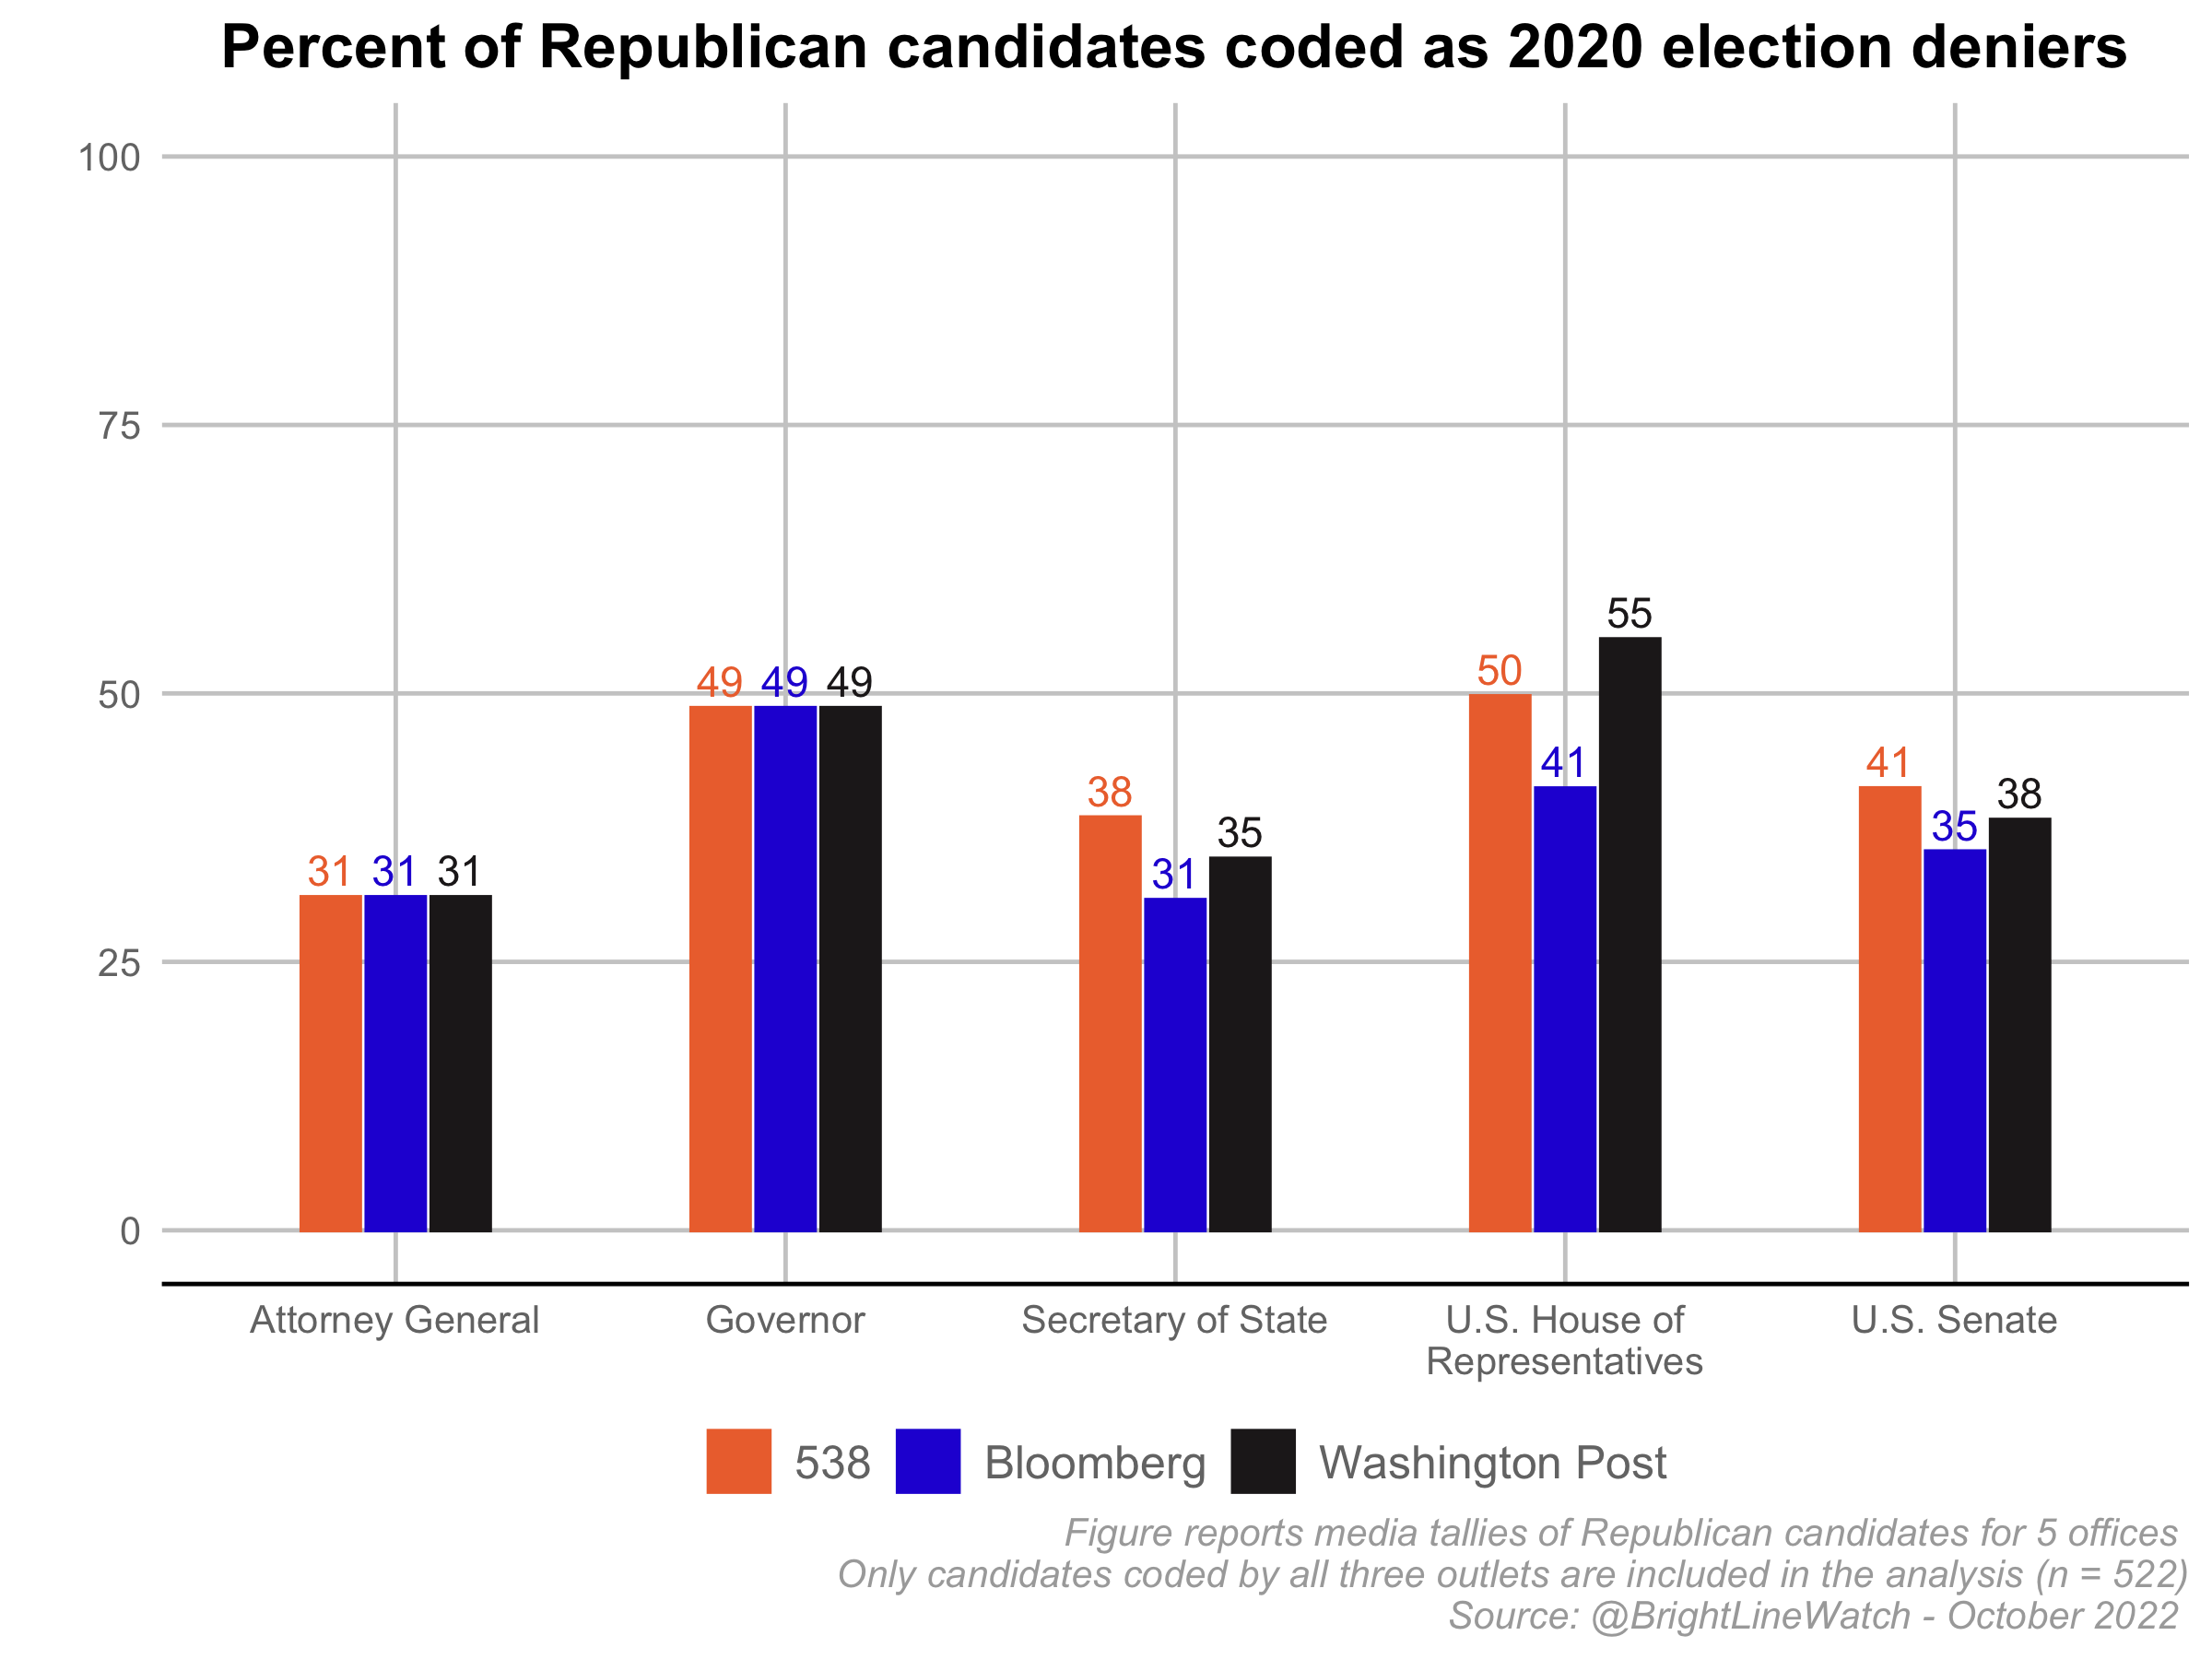
For Attorney General, each outlet codes eight of 29 (28%) candidates as deniers. Six of the 29 Republican candidates (21%) are coded as deniers by all three outlets and 5 are coded as deniers by one or two outlets (17%). For Governor, each outlet codes 18 of 37 Republican candidates (49%) as deniers. 12 (32%) are coded as deniers by all three outlets and 12 (32%) are coded as deniers by one or two outlets. For other offices, between a third and just over half of Republican candidates are categorized as deniers, with more variation across sources than in the codings than for governor and attorney general. For Secretary of State, the outlets code the percentage of deniers as 31–39%. A total of 23% of Republican Secretary of State candidates are coded as deniers by all three sources while 19% are coded as deniers by one or two sources. Among U.S. House candidates, 41–55% of Republicans are coded as deniers by the three outlets. In total, 33% of Republican House candidates are coded as deniers by all three sources and 29% are coded as non-deniers by one or two sources. Finally, 35–41% of Republican U.S. Senate candidates are coded as deniers across outlets. 24% were coded as deniers by all three sources and 26% were coded as deniers by one or two sources.4 Searchable data on all candidates and how they were classified by each source are here.
Donald Trump’s legal status
Former President Trump faces potential legal exposure from a grand jury investigation into allegations that he pressured Georgia’s Secretary of State into fraudulently changing electoral results, possible charges related to his role in the January 6, 2021 attack on the U.S. Capitol, and an FBI investigation into his handling of classified documents after leaving the presidency. We asked both our expert and our public respondents to assess whether committed a crime in each case and if he should be prosecuted for such a crime. The issues were described as follows:5
-
His efforts to change the results of the 2020 presidential election
-
His role in the events of January 6, 2021
-
His handling of classified documents after leaving the White House
On each matter, we asked each respondent whether they think Trump committed a crime and whether they think he should be prosecuted.
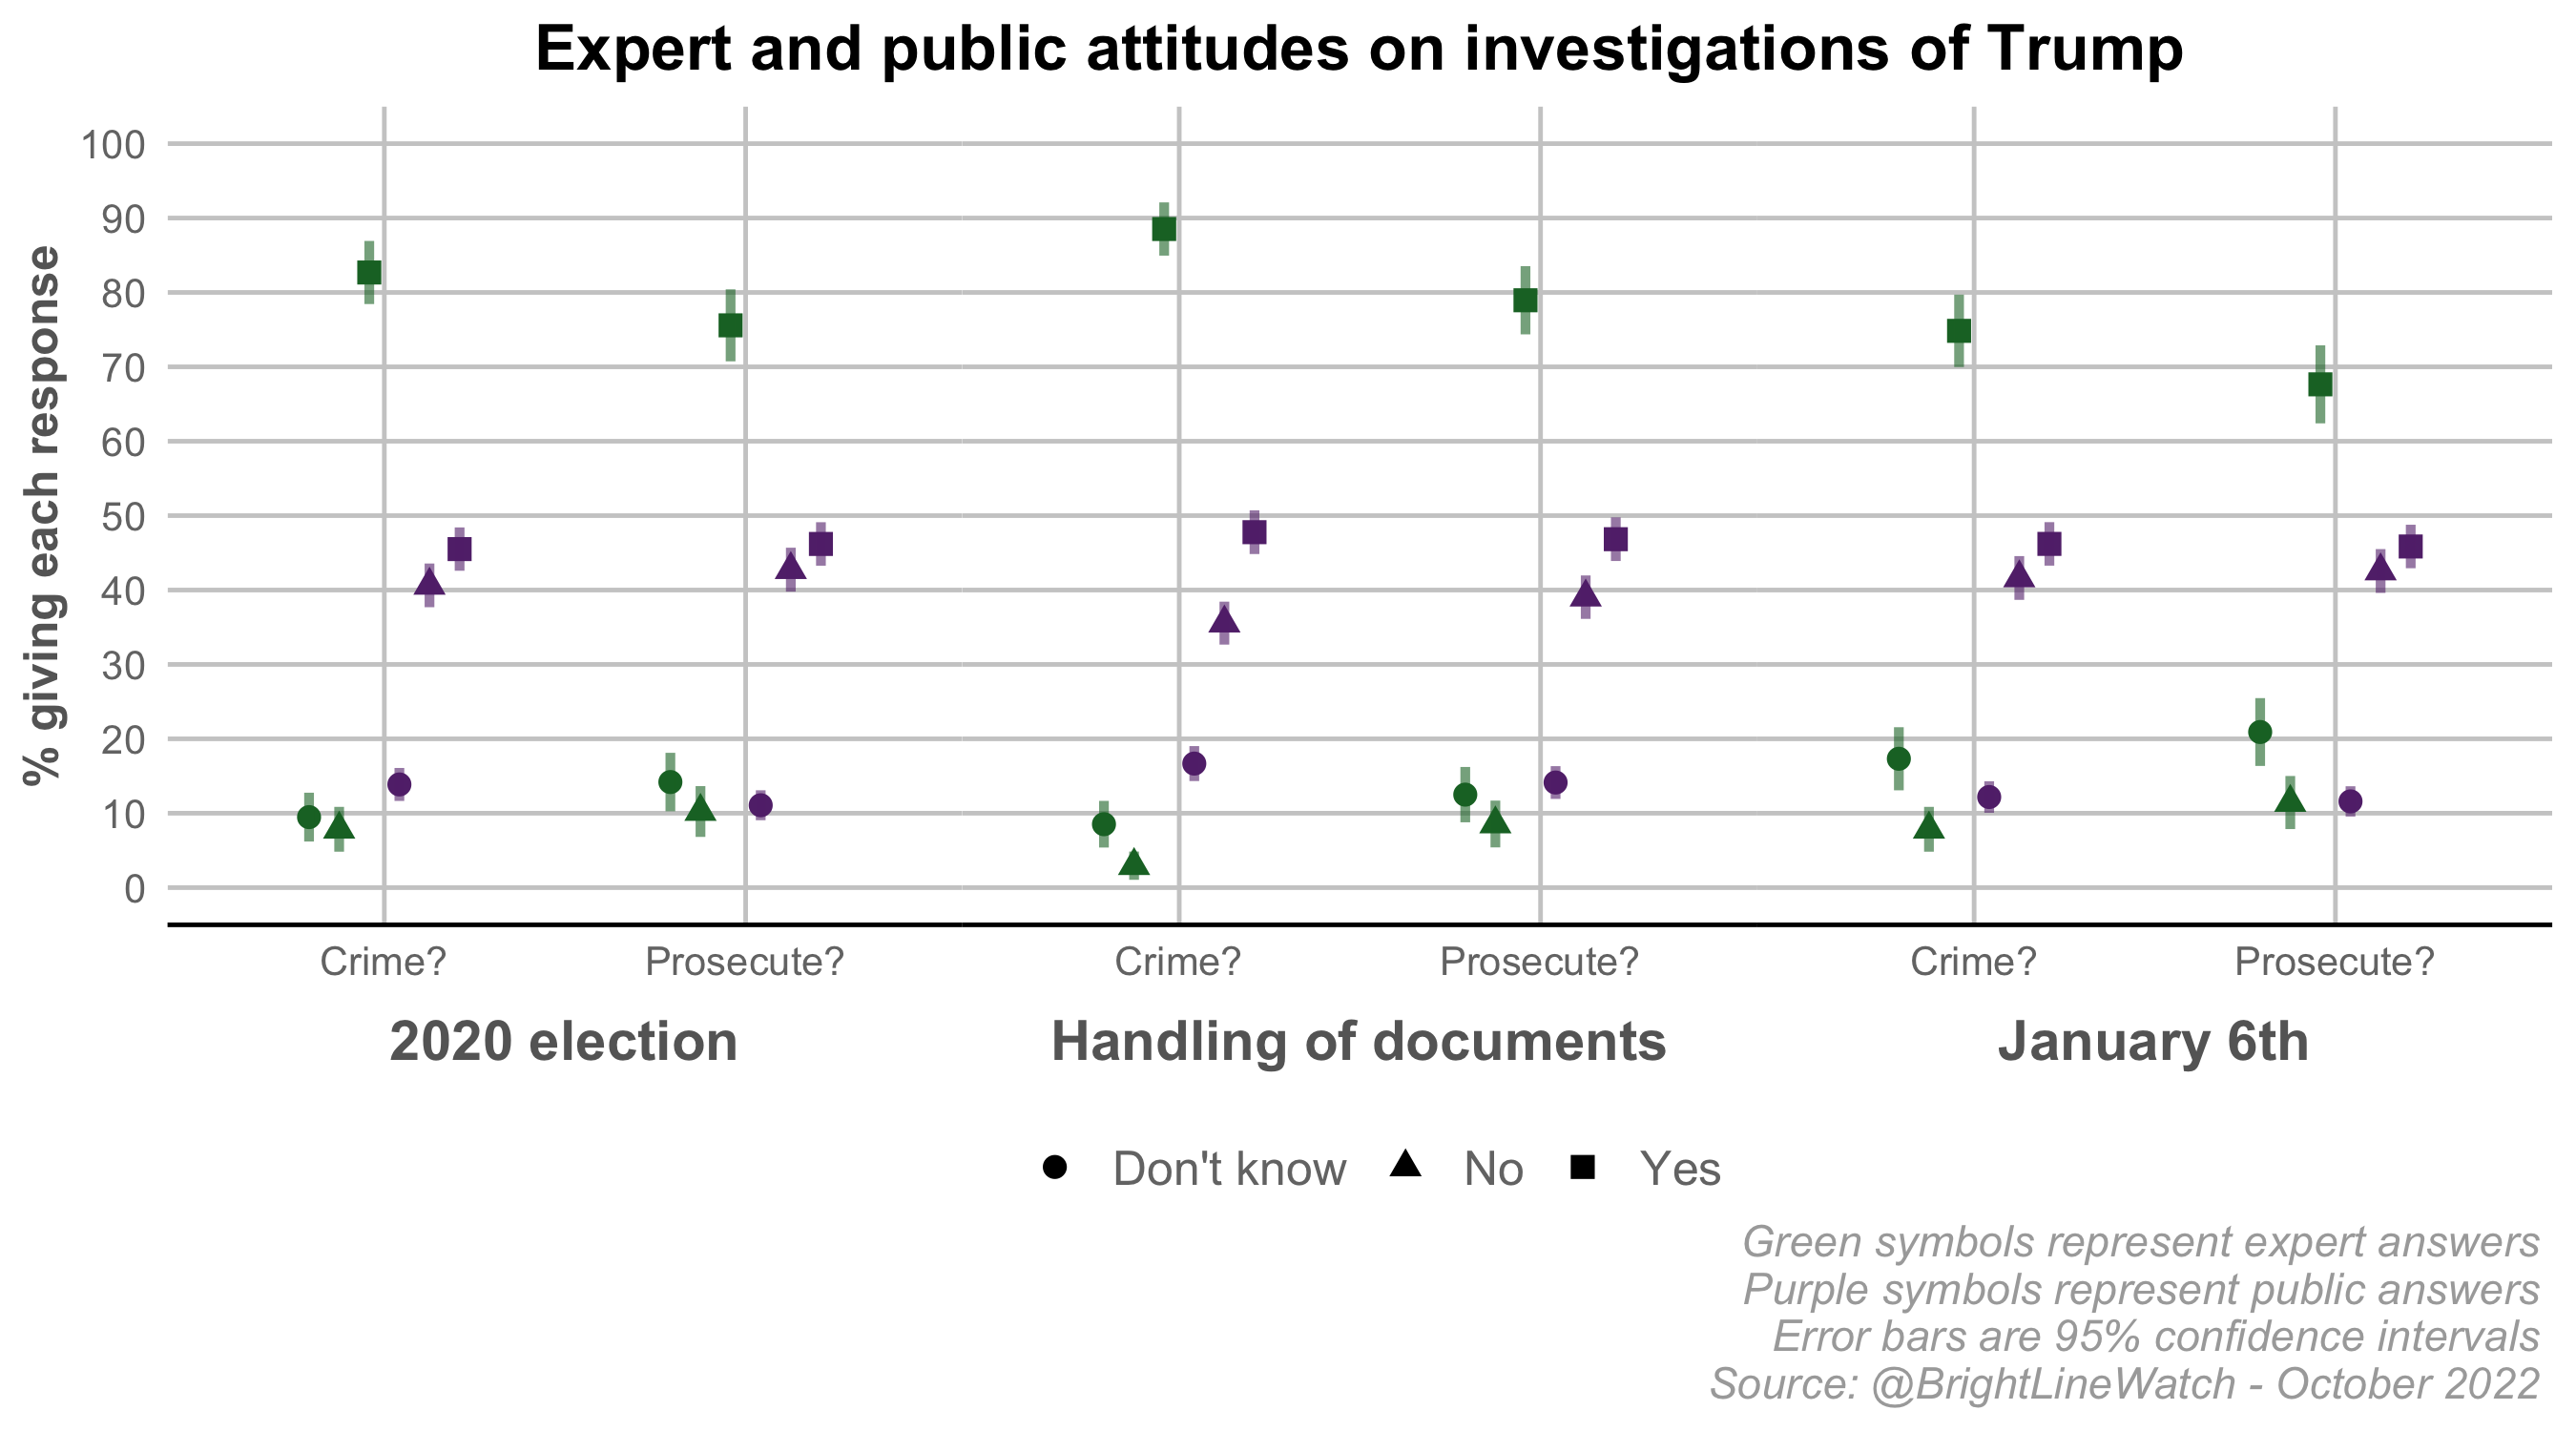
The following figure shows responses to each question for the experts and for the public overall. Three patterns are immediately apparent. First, on each issue, clear but narrow majorities of the public believe Trump committed crimes and that he should be prosecuted.6 Second, the expert respondents are far more likely than the public to hold both of these beliefs. Third, the correlation between believing Trump committed a crime and believing that he should be prosecuted is stronger among the public than the experts. Among the public, 94.4% of respondents who perceive a crime also favor prosecution. Among the expert sample, this relationship is slightly weaker.

The next figure shows the same set of responses for the public broken down by partisanship. The partisan chasm on Trump’s criminal culpability is even deeper than on the integrity of American elections, highlighting the deep polarization that underlies the steady pattern of majority support in the figure above. On each item, around 90% of Democrats believe that Trump committed a crime and should be prosecuted. Among Republicans, the corresponding figures are in the 10–15% range. Partisan independents fall in the 40–50% range depending on the issue. Here again, support for prosecution is tightly bound to belief in criminality. In no instance is the proportion who believes Trump committed a crime statistically discernible from the proportion favoring prosecution overall or within a given partisan group.7
Democratic performance
As in previous surveys, we asked each expert and public respondent to rate the overall performance of American democracy on a scale from 0 to 100. In this survey wave, we also asked respondents to forecast the expected performance of American democracy in five years and in 10 years, on the same scale. The figure below reports the average ratings for various groups of respondents. The solid lines track expert and public assessments from February 2017 to October 2022; the dotted lines show future predictions.

Contrary to criticisms that academics overrate threats to American democracy, the experts (green) consistently rate democracy more positively than the public does. Mean expert ratings have ranged from 60 to 69 on the 100-point scale over the past five years and were 67 in October 2022. Assessments among the public overall (purple) have been steadier, ranging from 53 to 58, and are at 55 in the most recent survey. Among the public, Democrats’ and Republicans’ ratings depend on which party controls the White House. From 2017 through 2020, mean Republican ratings were, on average, eight points above those of Democrats, a pattern that flipped after Biden took office. In October 2022, the average rating among Democrats was 60 compared to 54 among Republicans.
What all groups share – experts and public, Democrats and Republicans – is pessimism about American democracy in the years ahead. The experts, on average, anticipate a drop from 67 to 60 in five years and to 59 in ten years. Among the public, those numbers are 55 (October 2022) to 53 (2027) to 51 (2032), with similar trajectories among Democrats (60, 58, and 57, respectively) and Republicans (54, 51, and 50, respectively). Pessimism about U.S. democracy might have different roots between the parties and among people with different levels of political engagement, but everyone is pessimistic.
Is the Twittersphere different?
Debates continues to rage over whether social media has a deleterious effect on democracy. Twitter is often singled out for its heightened level of political rhetoric, including within online academic communities. Yet the degree to which Twitter content is representative of broader political attitudes is an open question in light of demographic and political differences in who uses the platform, the fluidity of the groups that interact on it, and the vast skew in content production toward a small minority of users who generate the vast majority of tweets.
In this survey wave, we sought to determine whether appraisals of American democracy within our expert sample of political scientists vary with respondents’ degree of Twitter engagement. We included two questions on the expert survey about whether, and how often, respondents use Twitter and, if so, do they tweet about issues related to the state of American democracy. The figure below shows our current democracy ratings, and forward-looking projections, breaking out those who tweet on American democracy once a week or more frequently (11% of respondents) from the rest of our expert sample.
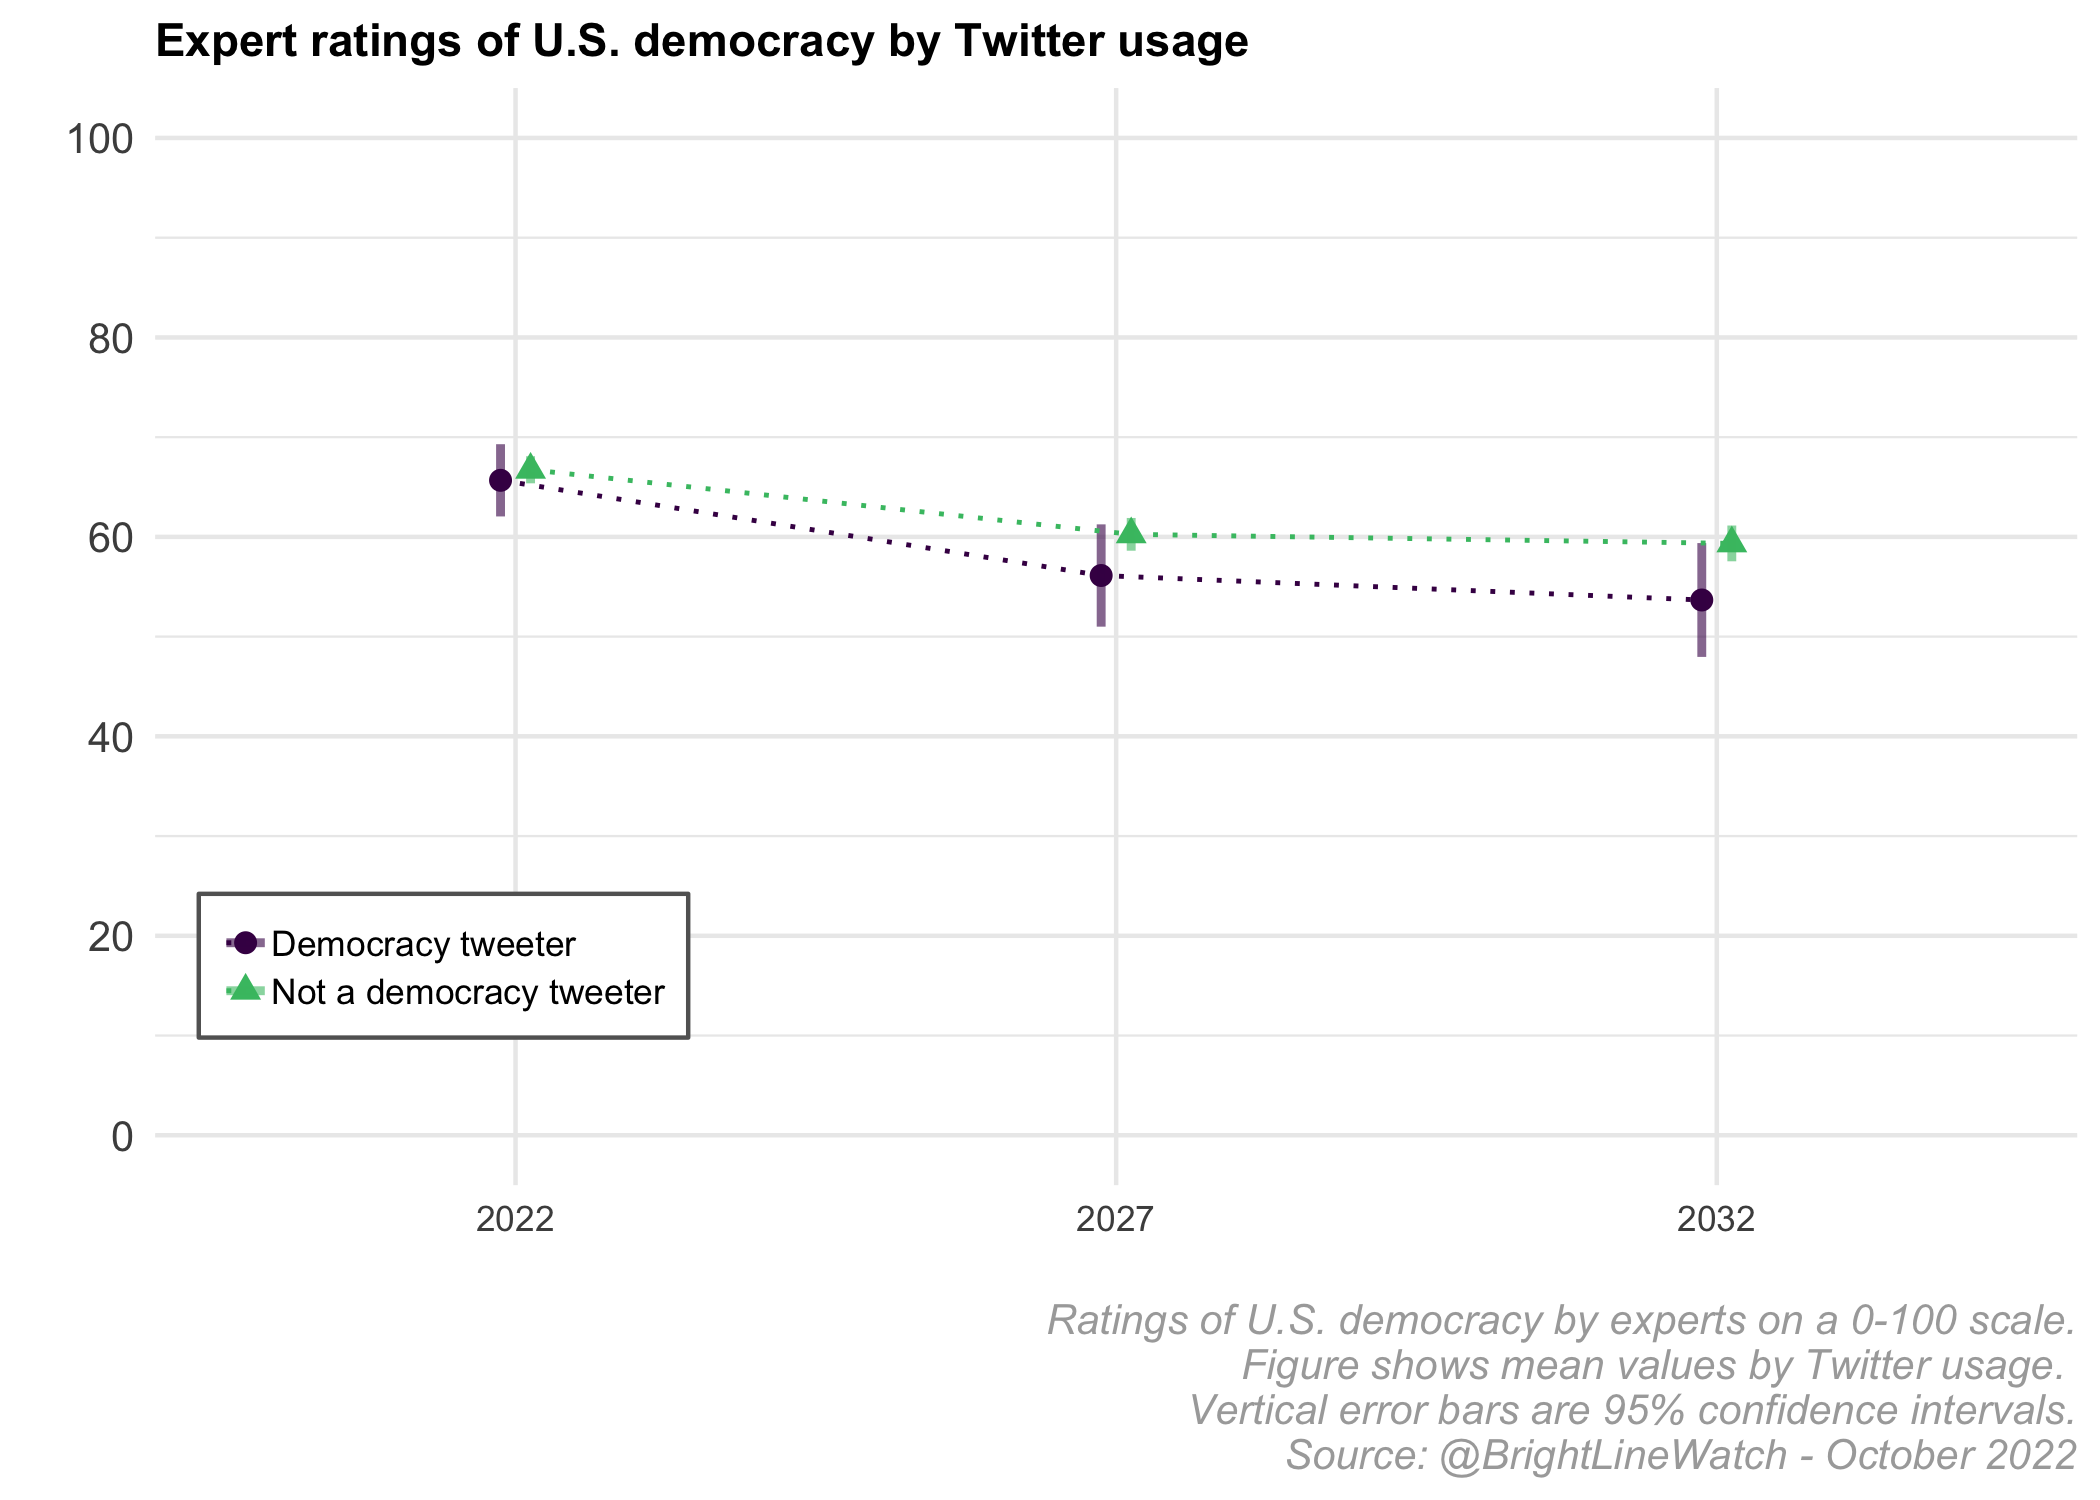
On assessments of current democracy, the groups’ mean ratings are nearly identical – 66 and 67, respectively, for experts who tweet about democracy frequently and those who do not. Projecting into the future, both groups anticipate democratic erosion but those who tweet about democracy are somewhat more pessimistic, anticipating a rating of 56 in five years compared to 60 for other experts and a rating of 54 in ten years versus 59 for other experts. We caution that these differences are not statistically significant and do not imply any causal effect of Twitter use or judgment about the relative accuracy of the groups’ forecasts. They do suggest, though, the need to take selection into account when consuming democracy news from Twitter – the tone among academic experts there may be more pessimistic than what experts as a whole would convey.
Democracy in other countries
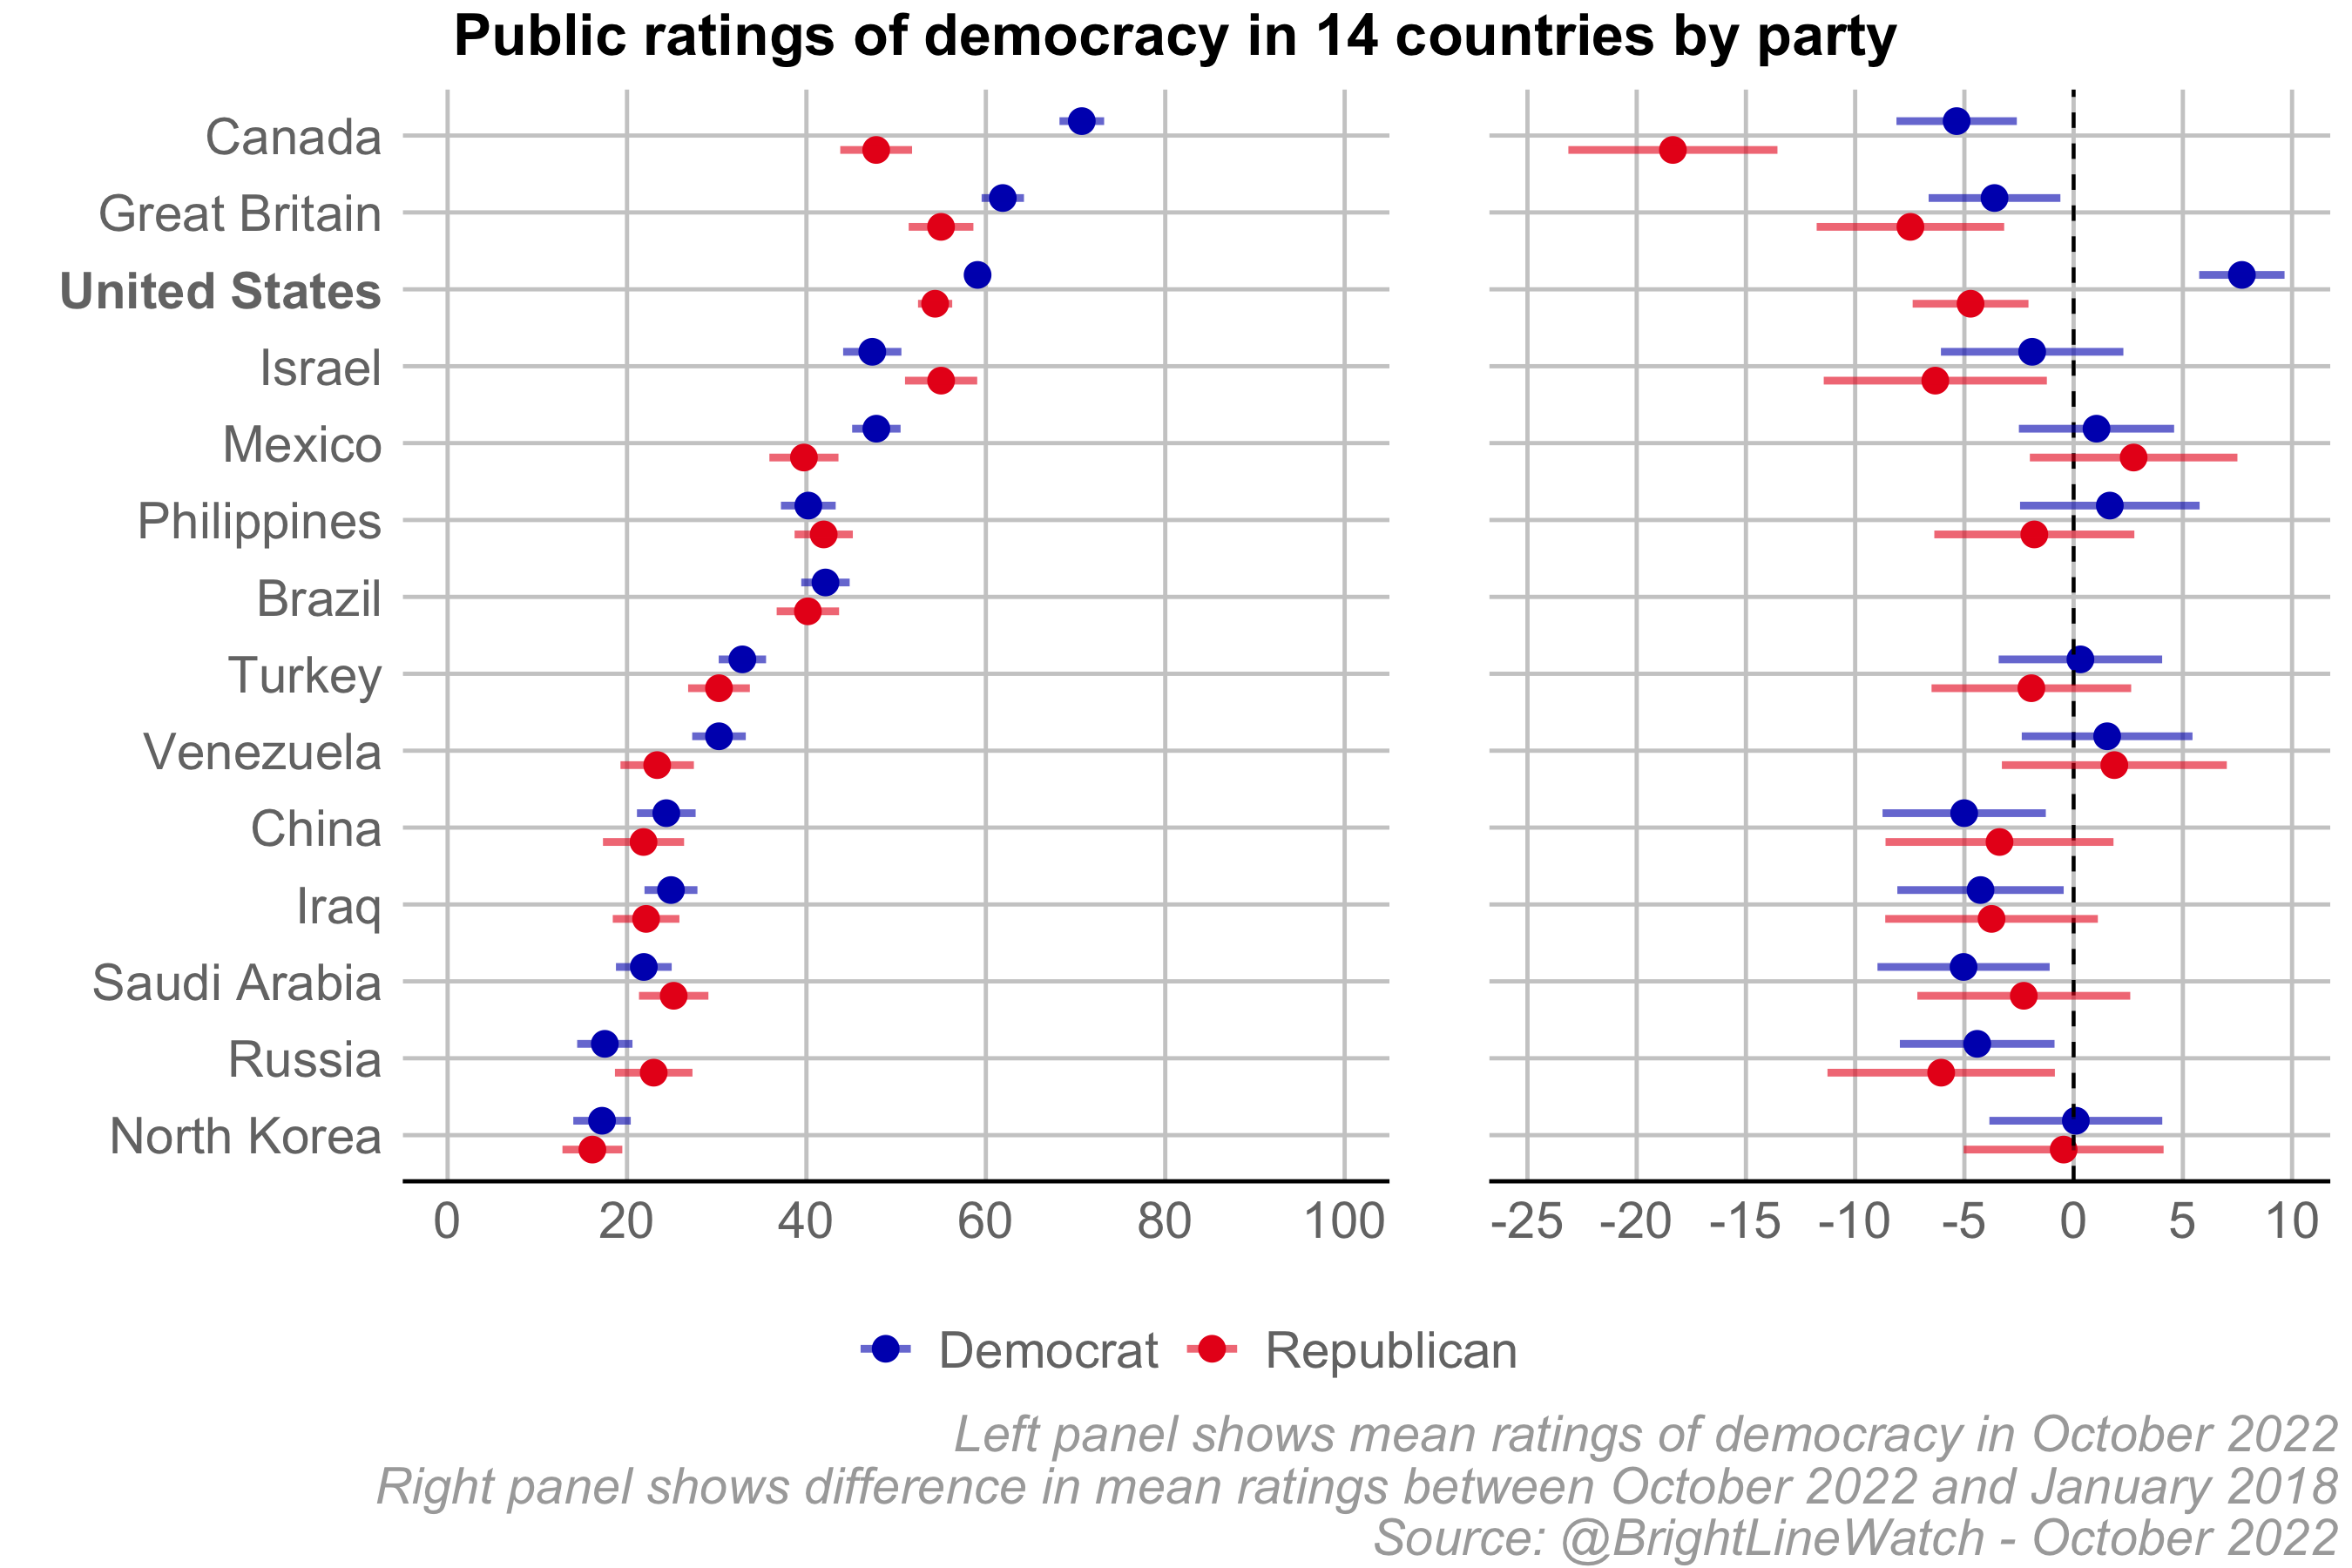
Our surveys also asked respondents to use the same 100-point scale to rate democracy in 13 additional countries (with each respondent rating a randomly selected set of 6). In a previous survey conducted in January 2018, we measured perceptions of the same set of countries (except Brazil). The next figure shows the mean ratings of the expert and public samples in October 2022 (left panel) and the changes relative to 2018 ratings for each group (right panel).
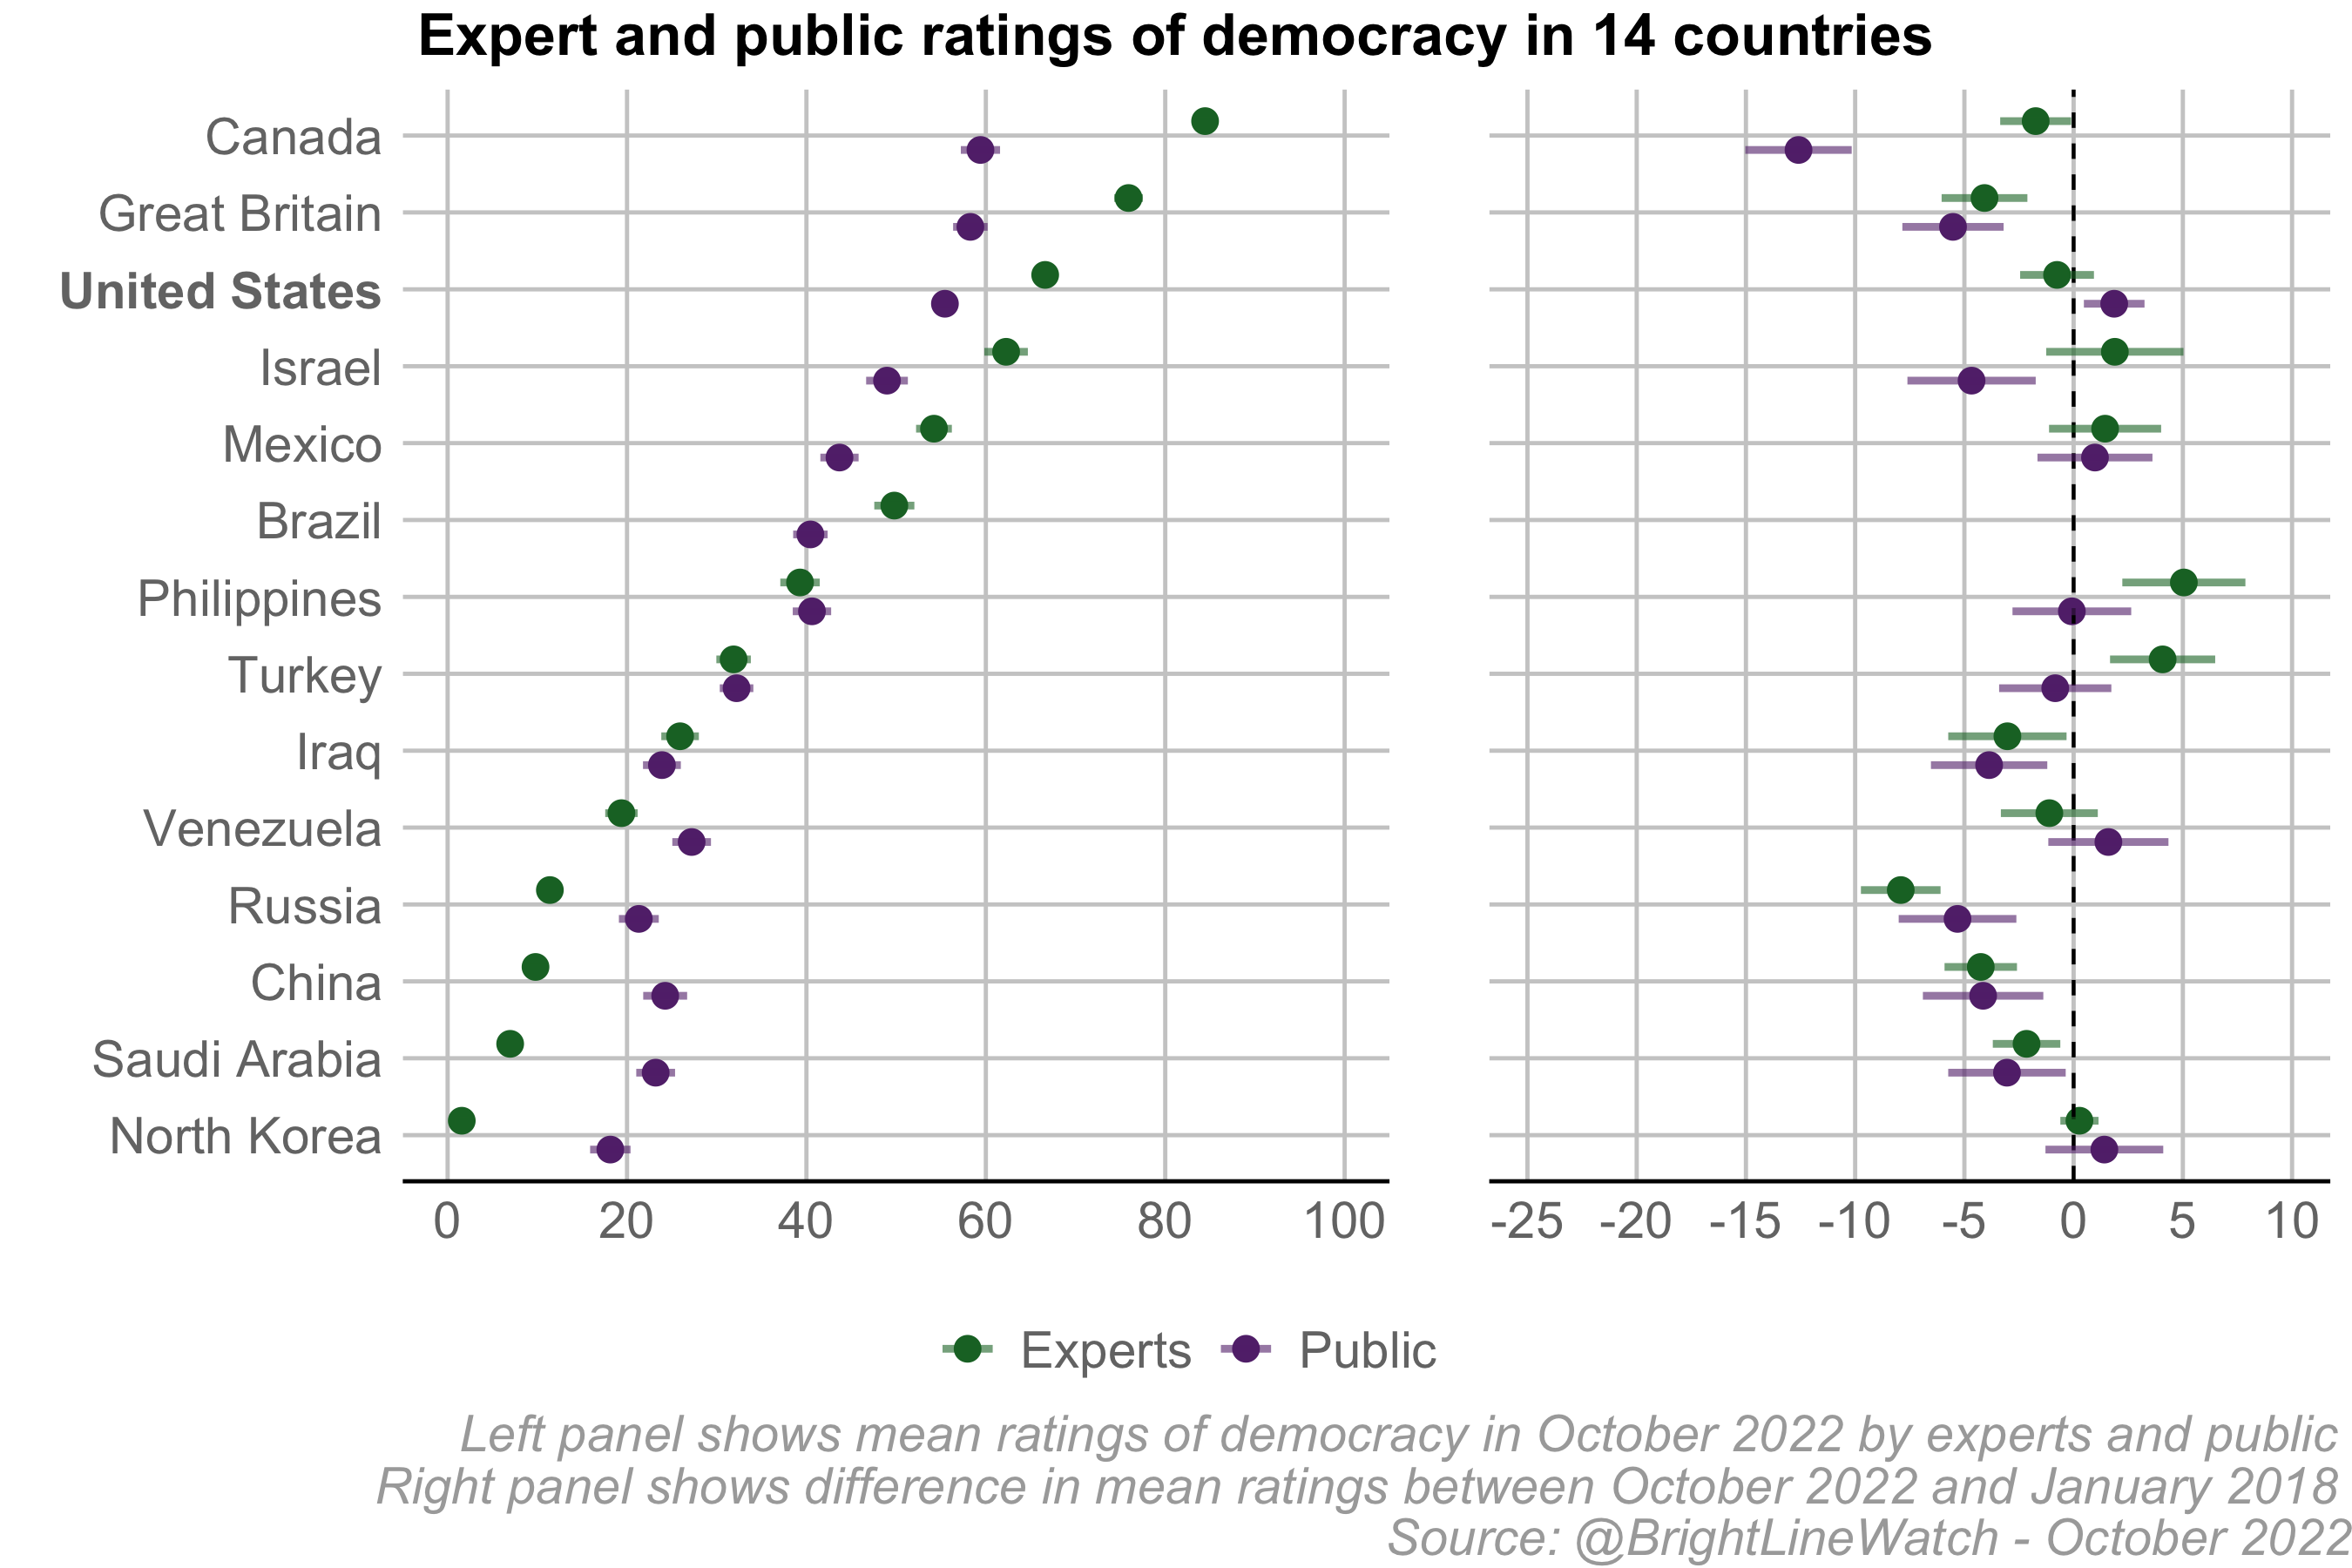
Canada and Great Britain are the only countries in our comparison set rated as more democratic than the United States, with both the expert and public samples concurring. Democracy in other countries is rated lower than the United States to varying degrees, with Israel and Mexico as the closest comparisons and North Korea, Saudi Arabia, and China at the bottom of the scale.
Country ratings have tended to decline overall since 2018.8 Canadian democracy remains admired by our expert sample but slid 13 points in the public’s estimation. Recent cabinet turmoil in Britain has dented Westminster’s reputation among both experts and the public. Our surveys were completed before Prime Minister Liz Truss resigned but her government’s instability and policy woes were prominent in the news while the surveys were in the field and former Prime Minister Boris Johnson’s scandal-tinged departure was recent in memory. At the lower end of the scale, Russia, China, and Saudi Arabia, already rated as undemocratic, dropped further in the estimation of both experts and the public. North Korea, having already crash-landed, has nowhere further to fall.
Only two scores improved markedly from 2018 – the expert ratings for Philippines and for Turkey. In the former case, former President Rodrigo Duterte respecting the constitution’s one-term limit and not seeking reelection may have registered as a democratic reprieve (notwithstanding the dynastic implications of Duterte’s daughter’s election to the vice presidency and former dictator Ferdinand Marcos’s son, Bongbong, winning the presidency). Turkey’s higher rating in 2022 might reflect the proximity of our 2018 survey to the failed 2016 military coup attempt against President Erdogan.
The next figure breaks out ratings from Democrats and Republicans from our public sample (left panel) and also shows changes from the 2018 ratings (right panel). Partisanship does not seem to color how Americans see democracy abroad as much as it affects perceptions of democracy at home. The notable exception is Canada’s decline since 2018 among Republicans, which might reflect the sympathetic treatment in conservative U.S. media outlets of last winter’s vaccine mandate protests. Other than Canada (which Democrats rate at 71 versus 48 among Republicans), the biggest partisan spreads are observed for Israel (55 among Republicans, 47 among Democrats), Mexico (48 among Democrats, 40 among Republicans), and Venezuela (30 among Democrats, 23 among Republicans). Notwithstanding these exceptions, the average partisan difference in country democracy ratings is just 5.7 points and the difference in ratings between parties are not statistically discernible in 7 of 13 cases.
Note that we included Brazil among the countries our respondents rated in the October survey wave, when it was rated at 50 by the experts, 43 by Democrats, and 40 by Republicans just after the first round of Brazil’s national elections on October 3rd. In that first round, incumbent President Jair Bolsonaro and challenger Luis Ignacio da Silva advanced to a run-off that is scheduled for October 30th. Bolsonaro, who is widely regarded as similar in political style to Donald Trump, has repeatedly questioned the integrity of Brazilian public opinion surveys as well as the country’s voting machines and electoral administration. Bolsonaro has also refused to commit to accepting the election outcome if he is not declared the winner, and received Trump’s endorsement. We will survey our respondents again on Brazilian democracy in November 2022, after the presidential run-off, to see how assessments change depending on the outcome and the behavior of both candidates.
Expert assessments of likelihoods and threats
We asked our expert sample to rate the probability of several events occurring during or after the 2022 midterm elections that bear on the state of American democracy.
-
Republican candidates who lose elections for statewide office (for example, governor or U.S. senator) in two or more different states refuse to concede defeat.
-
The Republican Party wins a majority in the House of Representatives even though Democratic House candidates win more votes than Republican House candidates nationwide.
-
Disputes over the election results in the 2022 midterms escalate to political violence in which more than 10 people are killed nationwide.
We also asked the experts to assess the likelihood of some potential events further in the future:
-
In 2023, the Supreme Court endorses the Independent State Legislature theory, increasing the authority of state legislatures over congressional maps and the appointment of presidential electors and diminishing the influence of governors, independent election commissions, state constitutions, and state courts;
-
The next Supreme Court vacancy will not be filled unless the Senate and the presidency are held by the same party.
The figure below reports the median probability estimate (x) and the density of probability estimates across the available range of 0% to 100% for each scenario among our expert respondents. Items are listed in descending order of estimated median probability.
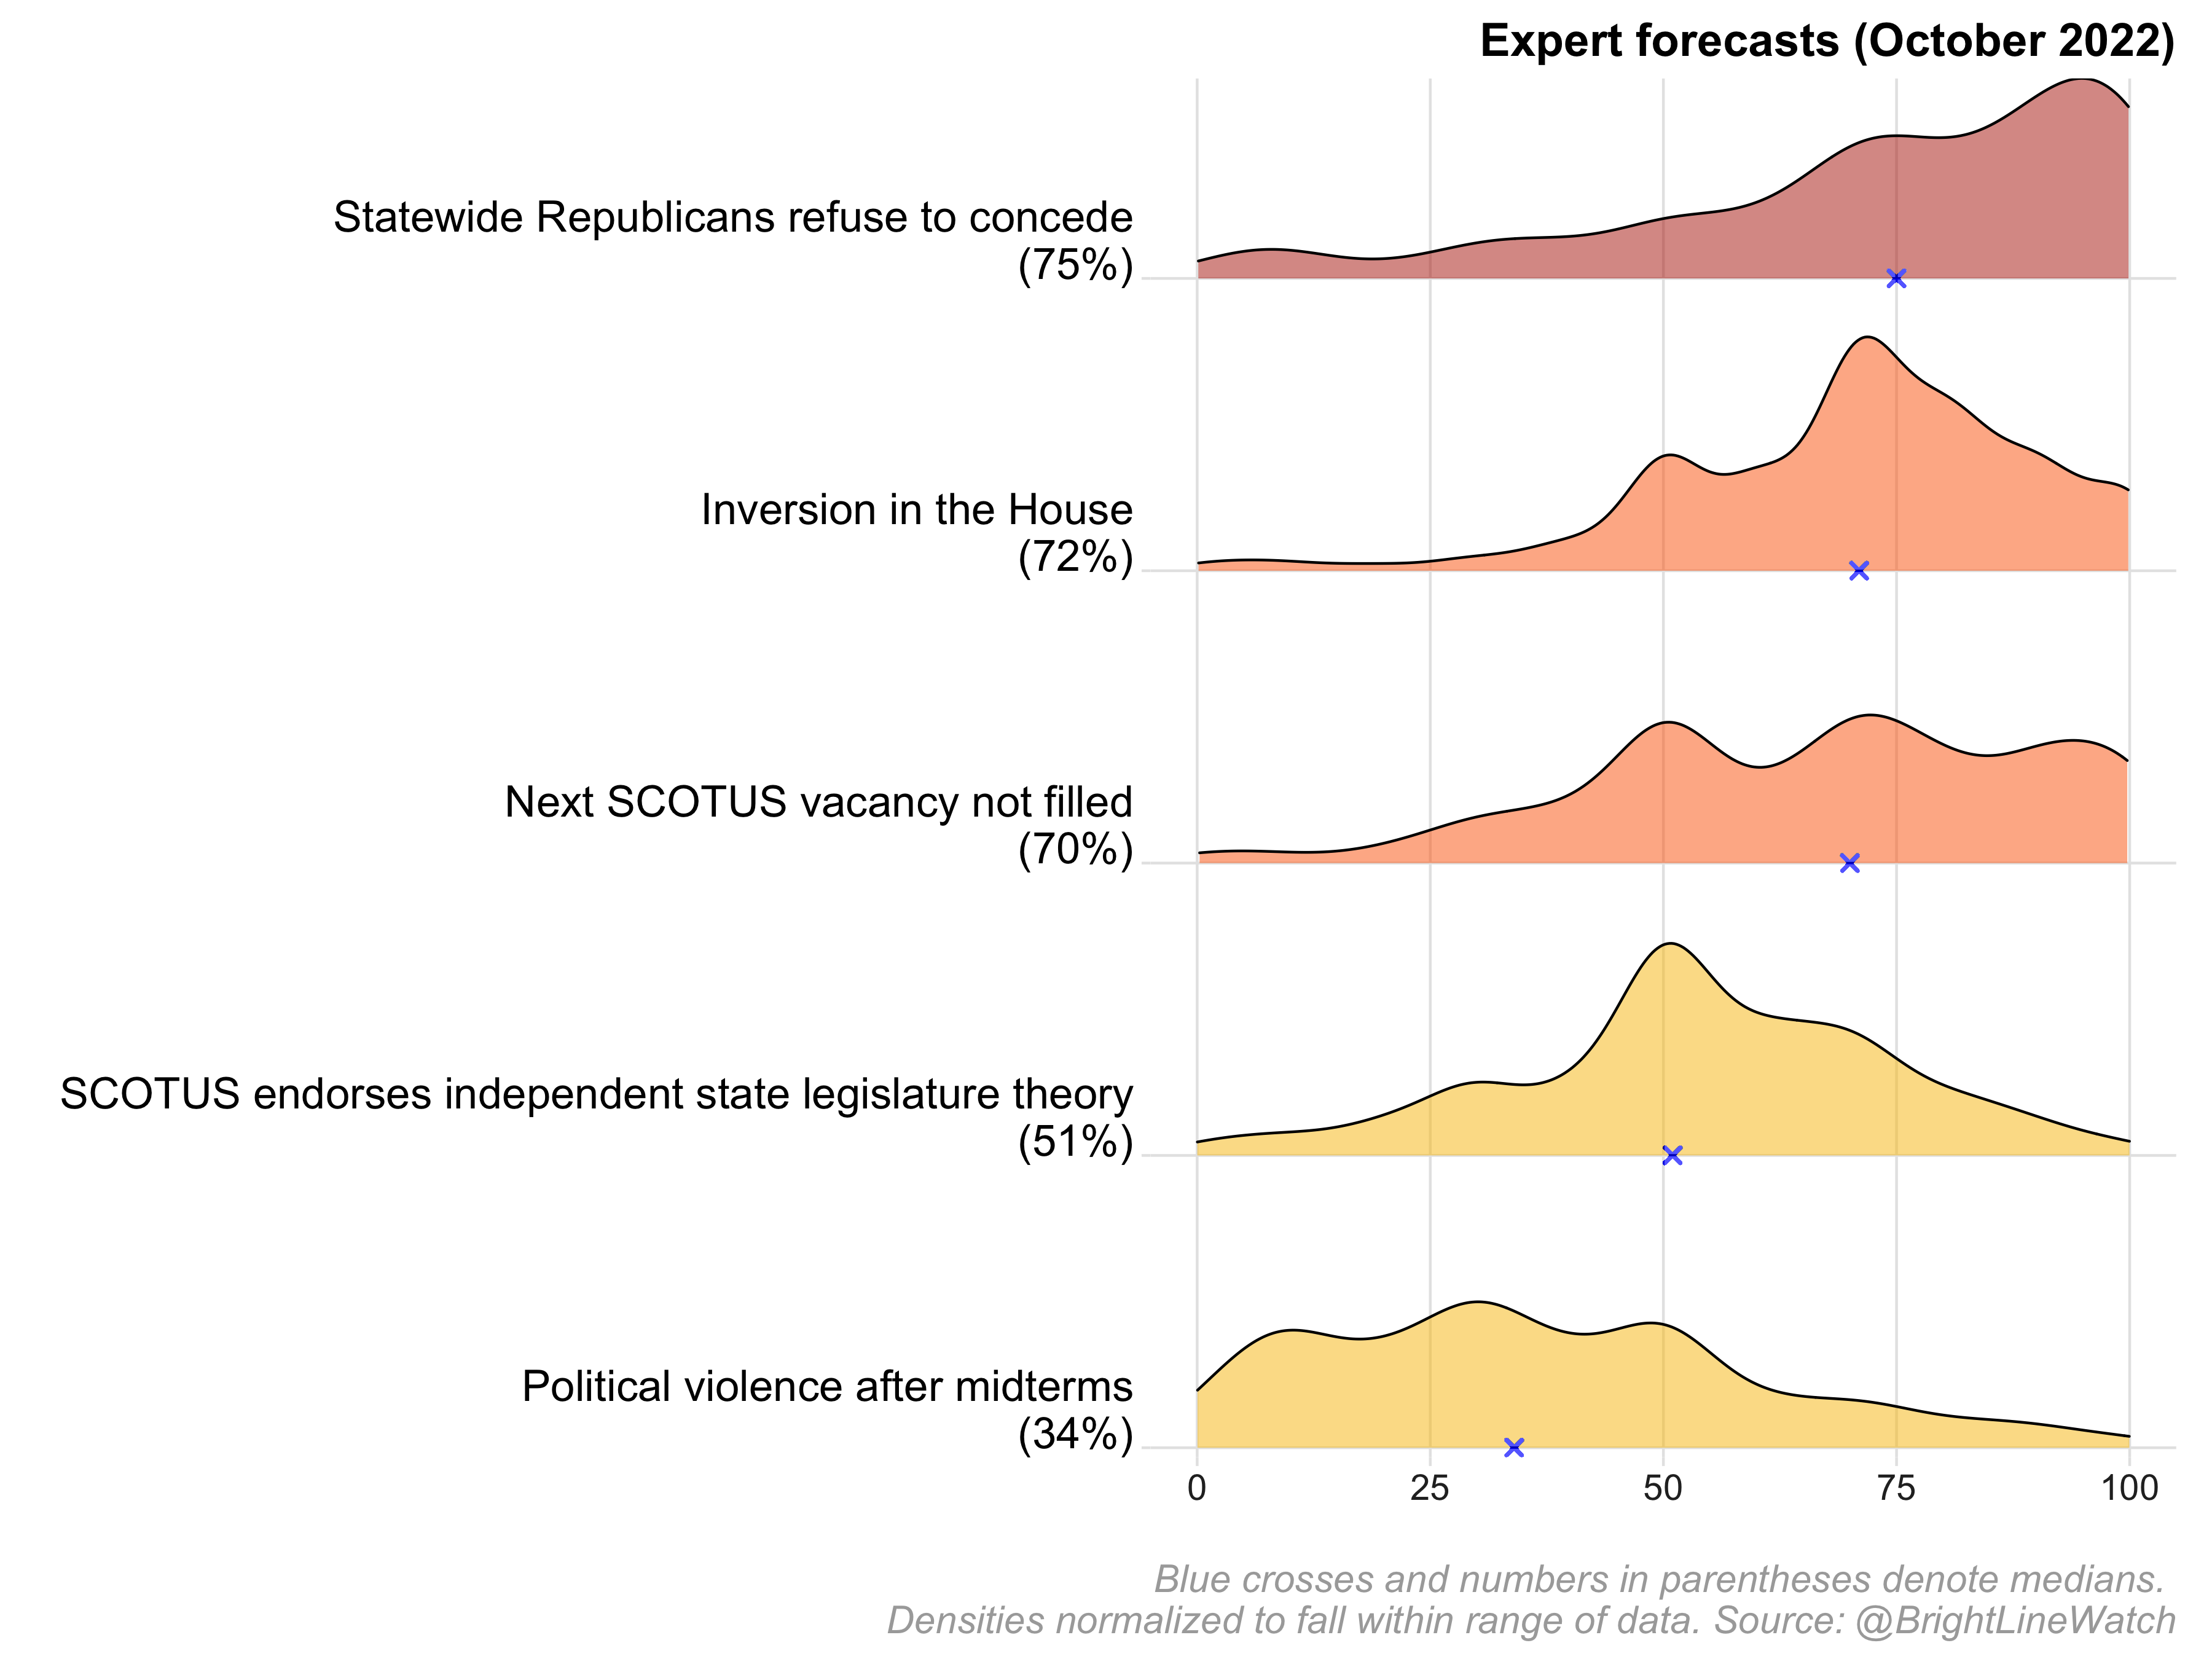
Of the five events we surveyed, experts assigned the highest and lowest probabilities to events that could take place after the November election. Consistent with the prevalence of 2020 election denialism among current GOP candidates, a large majority of experts expect that Republicans who lose elections for statewide office in two or more states will refuse to concede defeat this year. The median probability estimate for this outcome was 75%. However, most experts do not anticipate election disputes to trigger widespread violence, though the median estimated probability of post-election violence killing more than 10 people nationwide is a still-concerning 34%.
The experts place a high expectation (median 72%) on the Republican Party winning a House majority while capturing fewer votes nationwide than Democrats due to gerrymandering and the Republican advantage based on the geographical distribution of voters. Yet as the midterms approach, recent analyses have diverged on the anticipated degree of pro-Republican bias of House districts. The absence of Democratic candidates in many safe Republican districts also opens the prospect of an electoral inversion in the opposite direction in which Democrats hold the House despite a Republican popular vote victory.
We also asked the political science experts to weigh in on the likelihood of two scenarios involving the Supreme Court. The first scenario is that the Court will issue a decision in 2023 endorsing the Independent State Legislature (ISL) theory. In June 2022, the Court agreed to hear arguments in Moore v. Harper, a case in which the General Assembly (state legislature) of North Carolina challenges the authority of the state’s Supreme Court to block legislative maps drawn and approved by the legislature. ISL theory is based on readings of two passages in the U.S. Constitution referring to state legislative authority over elections. It represents a departure from existing precedent in reading such authority as unconstrained by state constitutions or state courts and other institutional actors, such as election boards. By agreeing to hear the North Carolina case in December 2022, the U.S. Supreme Court indicated a willingness to consider the ISL-based claims of the North Carolina legislature. The political science experts we surveyed are divided (median forecast 51%) over whether this case foreshadows an endorsement of ISL theory, which would increase the authority of state legislatures nationwide in regulating elections and resolving electoral disputes. Many critics of ISL fear that such a decision would allow GOP state legislatures to more aggressively gerrymander and restrict access to the vote in a manner that harms democracy.
The other Supreme Court-related item that we surveyed experts about asked whether the Court’s next vacancy will not be filled unless the Senate and the presidency are controlled by the same party. This scenario assumes that the standoff that took place between then-President Obama and the Republican-controlled Senate (which held open the seat vacated by Antonin Scalia until after the 2016 election) would be replicated in the future. Experts expect a similar pattern of behavior during the next situation of this type – the median forecast is 72% that a justice would not be confirmed unless the same party holds the Senate and the White House.
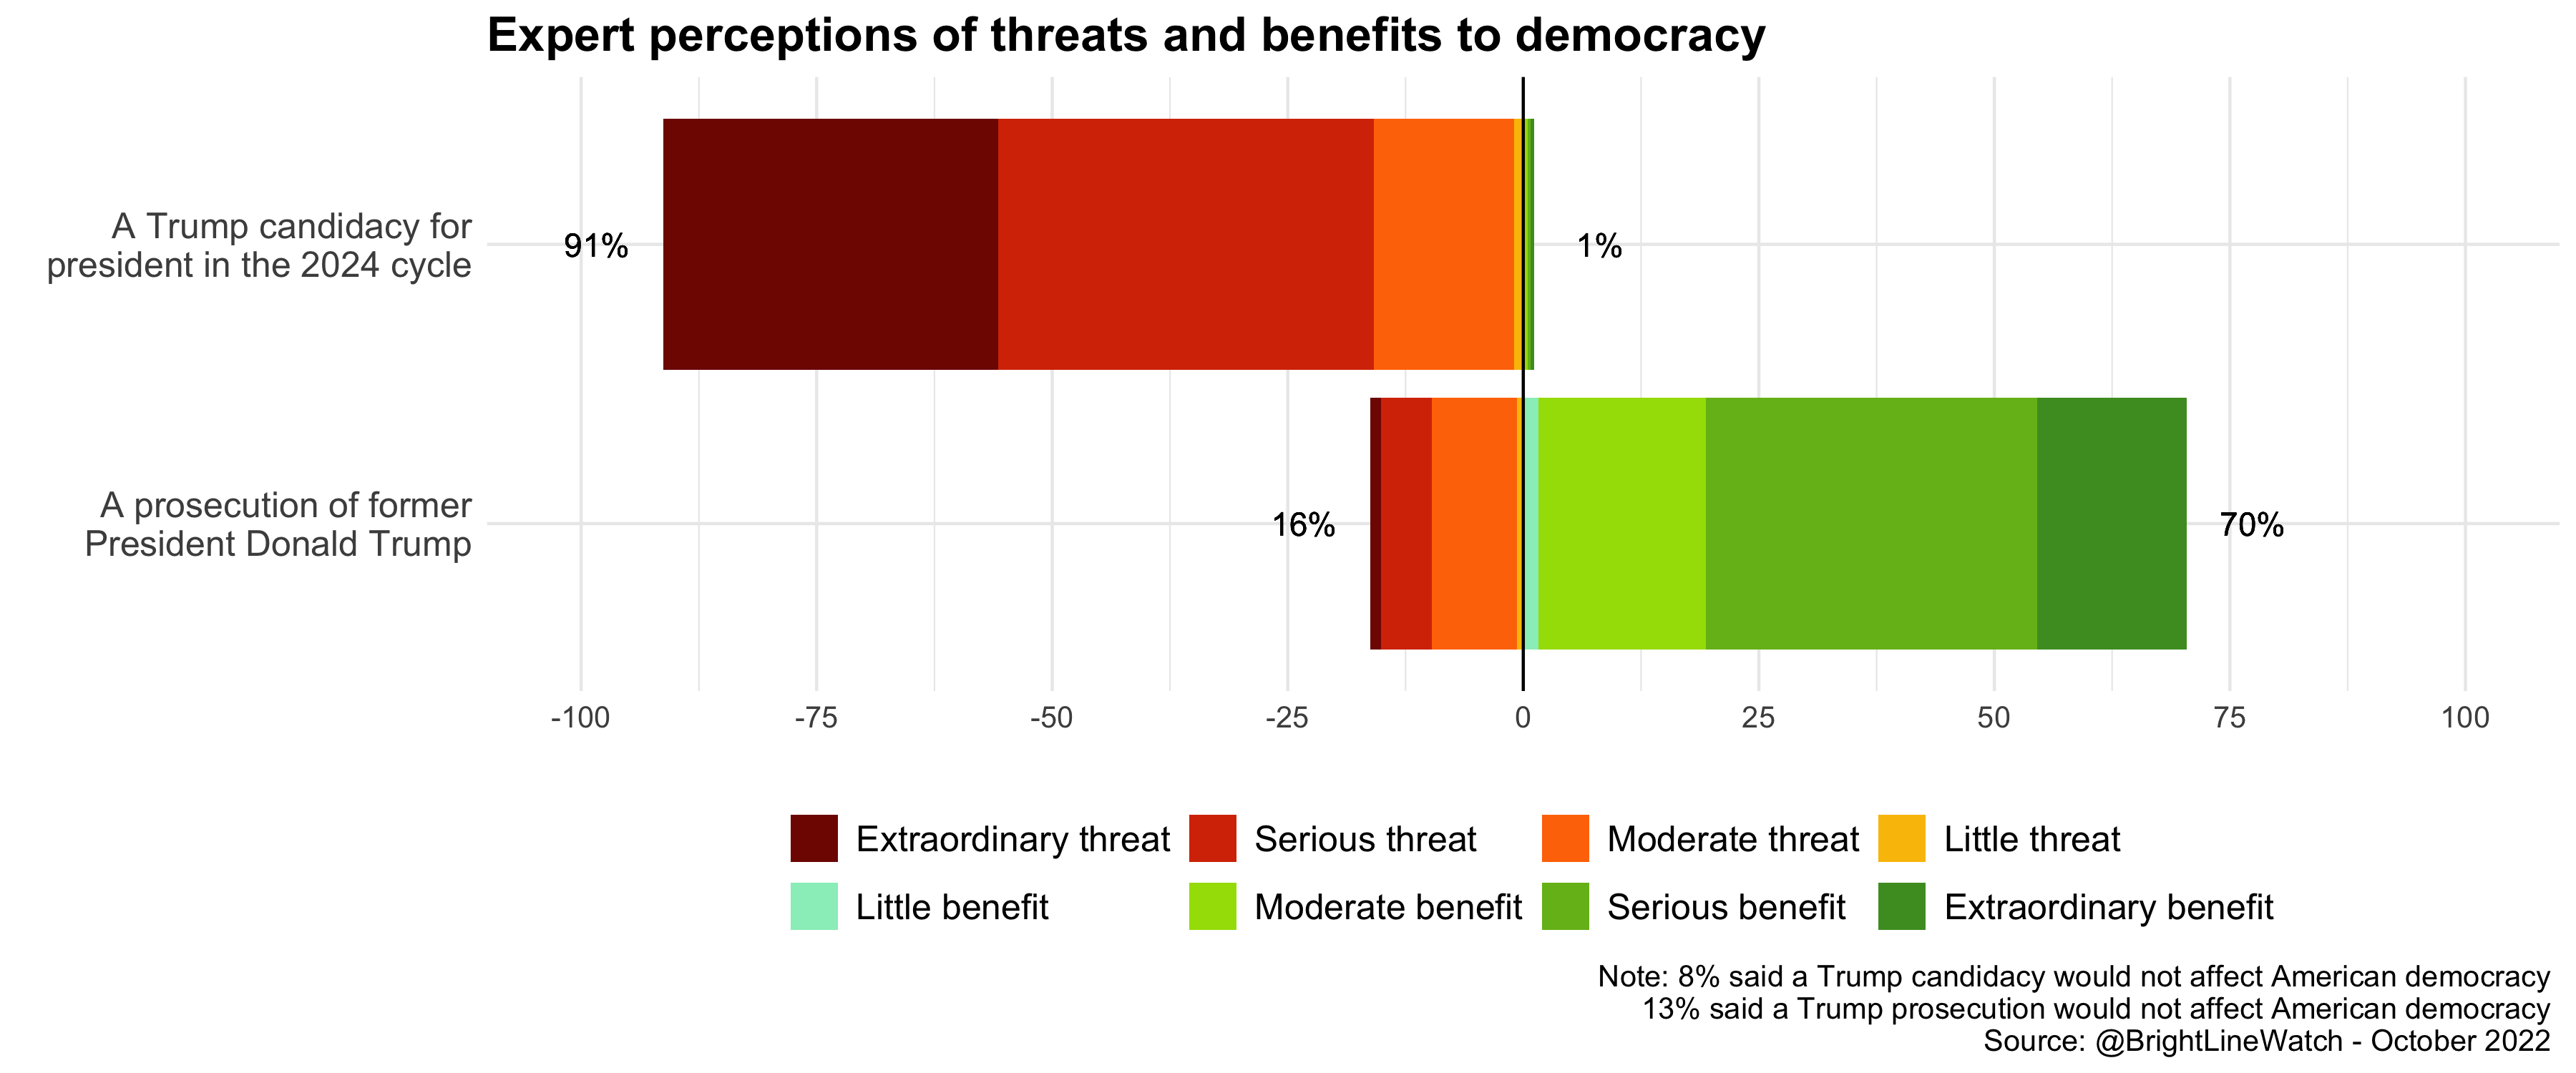
We also asked the experts to assess the effect of the following scenarios on US democracy:
-
A Trump candidacy for president in the 2024 cycle
-
A prosecution of former President Donald Trump
Experts could indicate whether they expected each reform to benefit democracy, have no impact on democracy, or threaten democracy. The figure below summarizes the results, which are stark. 91% of the political science experts regard a Trump candidacy in 2024 as a threat to democracy, with 35% rating the level as extraordinary and 39% as serious. By contrast, 70% of political science experts view a prosecution of Trump as beneficial to U.S. democracy, with 16% rating the benefit as extraordinary and 35% as serious.
Events
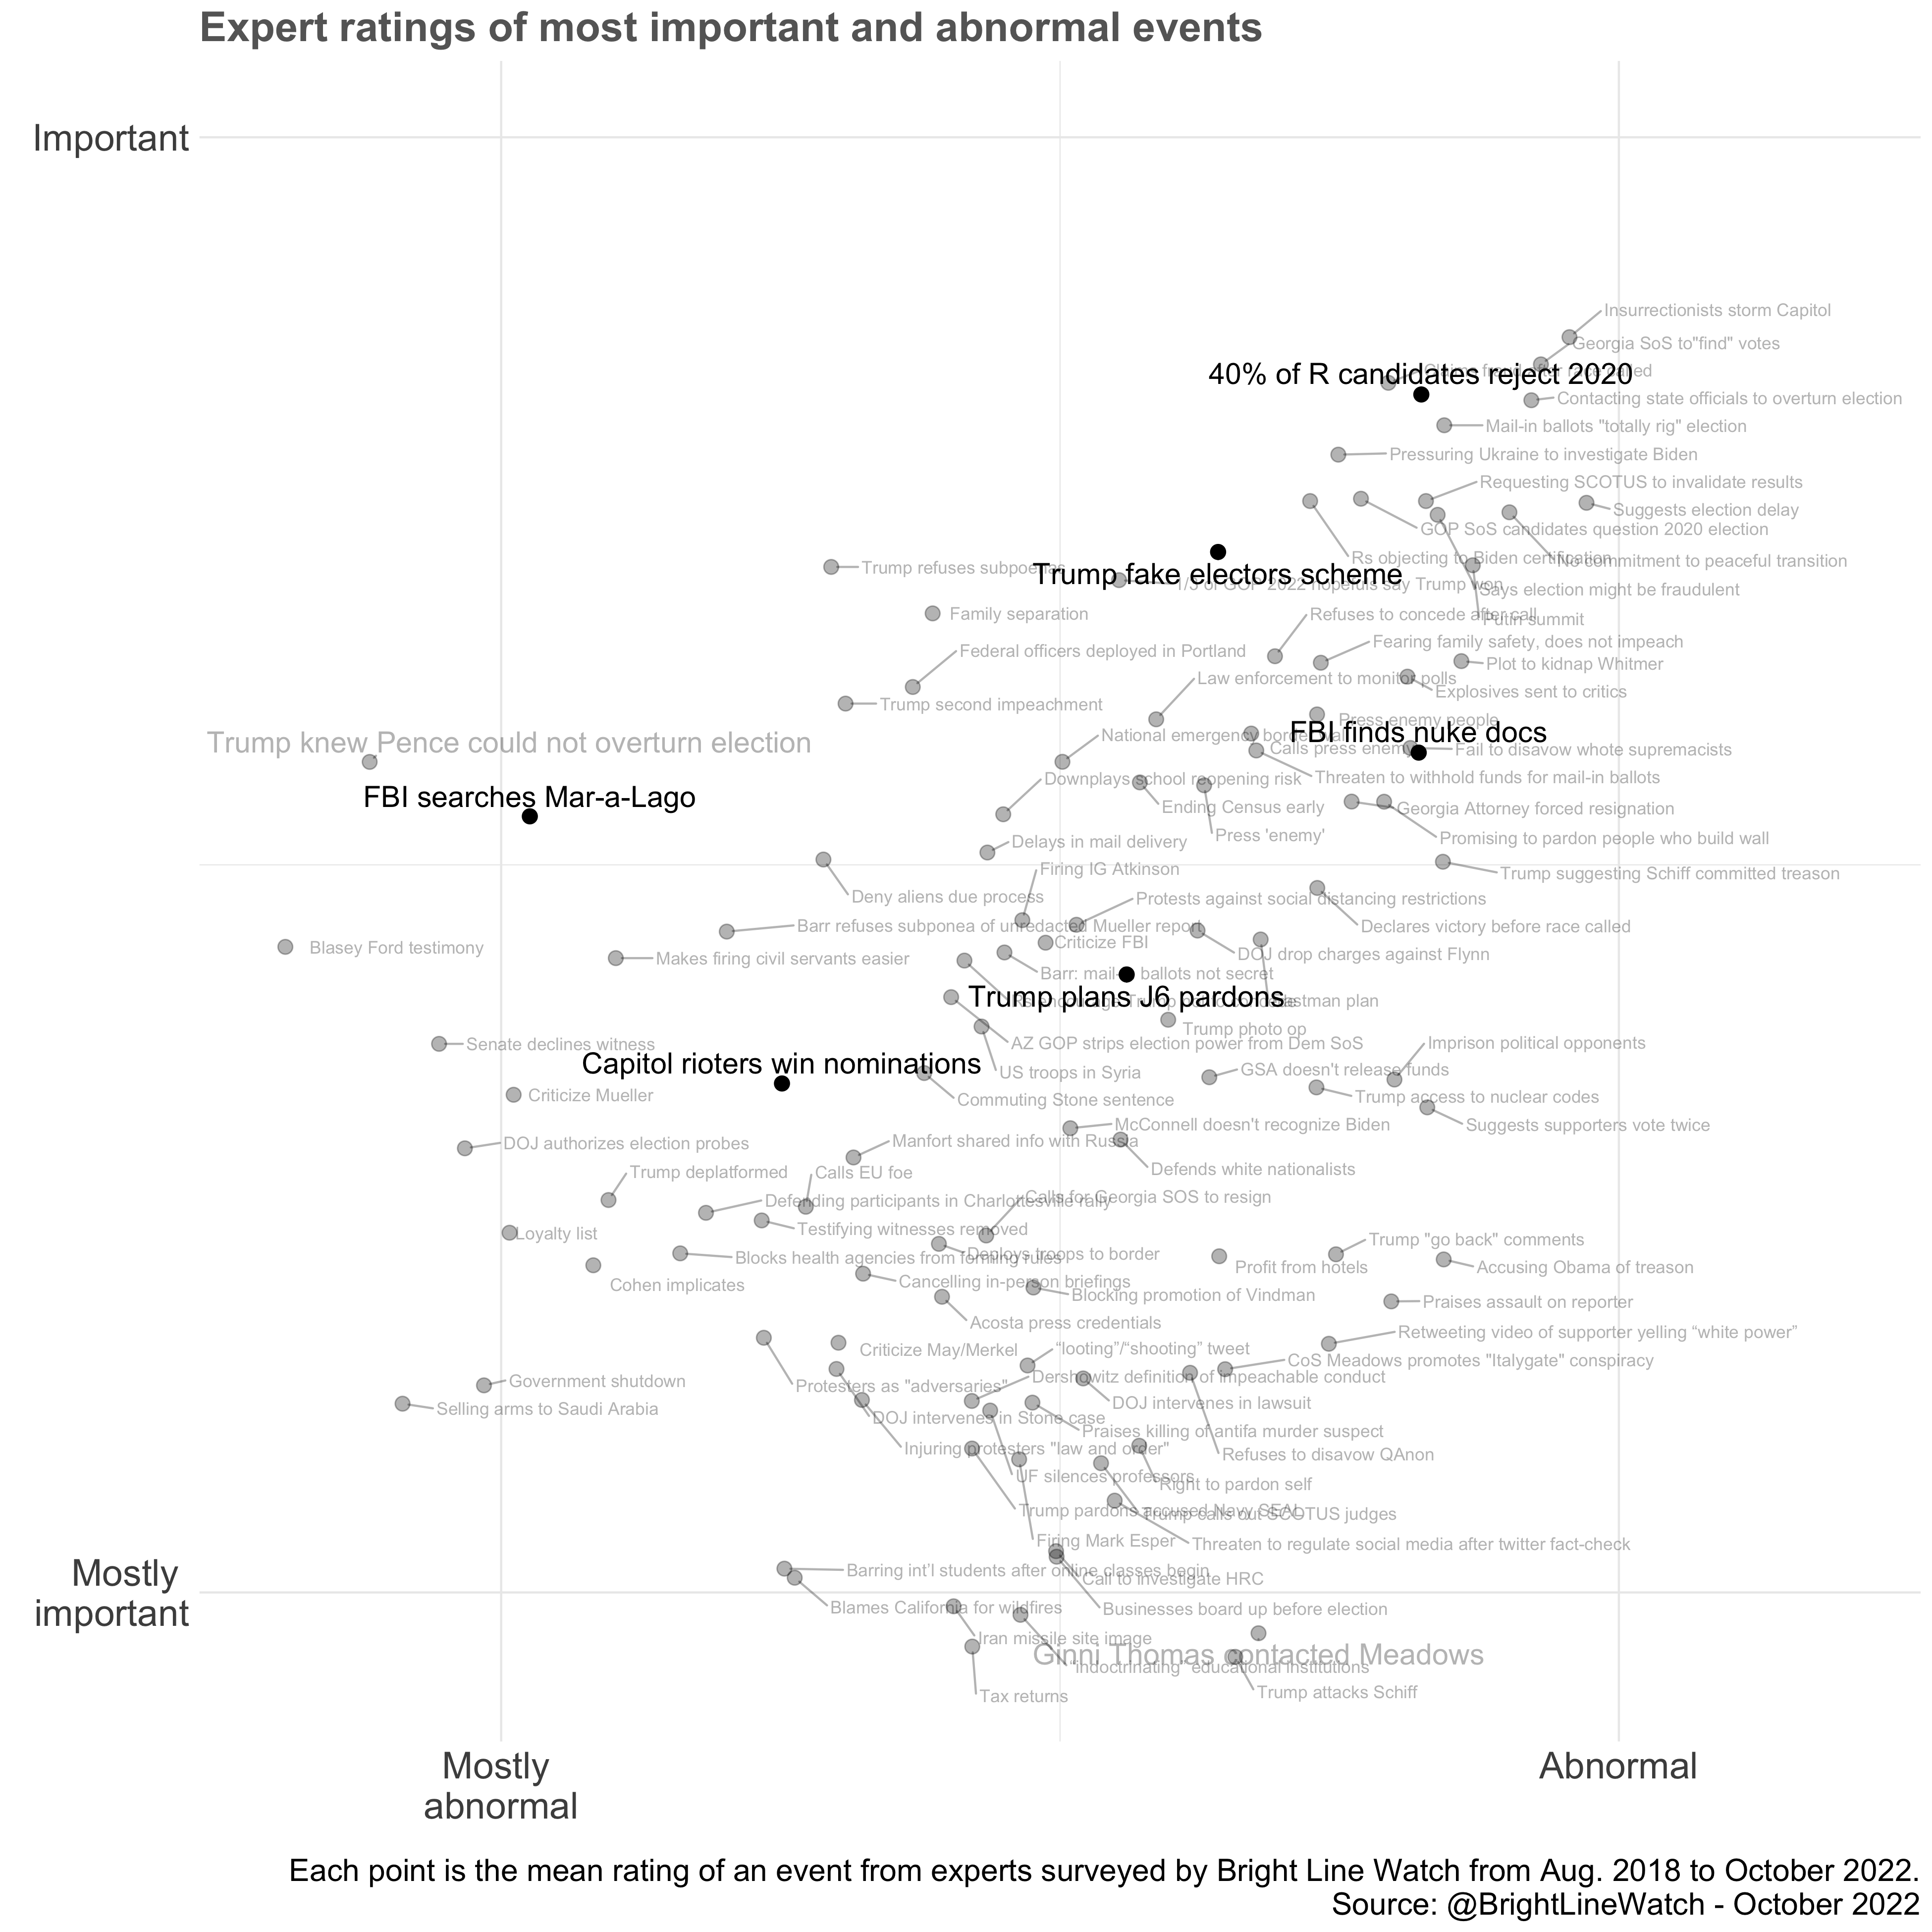
We continue to survey experts about the normality and importance of events that have taken place in the past year. The complete list of events (with the exact text shown to respondents) is provided in the appendix to this report; the ratings provided by our experts are plotted on the figure below. It distinguishes between events that experts rate as relatively normal and important (e.g., Congress passing the Inflation Reduction Act), normal and unimportant (Joe Biden testing positive for COVID), relatively abnormal but unimportant (the FBI investigation of the theft of Ashley Biden’s diary), and both abnormal and important (e.g., the state of Florida flying migrants to Martha’s Vineyard). We are particularly concerned about events in the shaded upper-right quadrant, which experts rated as mostly important to important and mostly abnormal to abnormal on average.
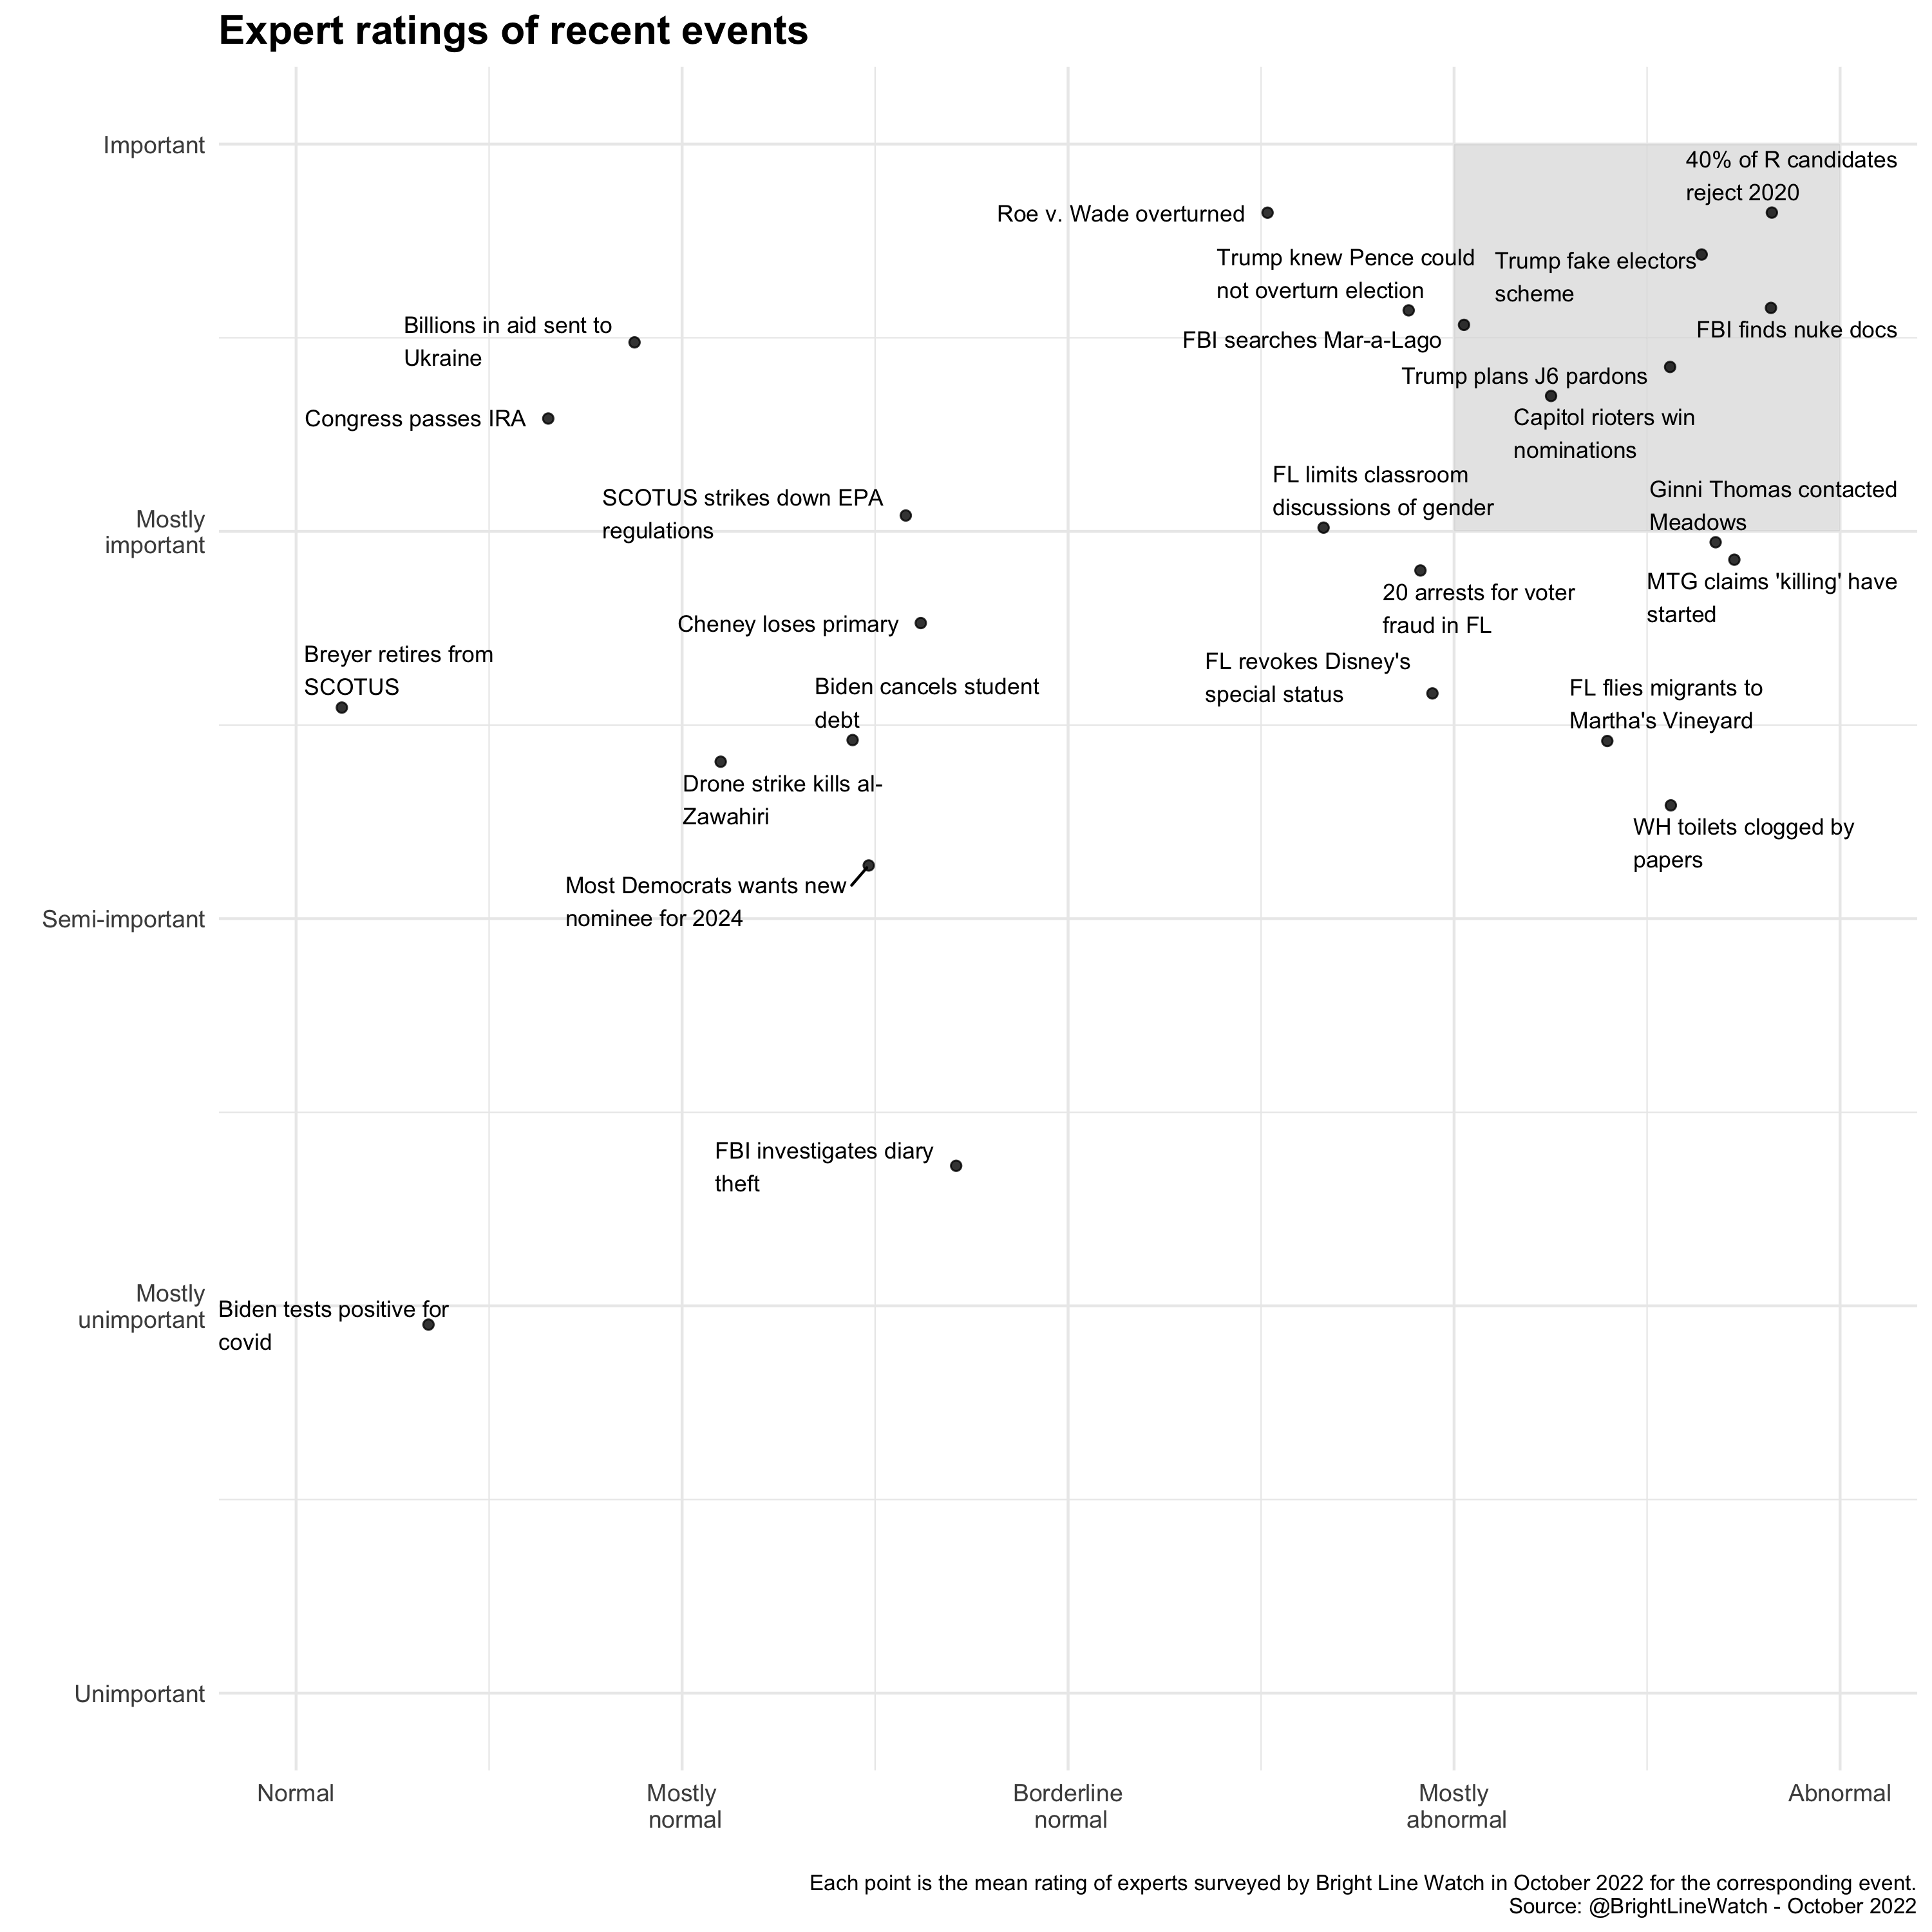
We therefore zoom in on the upper-right quadrant of especially abnormal and important events in the figure below, which juxtaposes expert ratings of events from our most recent survey with those from past surveys. As the figure indicates, six events that took place since our last survey in late 2021 were rated as both highly abnormal and highly important. Two concern the investigation of former President Trump’s handling of classified documents: the FBI search of Trump’s Mar-a-Lago resort and the discovery of documents there pertaining to the nuclear capabilities of a foreign country. The other four relate to the effort by President Trump to overturn the 2020 election and its aftermath, including Republicans who were at the Capitol riot on January 6 winning party nominations in 2022 House contests, Trump promising to pardon January 6 rioters if he wins the presidency in 2024, and testimony to the January 6 committee that Trump was personally involved in the plan to put forward slates of fake electors in battleground states following the 2020 election. However, experts rated the prevalence of 2020 election denialism among Republican candidates for statewide office as the most abnormal and important event of the past year and one of the most extreme to take place since 2016. Experts rated this development as both more abnormal and more important, for instance, than Trump pressuring Ukraine to investigate Joe Biden while he was in office – an action for which he was impeached by the House of Representatives.
Appendix
Bright Line Watch conducted its seventeenth survey of academic experts from October 5‑YY, 2022 and its fourteenth survey of the general public durfroming October 5–14, 2022. Our public sample consisted of 2,778 participants from the YouGov panel who were selected and weighted to be representative of the U.S. adult population. We also surveyed 682 political science experts across a diverse range of subfields (5.8% of solicited invitations). Our email list was constructed from the faculty list of U.S. institutions represented in the online program of the 2016 American Political Science Association conference and updated by reviewing department websites and job placement records from Ph.D. programs in the period since.
All estimates shown in the report used weights provided by YouGov. Our expert sample is unweighted because we do not collect demographic data to protect anonymity. Error bars in our graphs represent 95% confidence intervals. Data are available here.
Both the expert and public samples in Wave 17 responded to a battery of questions about democratic performance in the United States. Afterward, they were asked to evaluate the quality of American democracy overall on a 100-point scale.
How well do the following statements describe the United States as of today?
-
The U.S. does not meet this standard
-
The U.S. partly meets this standard
-
The U.S. mostly meets this standard
-
The U.S fully meets this standard
- Government officials are legally sanctioned for misconduct
- Government officials do not use public office for private gain
- Government agencies are not used to monitor, attack, or punish political opponents
- All adult citizens enjoy the same legal and political rights
- Government does not interfere with journalists or news organizations
- Government effectively prevents private actors from engaging in politically-motivated violence or intimidation
- Government protects individuals’ right to engage in unpopular speech or expression
- Political competition occurs without criticism of opponents’ loyalty or patriotism
- Elections are free from foreign influence
- Parties and candidates are not barred due to their political beliefs and ideologies
- All adult citizens have equal opportunity to vote
- All votes have equal impact on election outcomes
- Elections are conducted, ballots counted, and winners determined without pervasive fraud or manipulation
- Executive authority cannot be expanded beyond constitutional limits
- The legislature is able to effectively limit executive power
- The judiciary is able to effectively limit executive power
- The elected branches respect judicial independence
- Voter participation in elections is generally high
- Information about the sources of campaign funding is available to the public
- Public policy is not determined by large campaign contributions
- Citizens can make their opinions heard in open debate about policies that are under consideration
- The geographic boundaries of electoral districts do not systematically advantage any particular political party
- Even when there are disagreements about ideology or policy, political leaders generally share a common understanding of relevant facts
- Elected officials seek compromise with political opponents
- Citizens have access to information about candidates that is relevant to how they would govern
- Government protects individuals’ right to engage in peaceful protest
- Law enforcement investigations of public officials or their associates are free from political influence or interference
- Government statistics and data are produced by experts who are not influenced by political considerations
- The law is enforced equally for all persons
- Incumbent politicians who lose elections publicly concede defeat
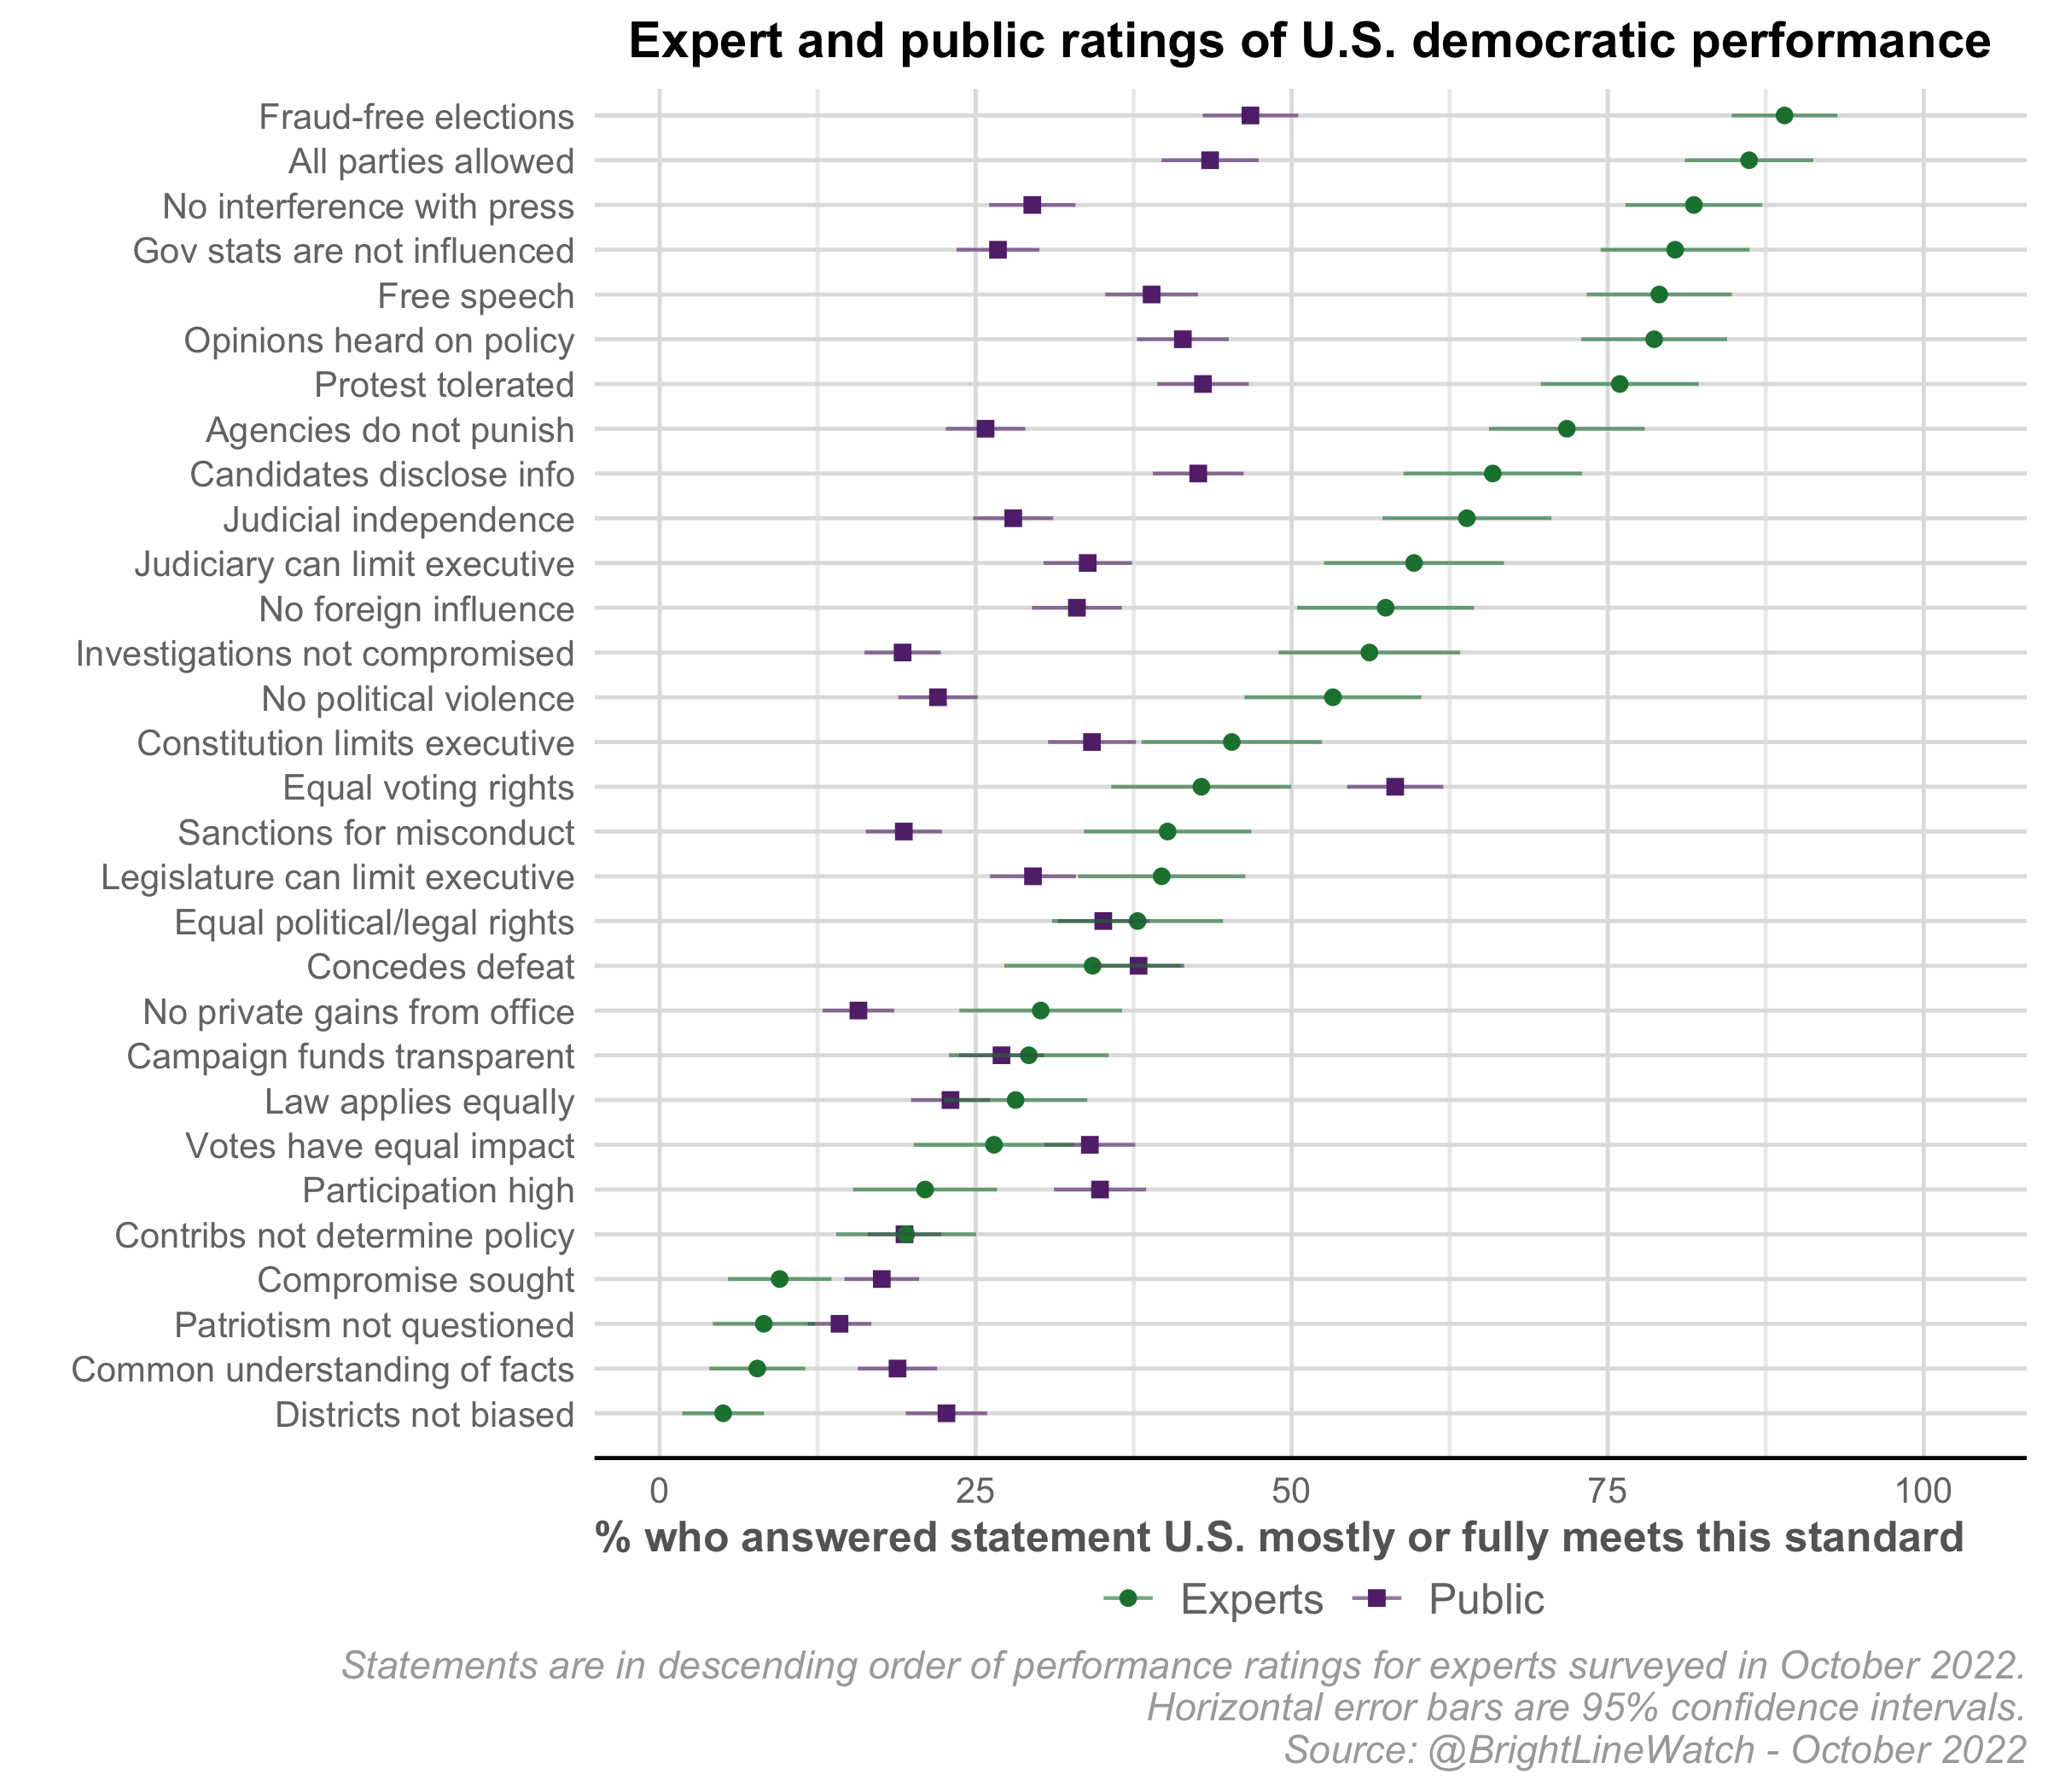
The figure below breaks out performance ratings on each of 30 democratic principles. The markers for each principle indicate the percentage of expert (green) and public (purple) respondents who regard the United States as fully or mostly meeting the standard (as opposed to meeting it partly or not at all). Consistent with the overall ratings, the experts rate U.S. democratic performance more positively than the public overall. Few exceptions exist, however, such as voting rights being equally protected for all citizens, politicians operating with a common understanding on factual matters, and electoral districts not systematically favoring one party over the other.
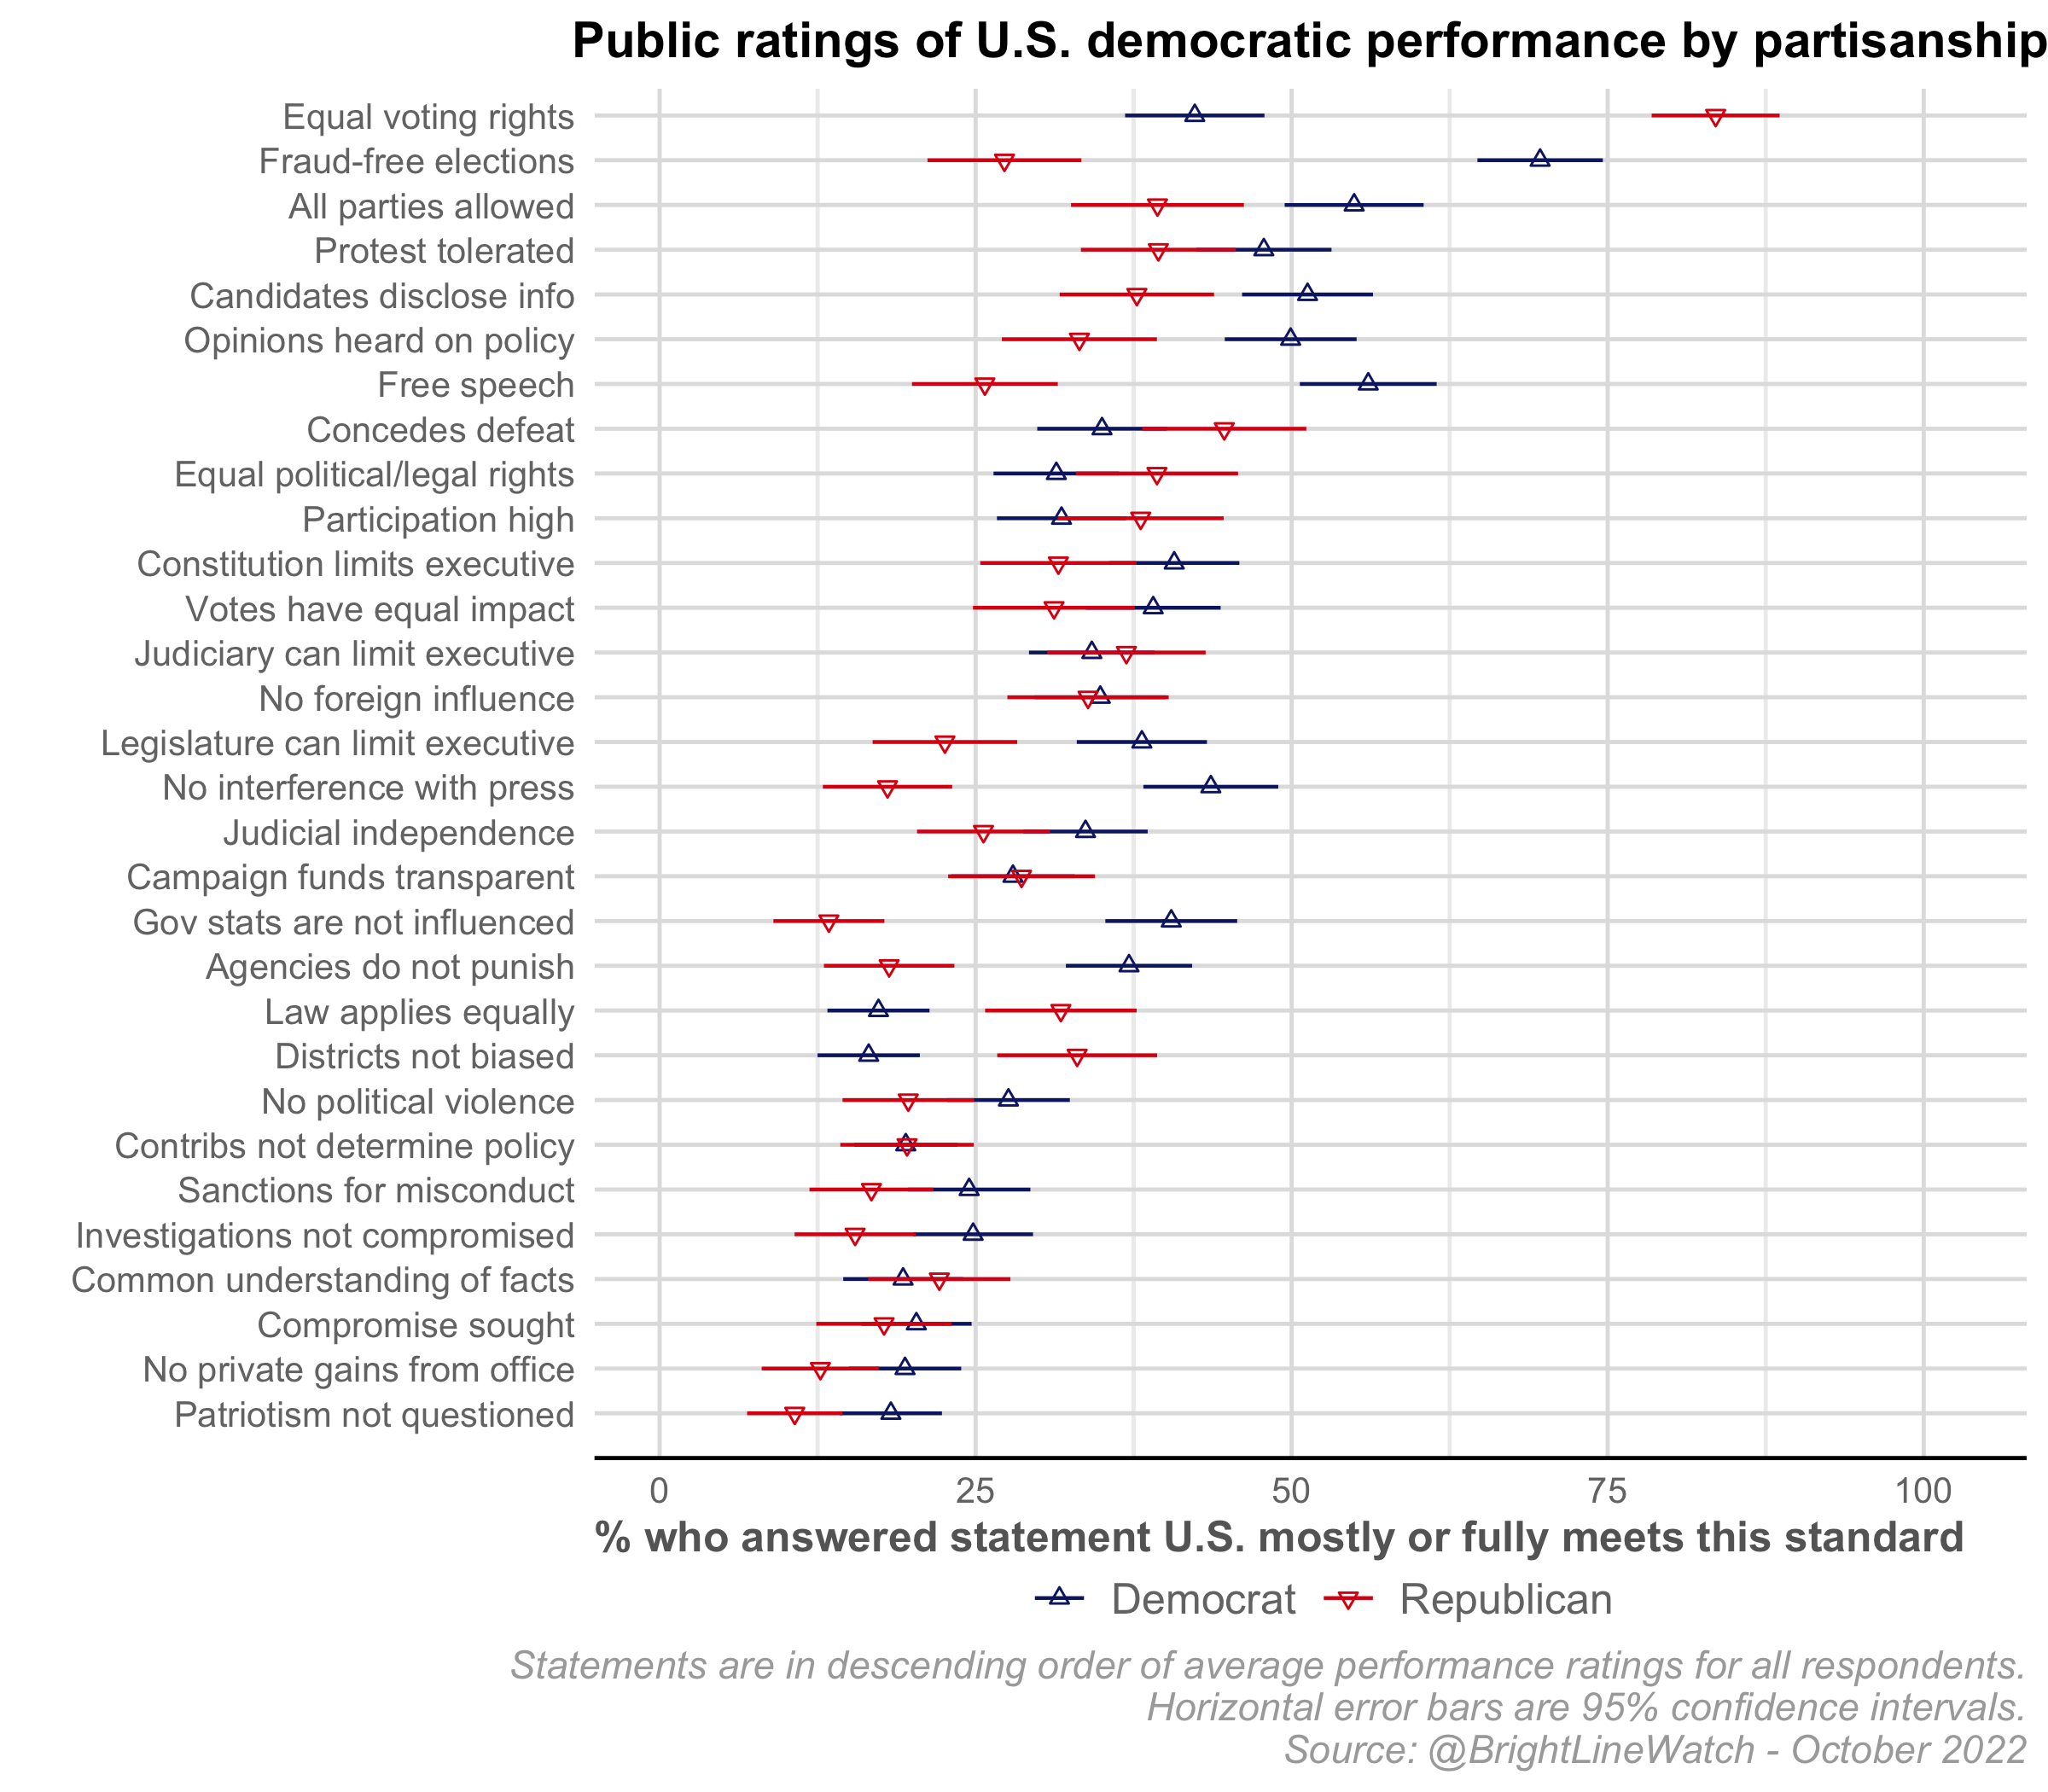
The next figure shows performance assessments on the same 30 principles for the public sample only by respondent partisanship. On some principles, middling overall public assessments hide stark partisan polarization.
Additional components of expert survey
Political events
In this series of questions, we ask how normal or abnormal and how important or unimportant recent political events are.
Is this normal or abnormal?
- Normal
- Mostly normal
- Borderline normal
- Mostly abnormal
- Abnormal
Is this unimportant or important?
- Unimportant
- Mostly unimportant
- Semi-important
- Mostly important
- Important
- 3 Republicans who were at the Capitol riot on January 6 win party nominations in 2022 House contests
- Trump says he would pardon January 6 rioters if he wins the presidency in 2024
- After the 2020 election, Ginni Thomas, the wife of Supreme Court Justice Clarence Thomas, pressed White House chief of staff to overturn results
- The FBI searches Trump’s residence at Mar-a-Lago
- Justice Stephen Breyer retires from the Supreme Court
- The Supreme Court strikes down Obama-era regulations that the EPA imposed on coal-fired power plants
- Drone strike carried out by U.S. forces kills al-Qaeda leader Ayman al-Zawahiri
- Biden administration announces plan to cancel $10,000 in student debt
- January 6 committee hears testimony that Trump was personally involved in plan to put forward slates of fake electors in battleground states following the 2020 election
- FBI finds documents related to foreign nations’ nuclear capabilities during search of Trump’s Mar-a-Lago residence
- Over 40% of Republican candidates for statewide office in the 2022 elections refuse to acknowledge the legitimacy of the 2020 election
- The U.S. sends billions in military aid to Ukraine after Russia invades
- January 6 committee presents evidence that Trump was told that using VP Pence to overturn the 2020 election was illegal
- 18 months into the Biden presidency, polls show that a majority of Democrats wants a new presidential nominee in 2024
- Congress passes the Inflation Reduction Act, which includes $370 billion in spending and tax credits in low-emission forms of energy
- FBI investigates the theft of the personal diary of Biden’s daughter
- Biden tests positive for COVID-19 and experiences mild symptoms
- News reports indicate that toilets in the Trump White House were clogged by papers
- Florida voter fraud task force arrests 20 people for voting illegally, many of whom had been told they were eligible to vote
- Speaking at a Trump rally, Representative Marjorie Taylor Greene claims that Democratic ‘killings’ of Republicans have started
- The Supreme Court overturns Roe v. Wade, allowing state-level restrictions on abortion
- Republican Representative Liz Cheney, a critic of Trump’s claims regarding the 2020 election, loses her primary to a Trump-backed challenger
- Following Disney’s criticism of a Florida bill regulating classrom discussions of gender and sexuality, the state legislature terminates the company’s special tax status
- Florida flies dozens of migrants to Martha’s Vineyard to protest illegal immigration under Biden
- Florida adopts regulations that limit classroom discussions of gender and sexuality
Additional Figures
Trump’s legal status — When “Don’t Know” is an option:
Notes
- True partisan independents (those who do not lean toward either Republicans or Democrats) make up 18% of our sample. They have not moved significantly over the past year; 59% recognize Biden as the rightful winner.
- The Washington Post and FiveThirtyEight.com also reached out with direct communication to candidates to survey their positions on the matter.
- CNN (governor, Senate) and NBC (attorney general, governor, Secretary of State) also produced lists of election deniers but their coverage across offices is not as comprehensive so we do not include it here. For the offices that these two outlets covered, estimates of election-denying Republicans tend to be higher than those reported by Bloomberg, FiveThirtyEight, and The Washington Post: CNN finds substantially more election-denying candidates for Governor (60%) and U.S. Senate (56%), while NBC’s reported figures are on the high end for Attorney General candidates (35%) and Secretary of State candidates (39%), but on the low end for Governor (41%). The New York Times covered the same set of offices as those analyzed in this report but did not provide individual-level candidate classification data with its tally and thus is excluded. Further complicating comparisons„ The New York Times categorized candidates into three distinct groups: “openly said the 2020 election was stolen”, “questioned the 2020 election in other ways”, and “found no evidence.” The aggregate data reported by The New York Times shows more election deniers than other sources: 53% of candidates for Attorney General, 65% of candidates for Governor, 58% of candidates for Secretary of State, 69% of candidates for U.S. House, and 78% of candidates for U.S. Senate are categorized as election deniers. We caution however, that the set of candidates analyzed by The New York Times differs from that analyzed by the three main sources analyzed in this report. All the sources except FiveThirtyEight.com coded candidates according to a denier/non-denier binary. FiveThirtyEight.com rated candidates as “fully denied,” “raised questions,” “fully accepted,” “accepted with reservations,” “no comment,” or “avoided answering.” We coded those who “fully denied” or “raised questions” as deniers. We are grateful to Maria Janel Consuelo Perez and Coalter Palmer for research assistance with these data.
- Bloomberg was slightly less likely to label candidates as deniers than the FiveThirtyEight.com or the Washington Post. Agreement rates on individual candidate codings between sources are as follows: Bloomberg-538: 78%; WaPo-538: 82%; WaPo-Bloomberg: 83%.
- We focused on Trump’s actions as president and former president. We did not ask about financial fraud charges against the Trump Organization separately filed by New York’s attorney general.
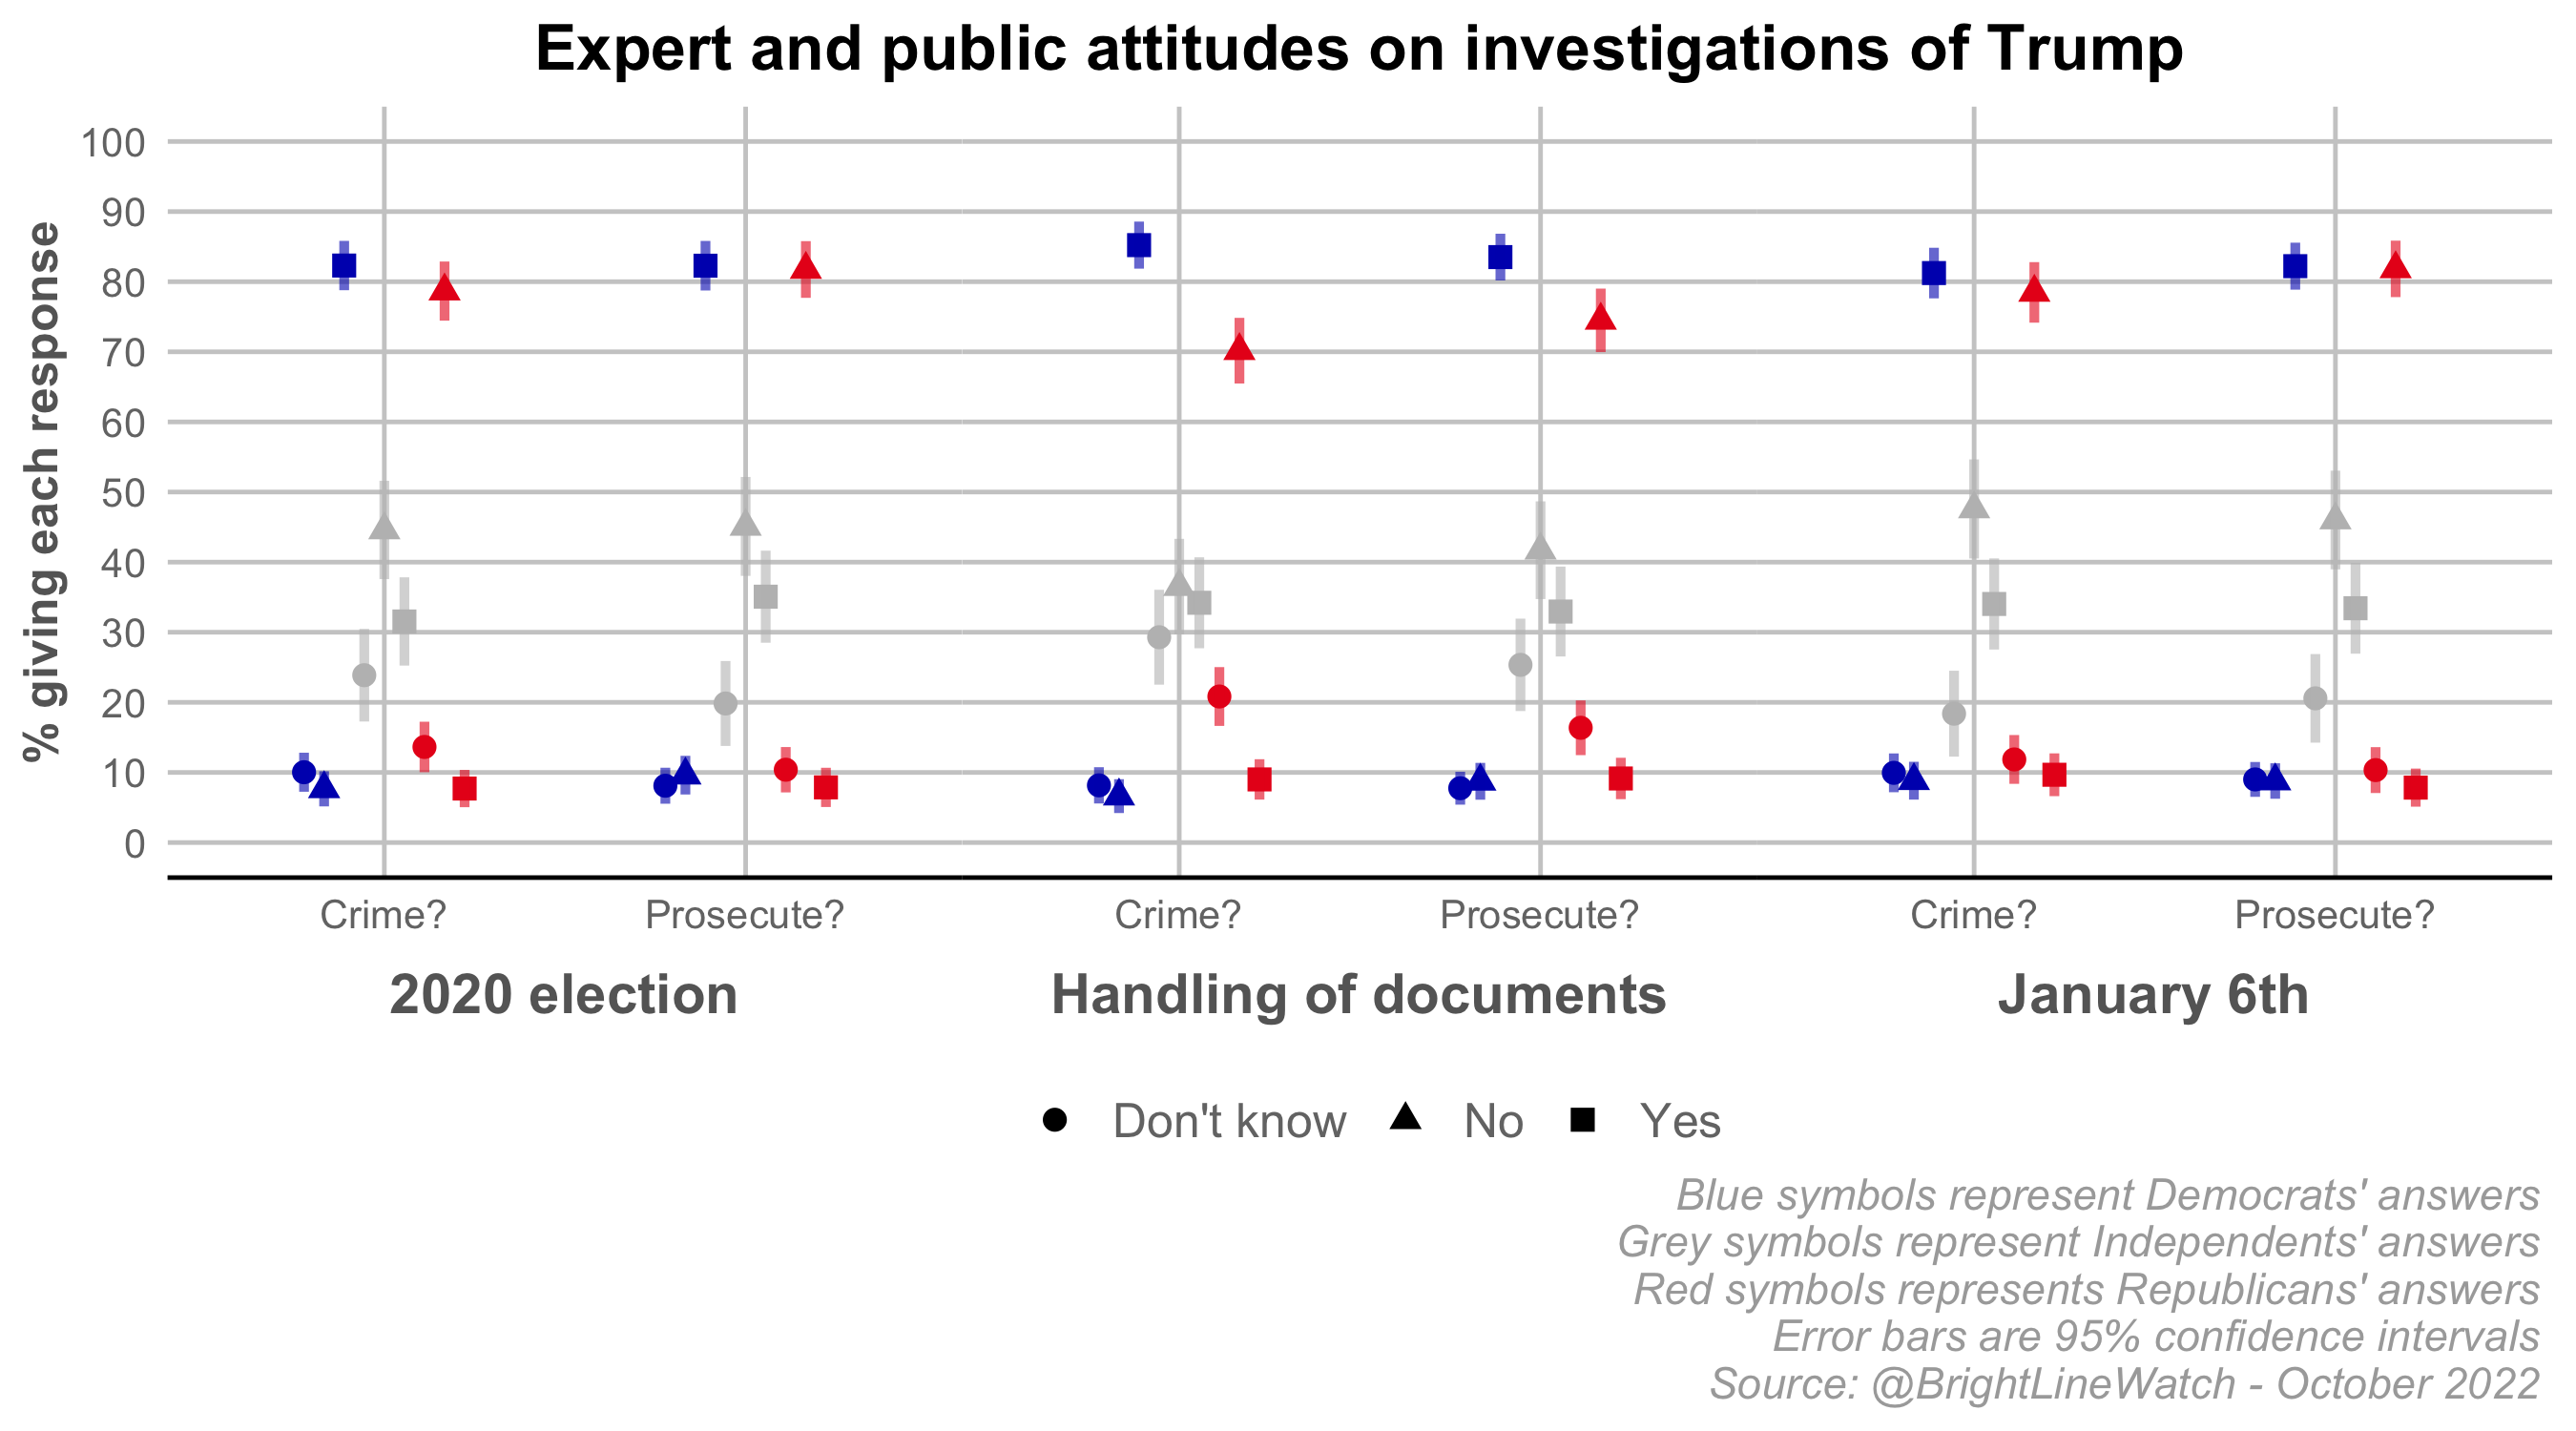
- We present results for respondents who were given “Yes” and “No” as the available answers. Results are similar among those who were randomly assigned to be provided also with a “Don’t know” response option, though the percentages saying they believe Trump committed a crime and should be prosecuted falls below 50% when the “Don’t know” option is provided. A figure showing those results is in the appendix to this report.
- We asked anyone who said Trump committed a crime but should not face prosecution why they held those views. However, there were not enough such respondents in either sample for us to conduct a meaningful analysis.
- Of 24 ratings (public and expert for 12 countries measured in both surveys), 16 declined and 8 increased.