Threats to democracy and academic freedom after Trump’s second first 100 days
Bright Line Watch April 2025 survey
During the first months of Donald Trump’s second presidency, his administration challenged constitutional and democratic norms on a wide range of issues, including the scope of executive power and the authority of courts to check it, individual freedom of expression, due process and habeas corpus, immigration, and academic freedom.
As Trump completed his second first 100 days, we fielded parallel surveys of 760 political scientists (whom we refer to as “experts” below) and a representative sample of 2,000 Americans (whom we refer to as “the public” below). The expert survey was fielded from April 21–28, 2025 and the public survey from April 21–24, 2025.
Our key findings are the following:
Assessments of democratic performance
-
Overall ratings of American democracy dropped significantly among every group surveyed — academic experts, the public overall, and Republican and Democratic members of the public.
-
For the first time since we began surveying in 2017, public ratings of democratic performance dropped below the scale’s midpoint, reaching 49 in April. Ratings dropped even among Republicans, decreasing from 59 in February to 56 in April.
-
Across 31 democratic principles, experts perceive the largest declines since Trump returned to the presidency in protections for unpopular speech or expression, government agencies not being used to punish political opponents, freedom of the press, the impartiality of criminal investigations, and judicial independence.
Threats to democracy
-
Experts overwhelmingly rate the following federal actions as threats to democracy: Trump’s failure to return Kilmar Abrego Garcia from El Salvador after he was deported due to an administrative error, the executive order targeting the Democratic fundraising platform ActBlue, and the administration’s actions to withdraw funding from leading universities and to limit their academic freedom. In each case, more than three-quarters of respondents rate the threat as serious or extraordinary.
-
Experts see Columbia University’s initial response to the Trump administration’s demands as a threat to democracy and Harvard’s refusal to concede as a benefit.
-
Regarding future threats, experts are nearly unanimous in their view of Trump’s oft-discussed idea of sending American citizens to foreign prisons: 97% say it would pose a threat to democracy, and 78% say it would be an extraordinary threat. Almost all experts rate Trump’s plan to drastically increase the number of denaturalizations of American citizens as a threat to democracy. And almost all view partisan impeachment of a federal judge by Republicans as a threat to democracy. Nearly half rate denaturalization of citizens and judicial impeachments extraordinary threats.
Expert views on campus antisemitism and DEI
-
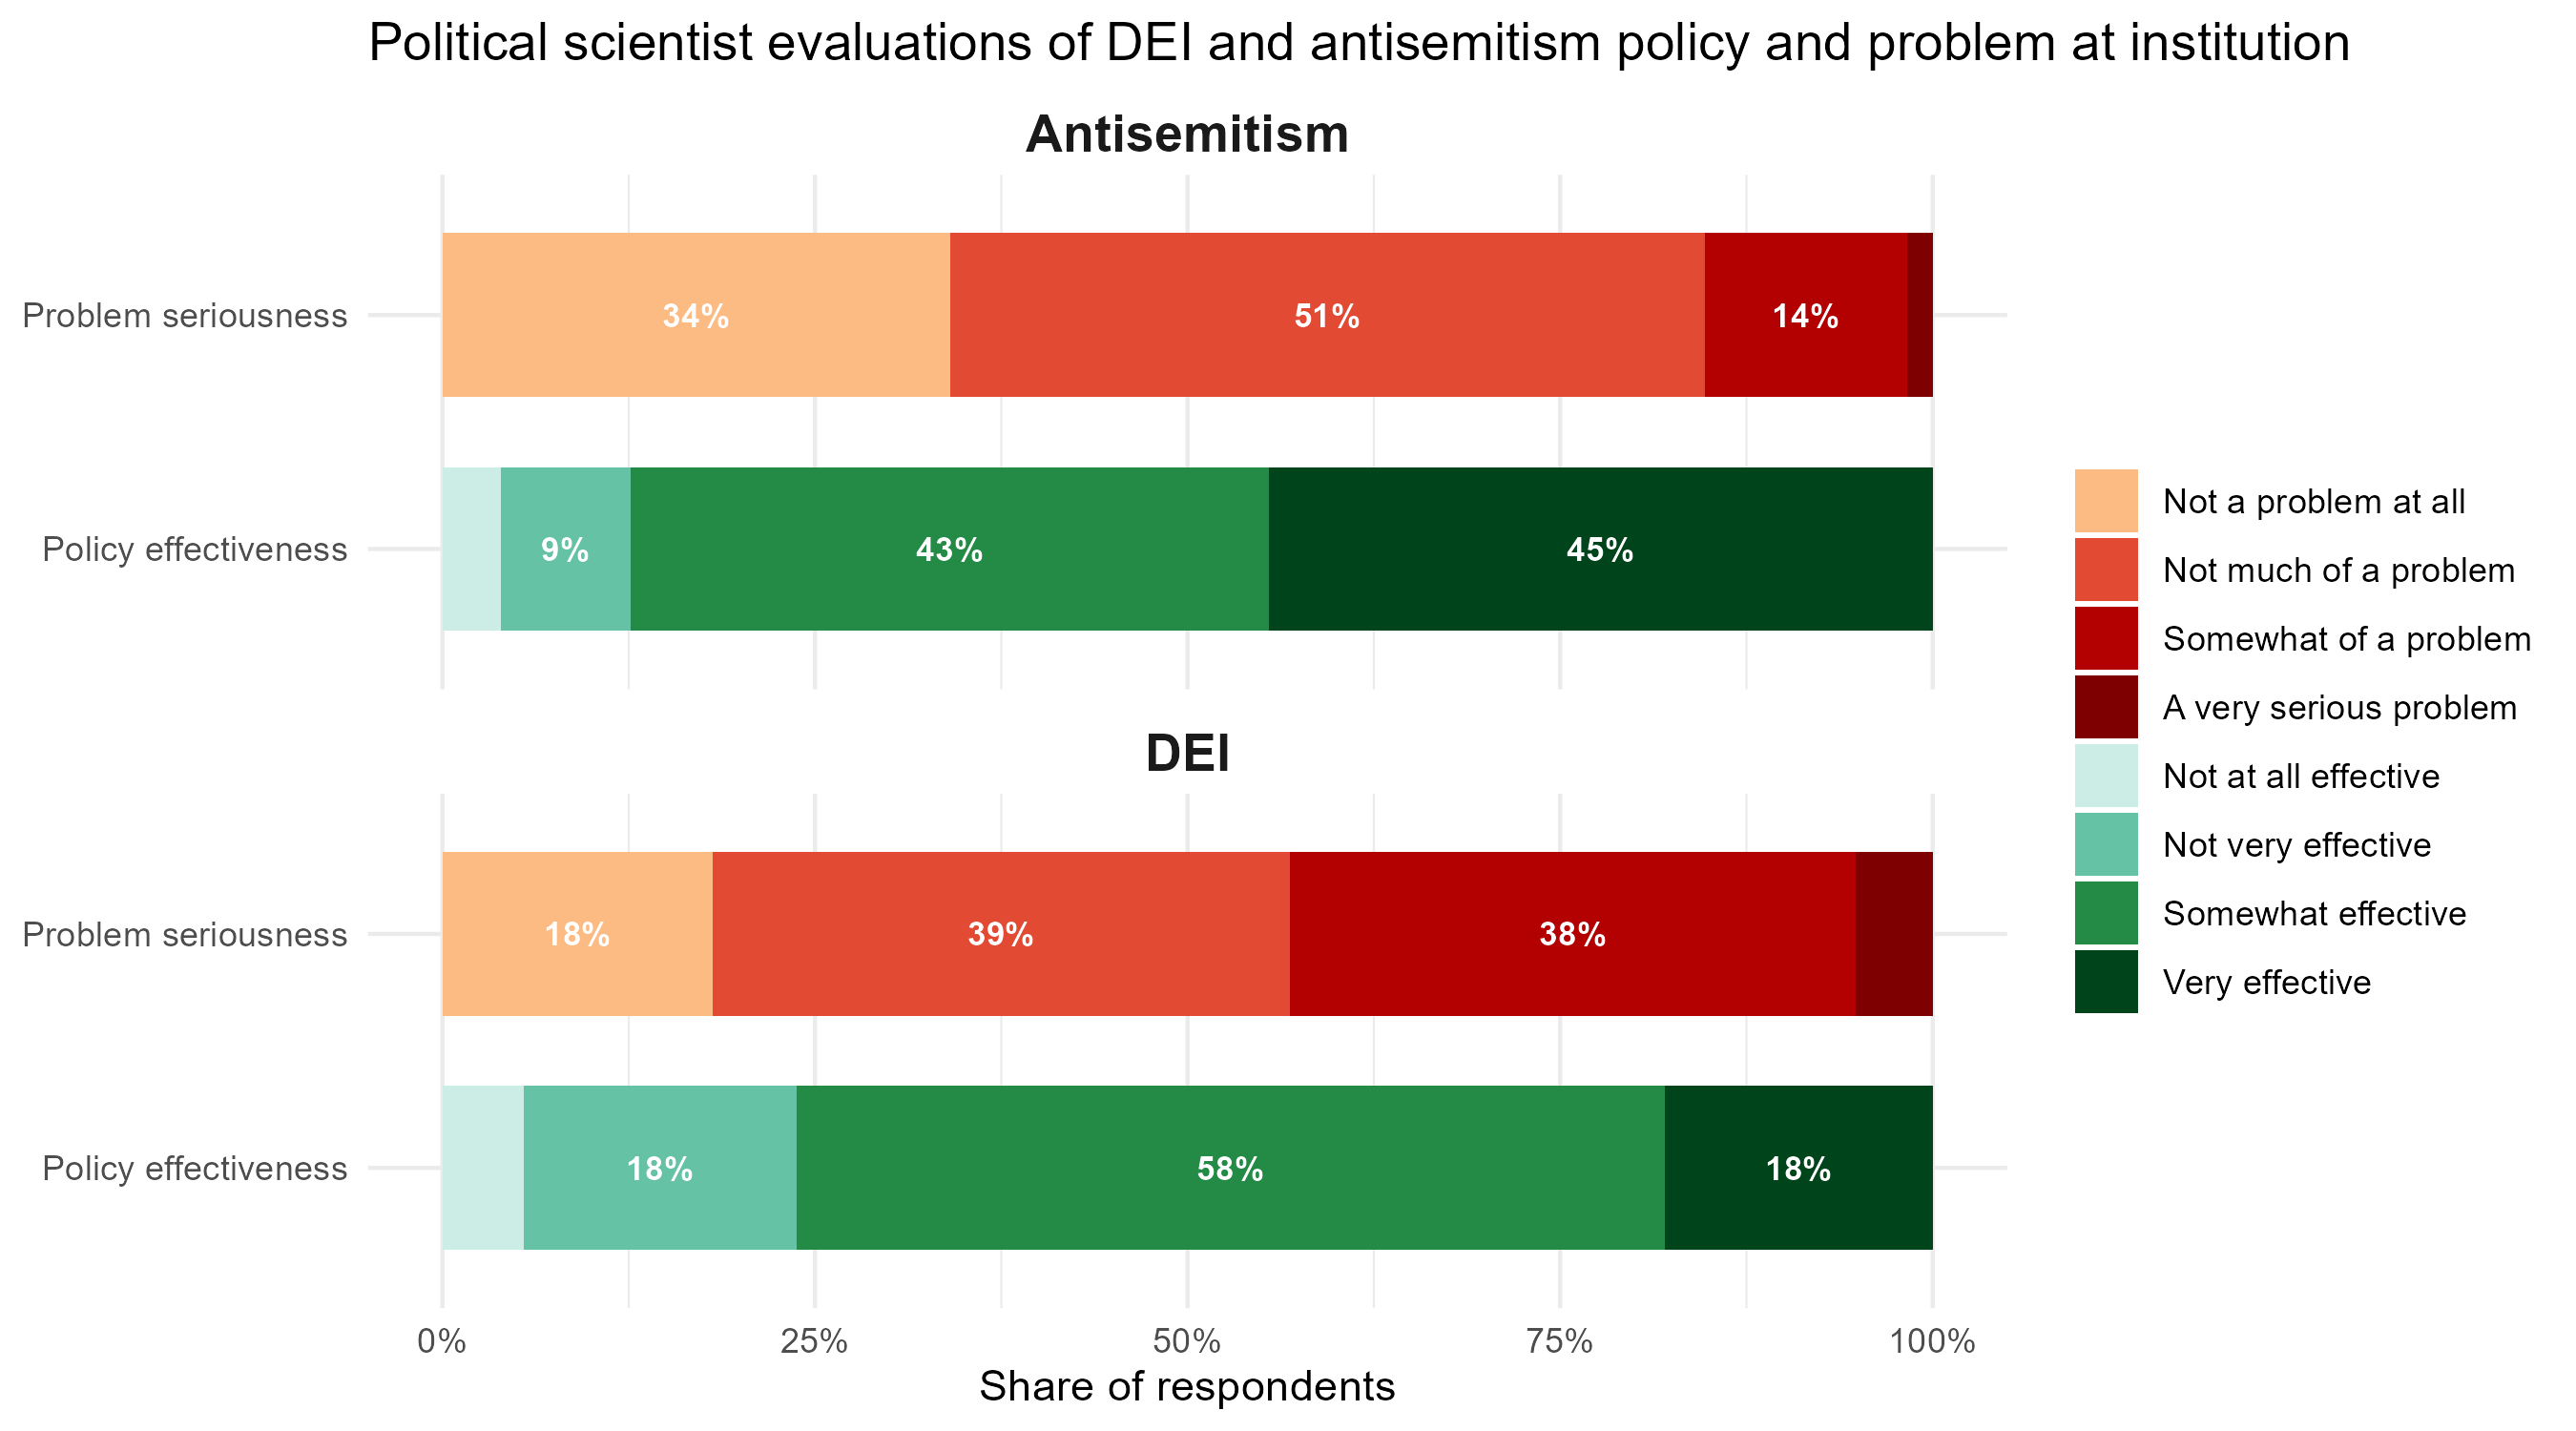
A large majority of political science faculty – 85% – say antisemitism was not a problem (34%) or not much of a problem (51%) on their campus as of January 2025. A similarly large majority – 88% – say that policies in place at that time were somewhat (43%) or very effective (45%) in protecting their campus communities from antisemitism.
-
Jewish faculty are more likely than non-Jewish faculty to say antisemitism was a problem in January 2025 (20% versus 14%) but still mostly regard prior policies as effective (77%).
-
A majority of faculty – 57% – also say that racial and ethnic diversity and inclusion was not a problem (18%) or not much of a problem (39%) on their campuses in January 2025. Most – 76% – also regard policies in place at the time as having been somewhat effective (58%) or very effective (18%) in promoting diversity and inclusion.
-
Non-white faculty are more likely than white faculty to say that diversity and inclusion were a very serious problem in January 2025 (10% versus 4%). But non-white faculty are also more likely not to regard it as a problem at all at that time (25% to 17%). Non-white and white faculty offer similar assessments of the effectiveness of previous policies to promote diversity and inclusion on campus.
Academic freedom and self-censorship
-
Political science faculty experts perceive modest declines in academic freedom at their universities since January 2025. Most indicate no change in academic freedom around research (76%), teaching (69%), and extramural speech (67%), but among those who perceive a change, far more perceive declines (22%, 29%, and 30%, respectively) than increases (2%, 2%, and 3%).
-
Nearly half of faculty perceive decreases in academic freedom on the topics of the conflict in Israel/Palestine (43% decrease, 4% increase) and diversity, equity, and inclusion (DEI; 42% decrease, 8% increase). Smaller minorities of faculty also perceive changes in academic freedom around national politics (27% decrease, 6% increase), gender identity (27%, 5%), and sexual orientation (19%, 4%).
-
A majority of faculty report refraining from expressing themselves openly in extramural speech (55%). Smaller percentages say they self-censor in communications with students (40%), in classroom teaching (33%), and in research and publications (20%).
-
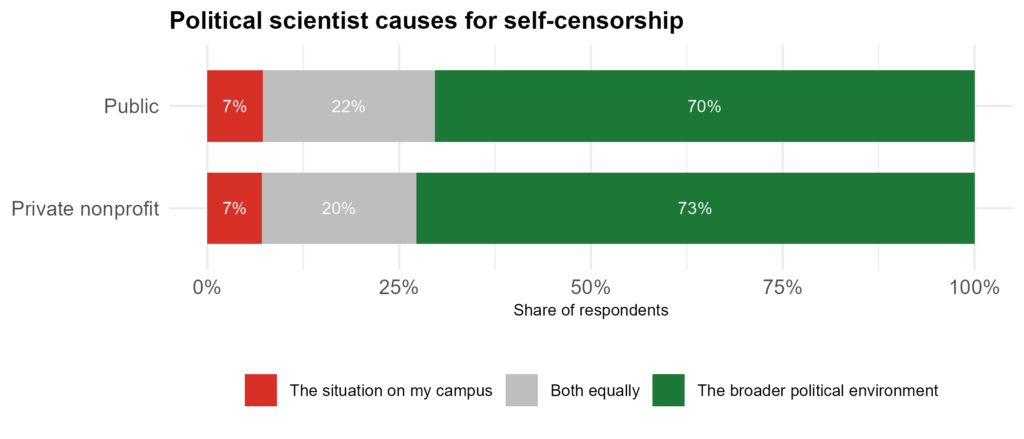
Of those who self-censor, most (71%) attribute their behavior to the political environment beyond campus or said campus-specific factors and broader factors weigh equally (22%). Only 7% cited campus-specific factors alone.
-
Self-censoring faculty say they are motivated by concerns over harassment online and in person (64%), potential professional consequences such as loss of jobs or promotions (48%), legal sanctions such as prosecution or fines (26%), violence (19%), and social exclusion (16%).
-
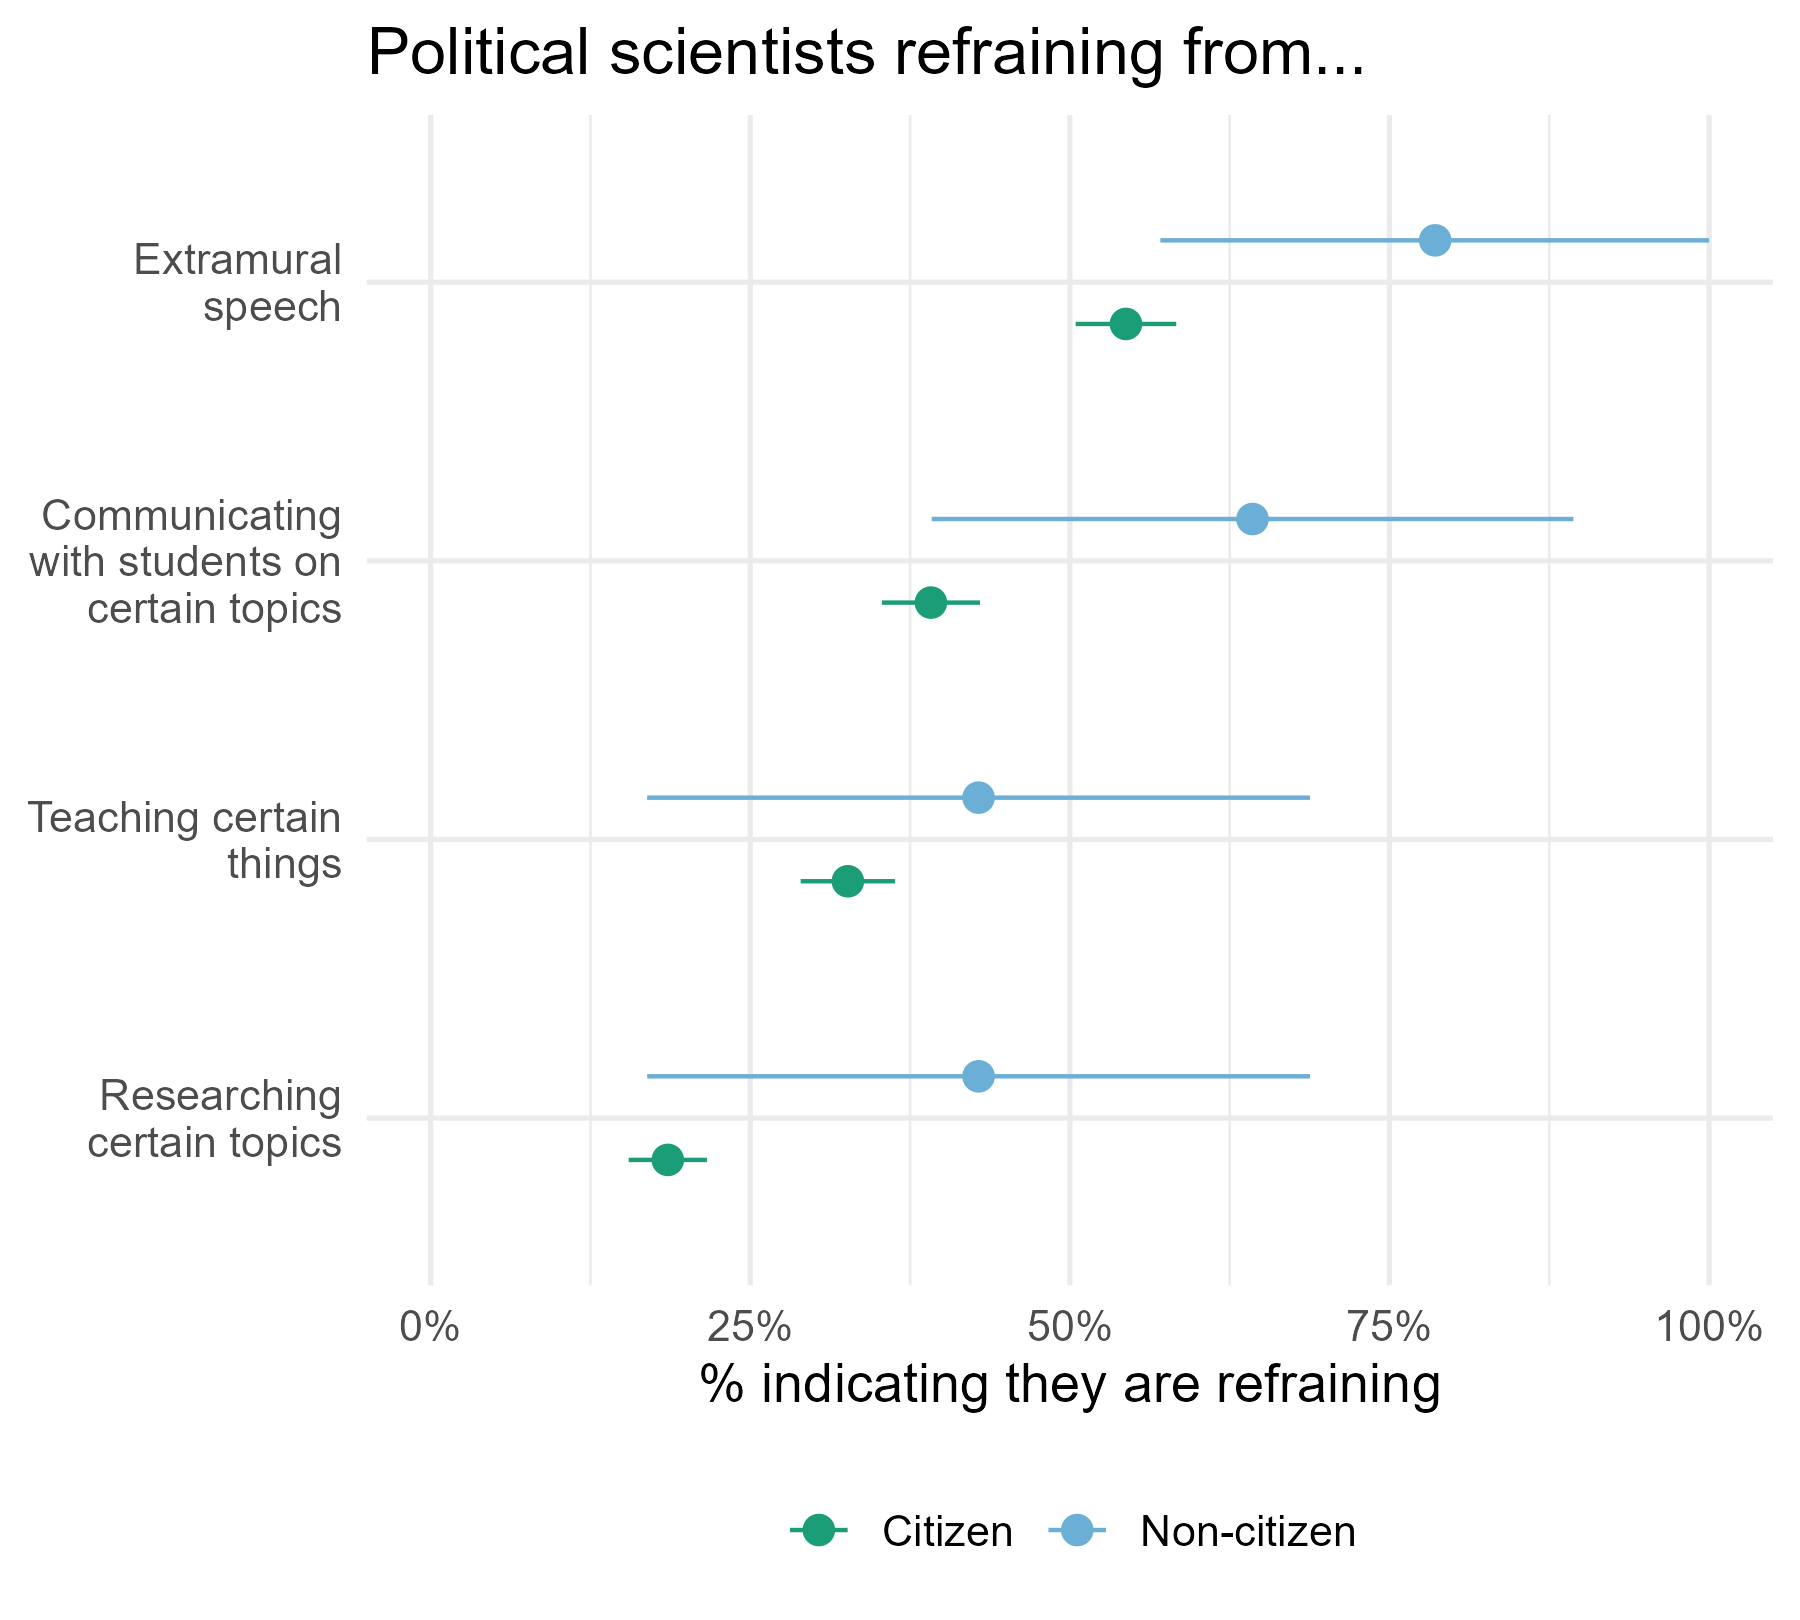
Faculty who are not U.S. citizens most frequently cite concerns about immigration, residency, and citizenship status as a reason for self-censorship (75%). These concerns are also common among faculty who are naturalized citizens (44%).
-
Faculty mostly regard their university administrations as supportive of academic freedom (72% say “a great deal” or “quite a bit”). Faculty at private universities rate support for academic freedom as their institutions to be higher than do faculty at public universities. Perceived administrative support for academic freedom is lowest on the issue of Israel/Palestine.
State of American democracy
We have asked expert and public respondents to rate the overall performance of U.S. democracy on a 0–100 scale since 2017 and 2018, respectively. Our April 2025 survey also asked expert respondents what rating they would expect to give the U.S. on the same scale in 2027.1 The figure below shows the time series from our expert sample, the public overall, and Democrats and Republicans in the public sample along with the projected future expert rating.
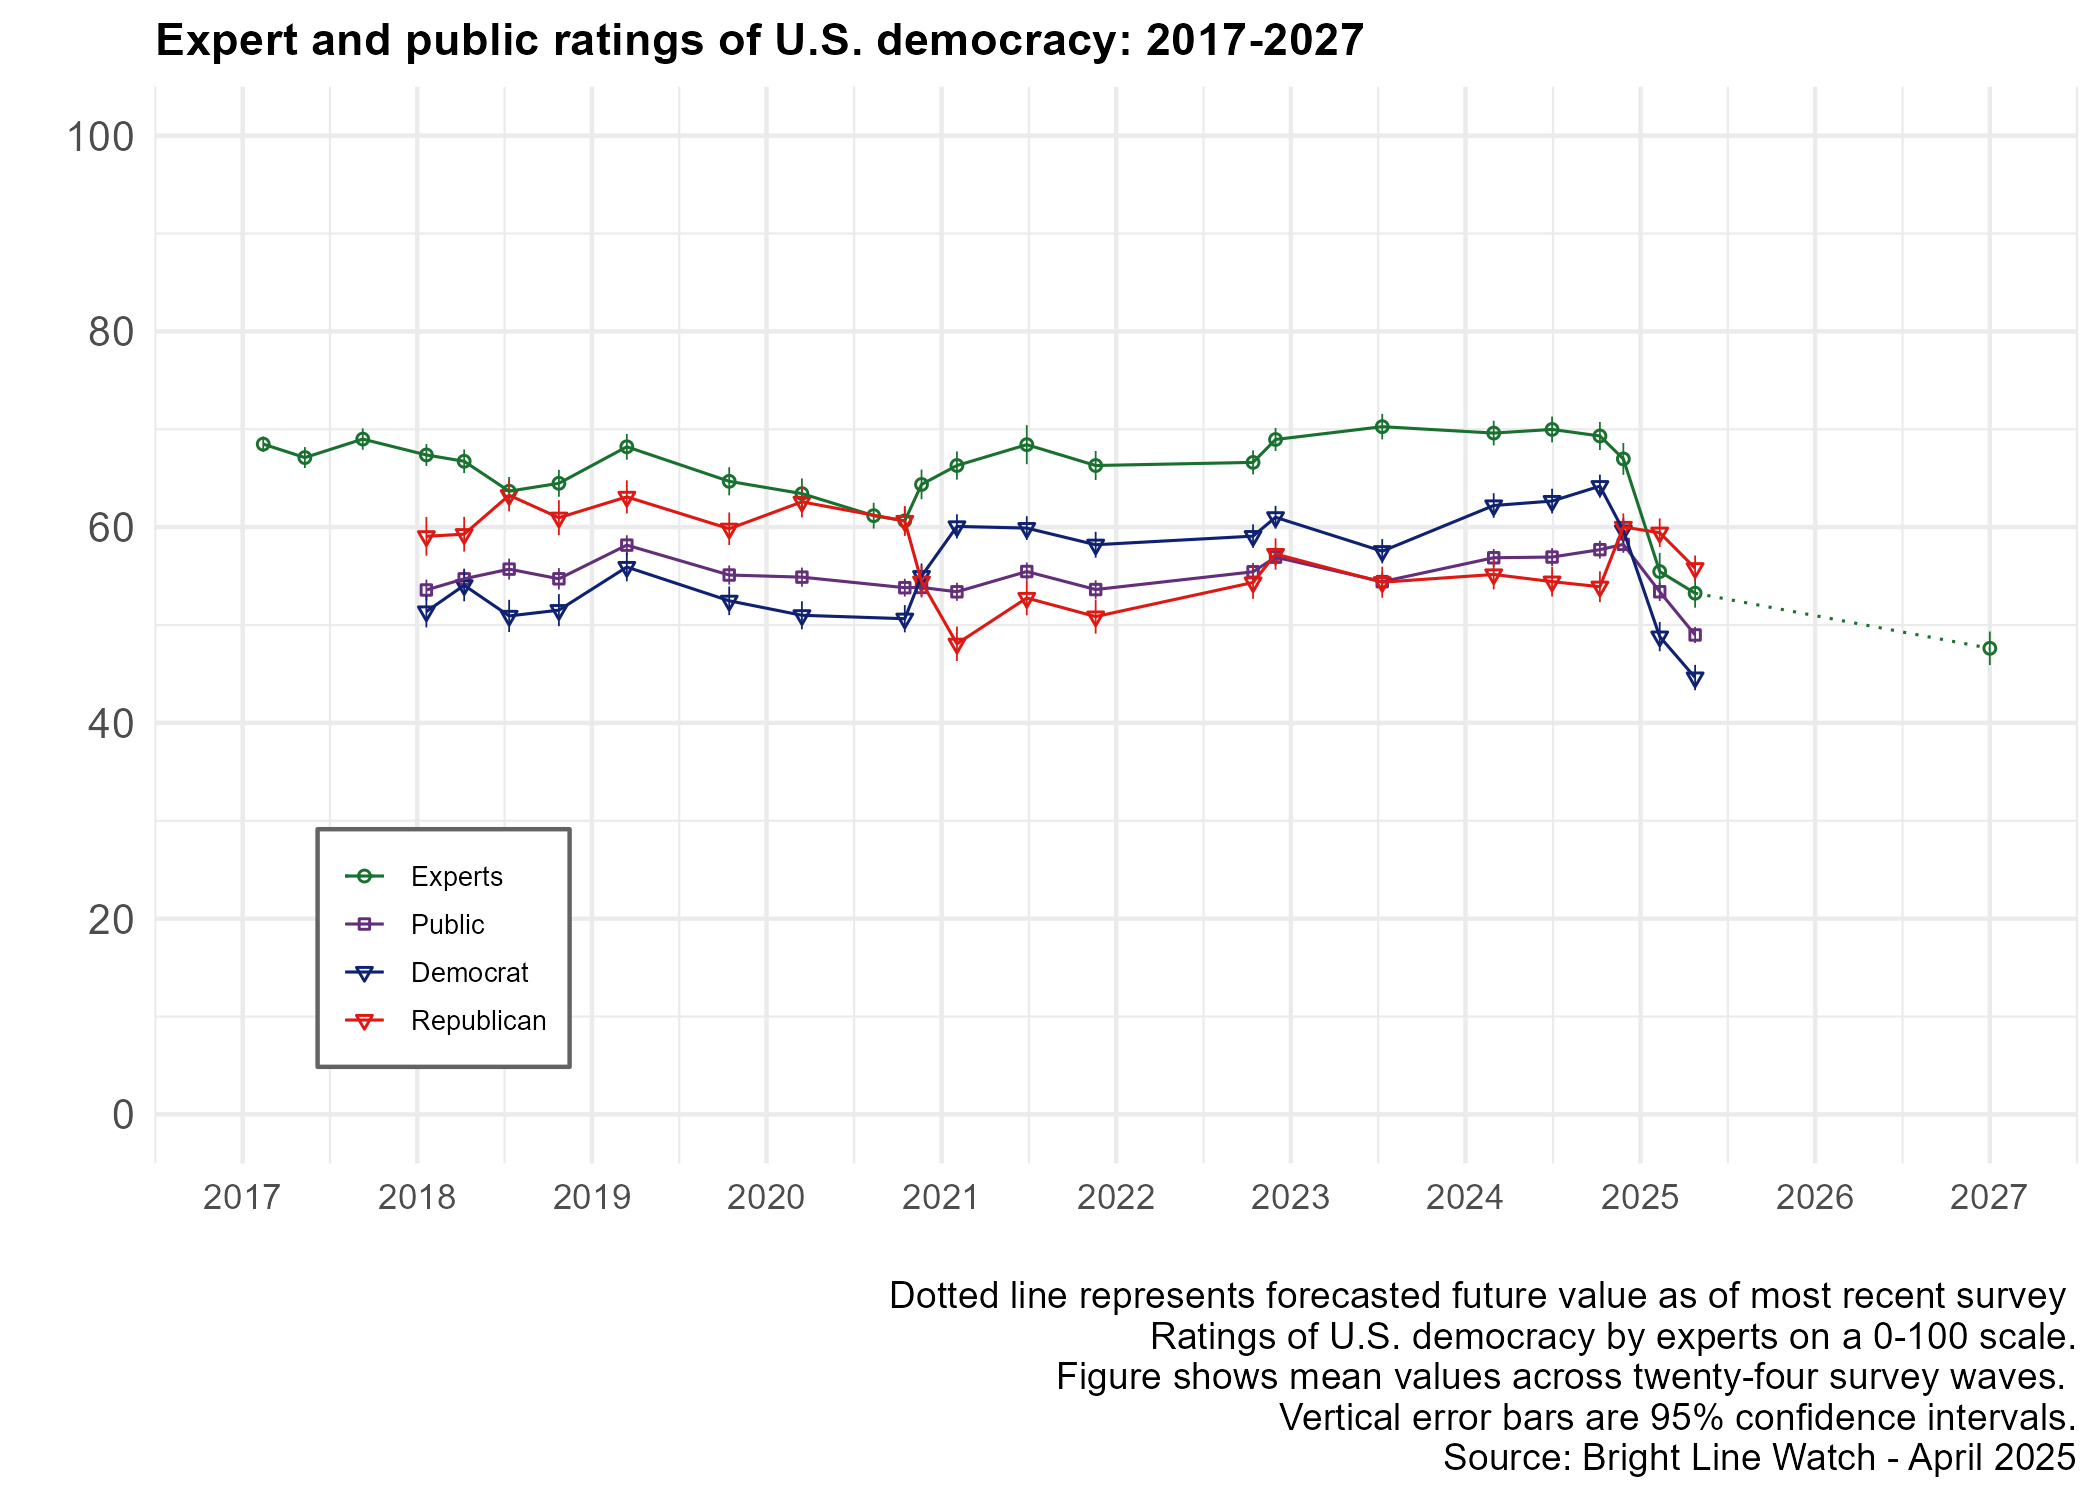
In the two months since our last survey, ratings of U.S. democracy declined among all groups — the public overall, Democrats, Republicans, and our academic experts. The shifts are statistically significant in every case.
The mean public rating fell from 58 in December 2024 to 53 in February before reaching 49 in April — the first time it has fallen below 50 on the 0–100 scale since we began collecting public data on this question in 2018.
Democracy ratings even dropped among Republicans, falling from 59 to 56. The only larger drops we have measured among Republicans were between our October and November 2020 surveys, when Joe Biden defeated Trump in the 2020 election, and from November 2020 to January 2021, a period that included the January 6 attack on the U.S. Capitol, Trump leaving office, and his second impeachment. Ratings of democracy among Republicans are now statistically indistinguishable from October 2024, when Biden was still in office and the race between Trump and Kamala Harris was very competitive. Democrats have also downgraded their assessments of American democracy, from 49 to 45, on average.
Perhaps most notably, expert ratings of American democracy have continued to decline over recent months, from a mean of 55 in February to 53 in April. Expert ratings had previously stayed between 60 and 70 on our 0–100 scale during both Trump’s first term and Biden’s time in office, never dropping below 60 even when Trump tried to overturn the result of the 2020 election. Until now, experts had tended to be at least as optimistic about democracy as the public. The average expert rating was 67 as recently as November 2024, after Trump won his second term. In our two surveys since the start of Trump’s second term, however, mean ratings have plummeted to 55 and now to 53. When asked to forecast their rating in 2027, the experts expect a continued decline to a rating of 48 (the dotted line in the figure).
To put these figures into context, we asked experts in our April survey to rate democratic performance in eight other countries on the same 0–100 scale. The figure below contrasts expert ratings of U.S. democracy (highlighted with a dashed vertical line) versus these other countries.
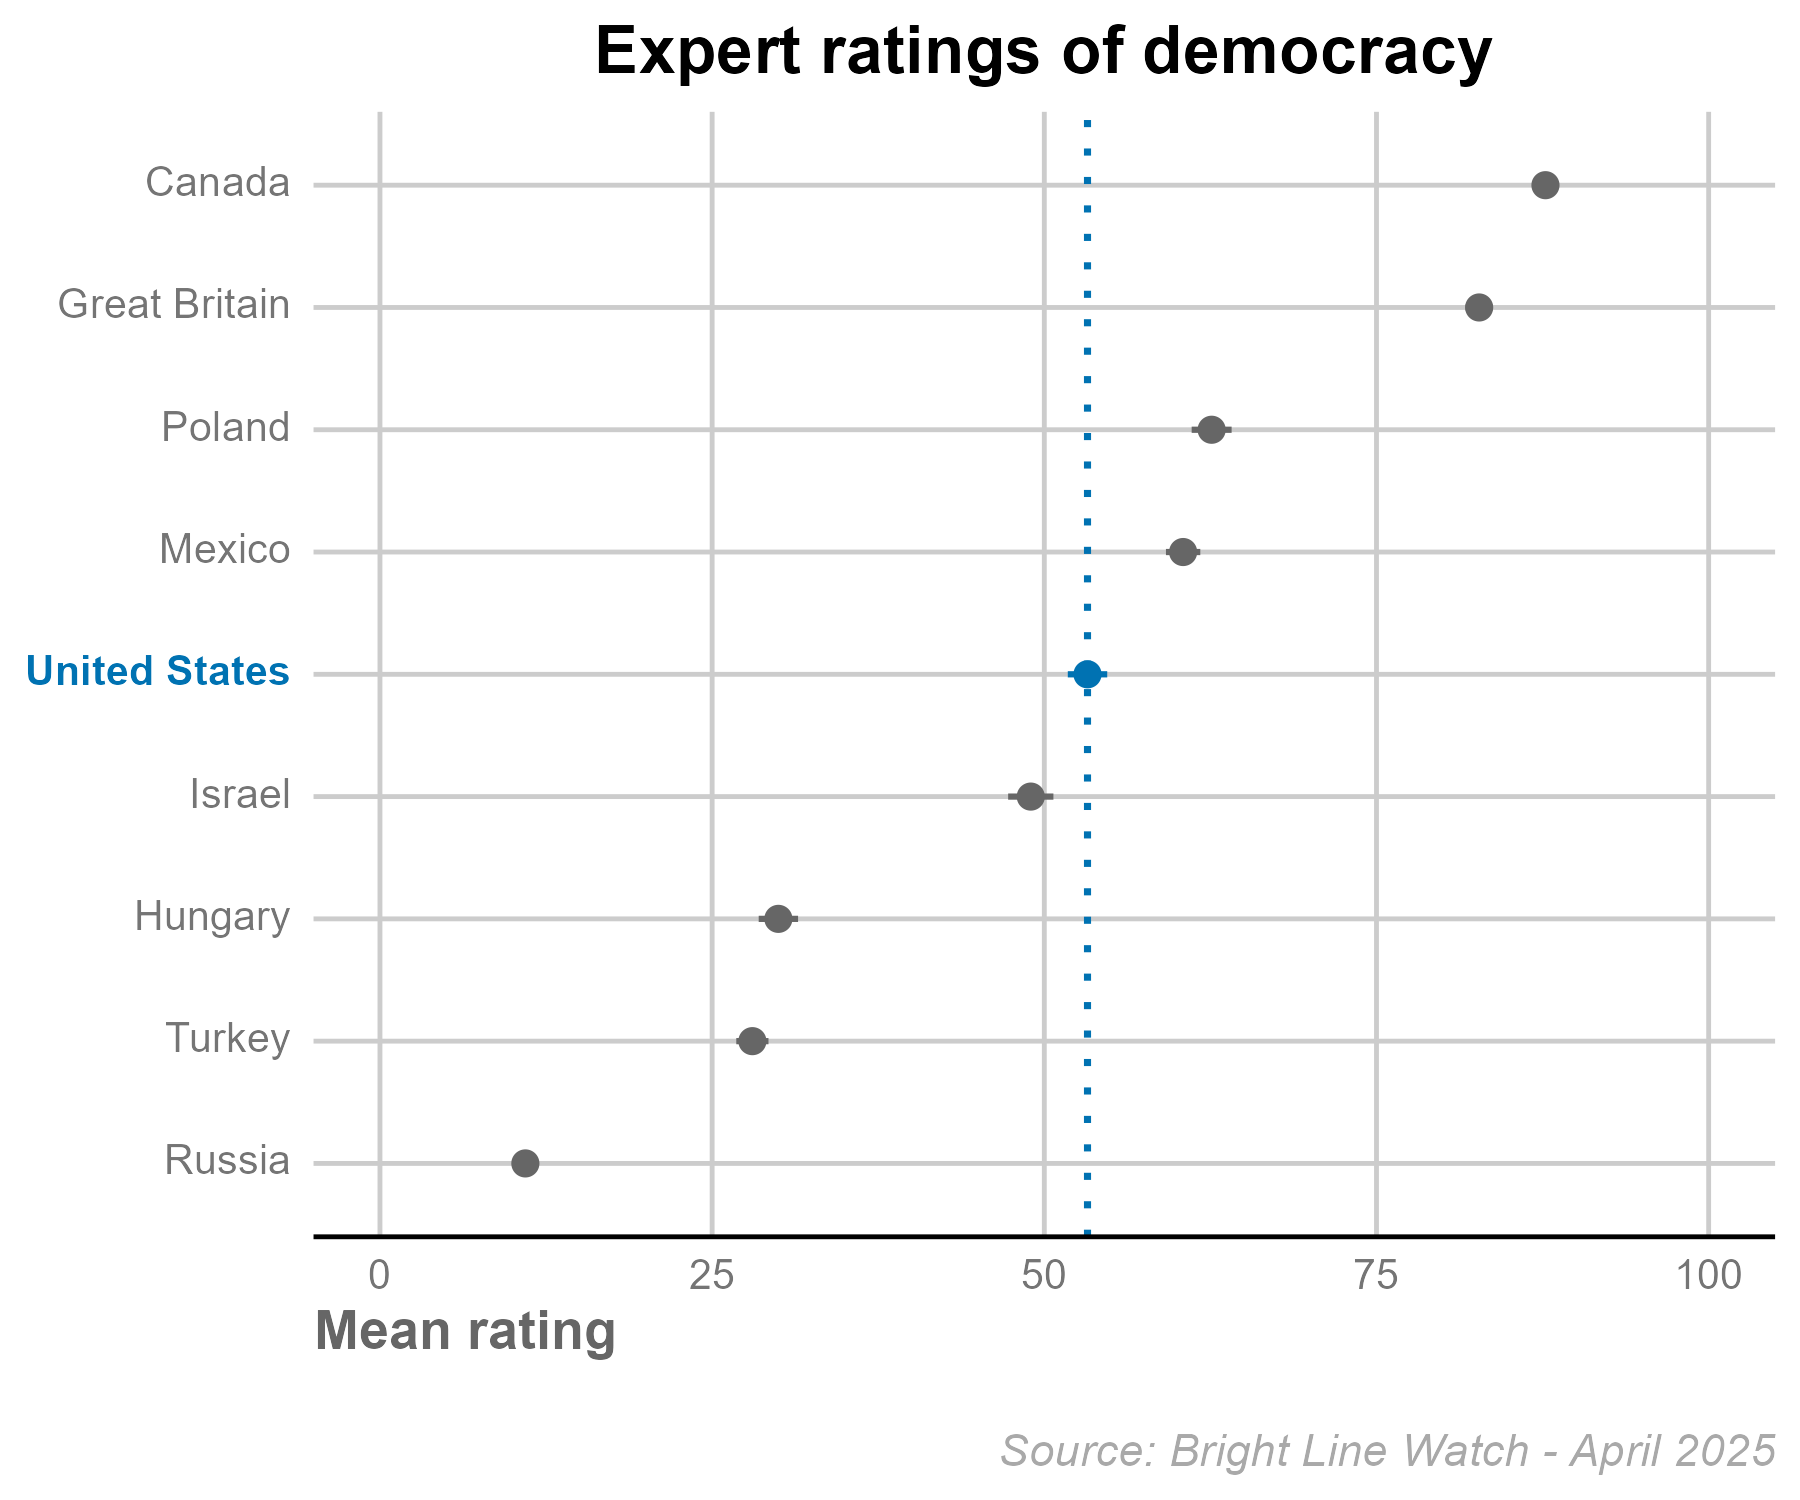
The United States’ current democracy rating of 53 places it just above Israel (49) and below Mexico (60) and Poland (63). Canada (88) and Great Britain (83) are rated well above the United States by experts, while Hungary (30), Turkey (28), and Russia (11) still rate well below.
These findings also indicate that U.S. democracy has declined relative to other countries. We last asked experts to rate democracy elsewhere in July 2023. At the time, our rating of 70 trailed Great Britain (77) by much less and we were well ahead of Israel (55), Poland (54), and Mexico (53).2
Performance on democratic principles
As in past surveys, we asked expert and public respondents to rate the extent to which specific democratic principles are currently upheld in the U.S. The full list of all 31 principles is provided in the appendix (experts were asked about a random subset of 9 versus 7 for the public).
The left panel of the figure below shows the percentage of respondents who regard the U.S. as fully or mostly meeting each standard (as opposed to meeting it partly or not at all). The right panel shows the change (in percentage points) from February to April in the proportion of the respondent group who say the U.S. meets that standard. The markers indicate respondent groups: political science experts (green) as well as Democrats (blue) and Republicans (red) from our public sample. (A version of this graph that presents assessments from the experts juxtaposed with the public overall is provided in the appendix.)
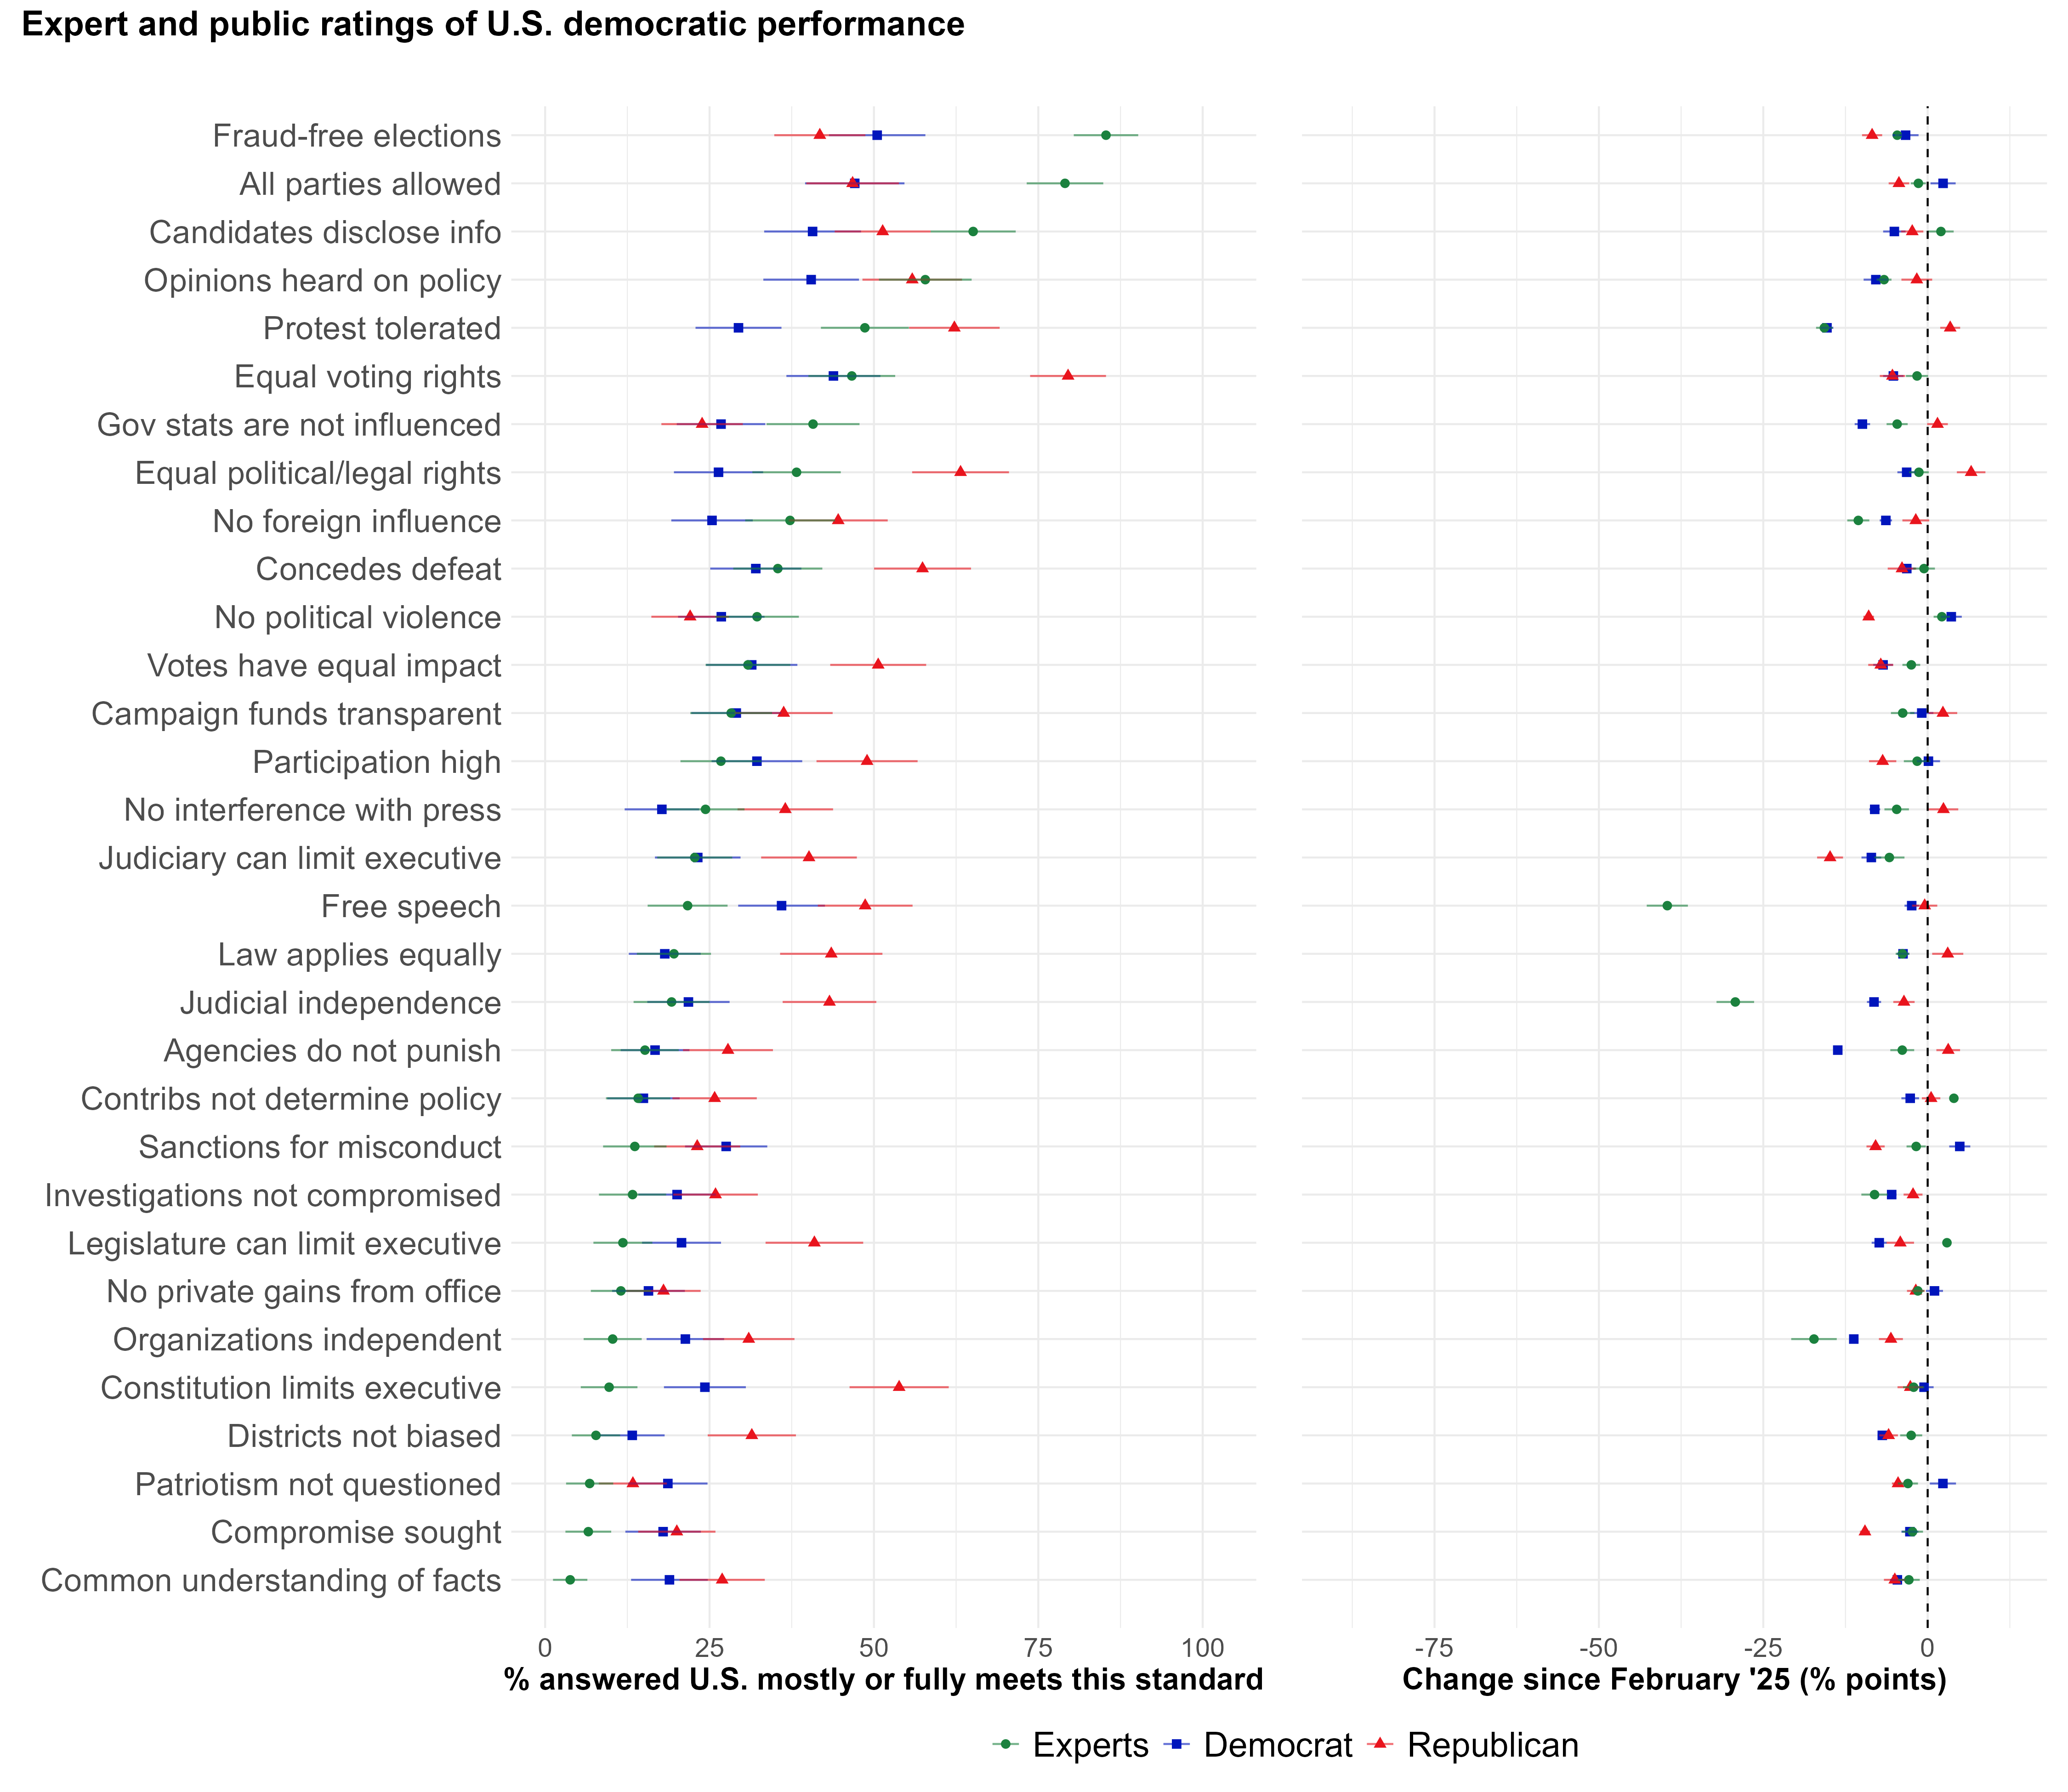
The expert survey generates the strongest signals about changes over time. The most dramatic shifts are in expert evaluations of protection of individuals’ right to engage in unpopular speech or expression (denoted as “Free speech” in the figure), which dropped from 61% to 23%. The widely publicized arrests and moves to deport students who had protested and published criticisms of Israel’s conduct of the war in Gaza likely contributed to this dramatic change. The experts also sharply downgraded ratings of judicial independence (from 45% to 17%) and of the ability of universities, businesses, and professional organizations to operate independently of government pressure (from 26% to 10%). We attribute these drops to the Trump administration’s ongoing challenges to court orders related to deportations without due process and its moves to cut funding and pressure universities to change policies on admissions, hiring, student discipline, and curricular content.
These changes – just since February – are part of a much larger decline in expert assessments of American democracy. The next figure shows the percentage of experts holding that the United States mostly or fully upholds each of our 31 principles (the data go back to 2017 when possible, but some principles were added later). The items are ordered in descending order of their decline since November 2024, after the election but before Trump’s second term began. A box around an item indicates that its decline since the November post-election survey is statistically significant at the p < .01 level (observed for 13 of the 31 principles).
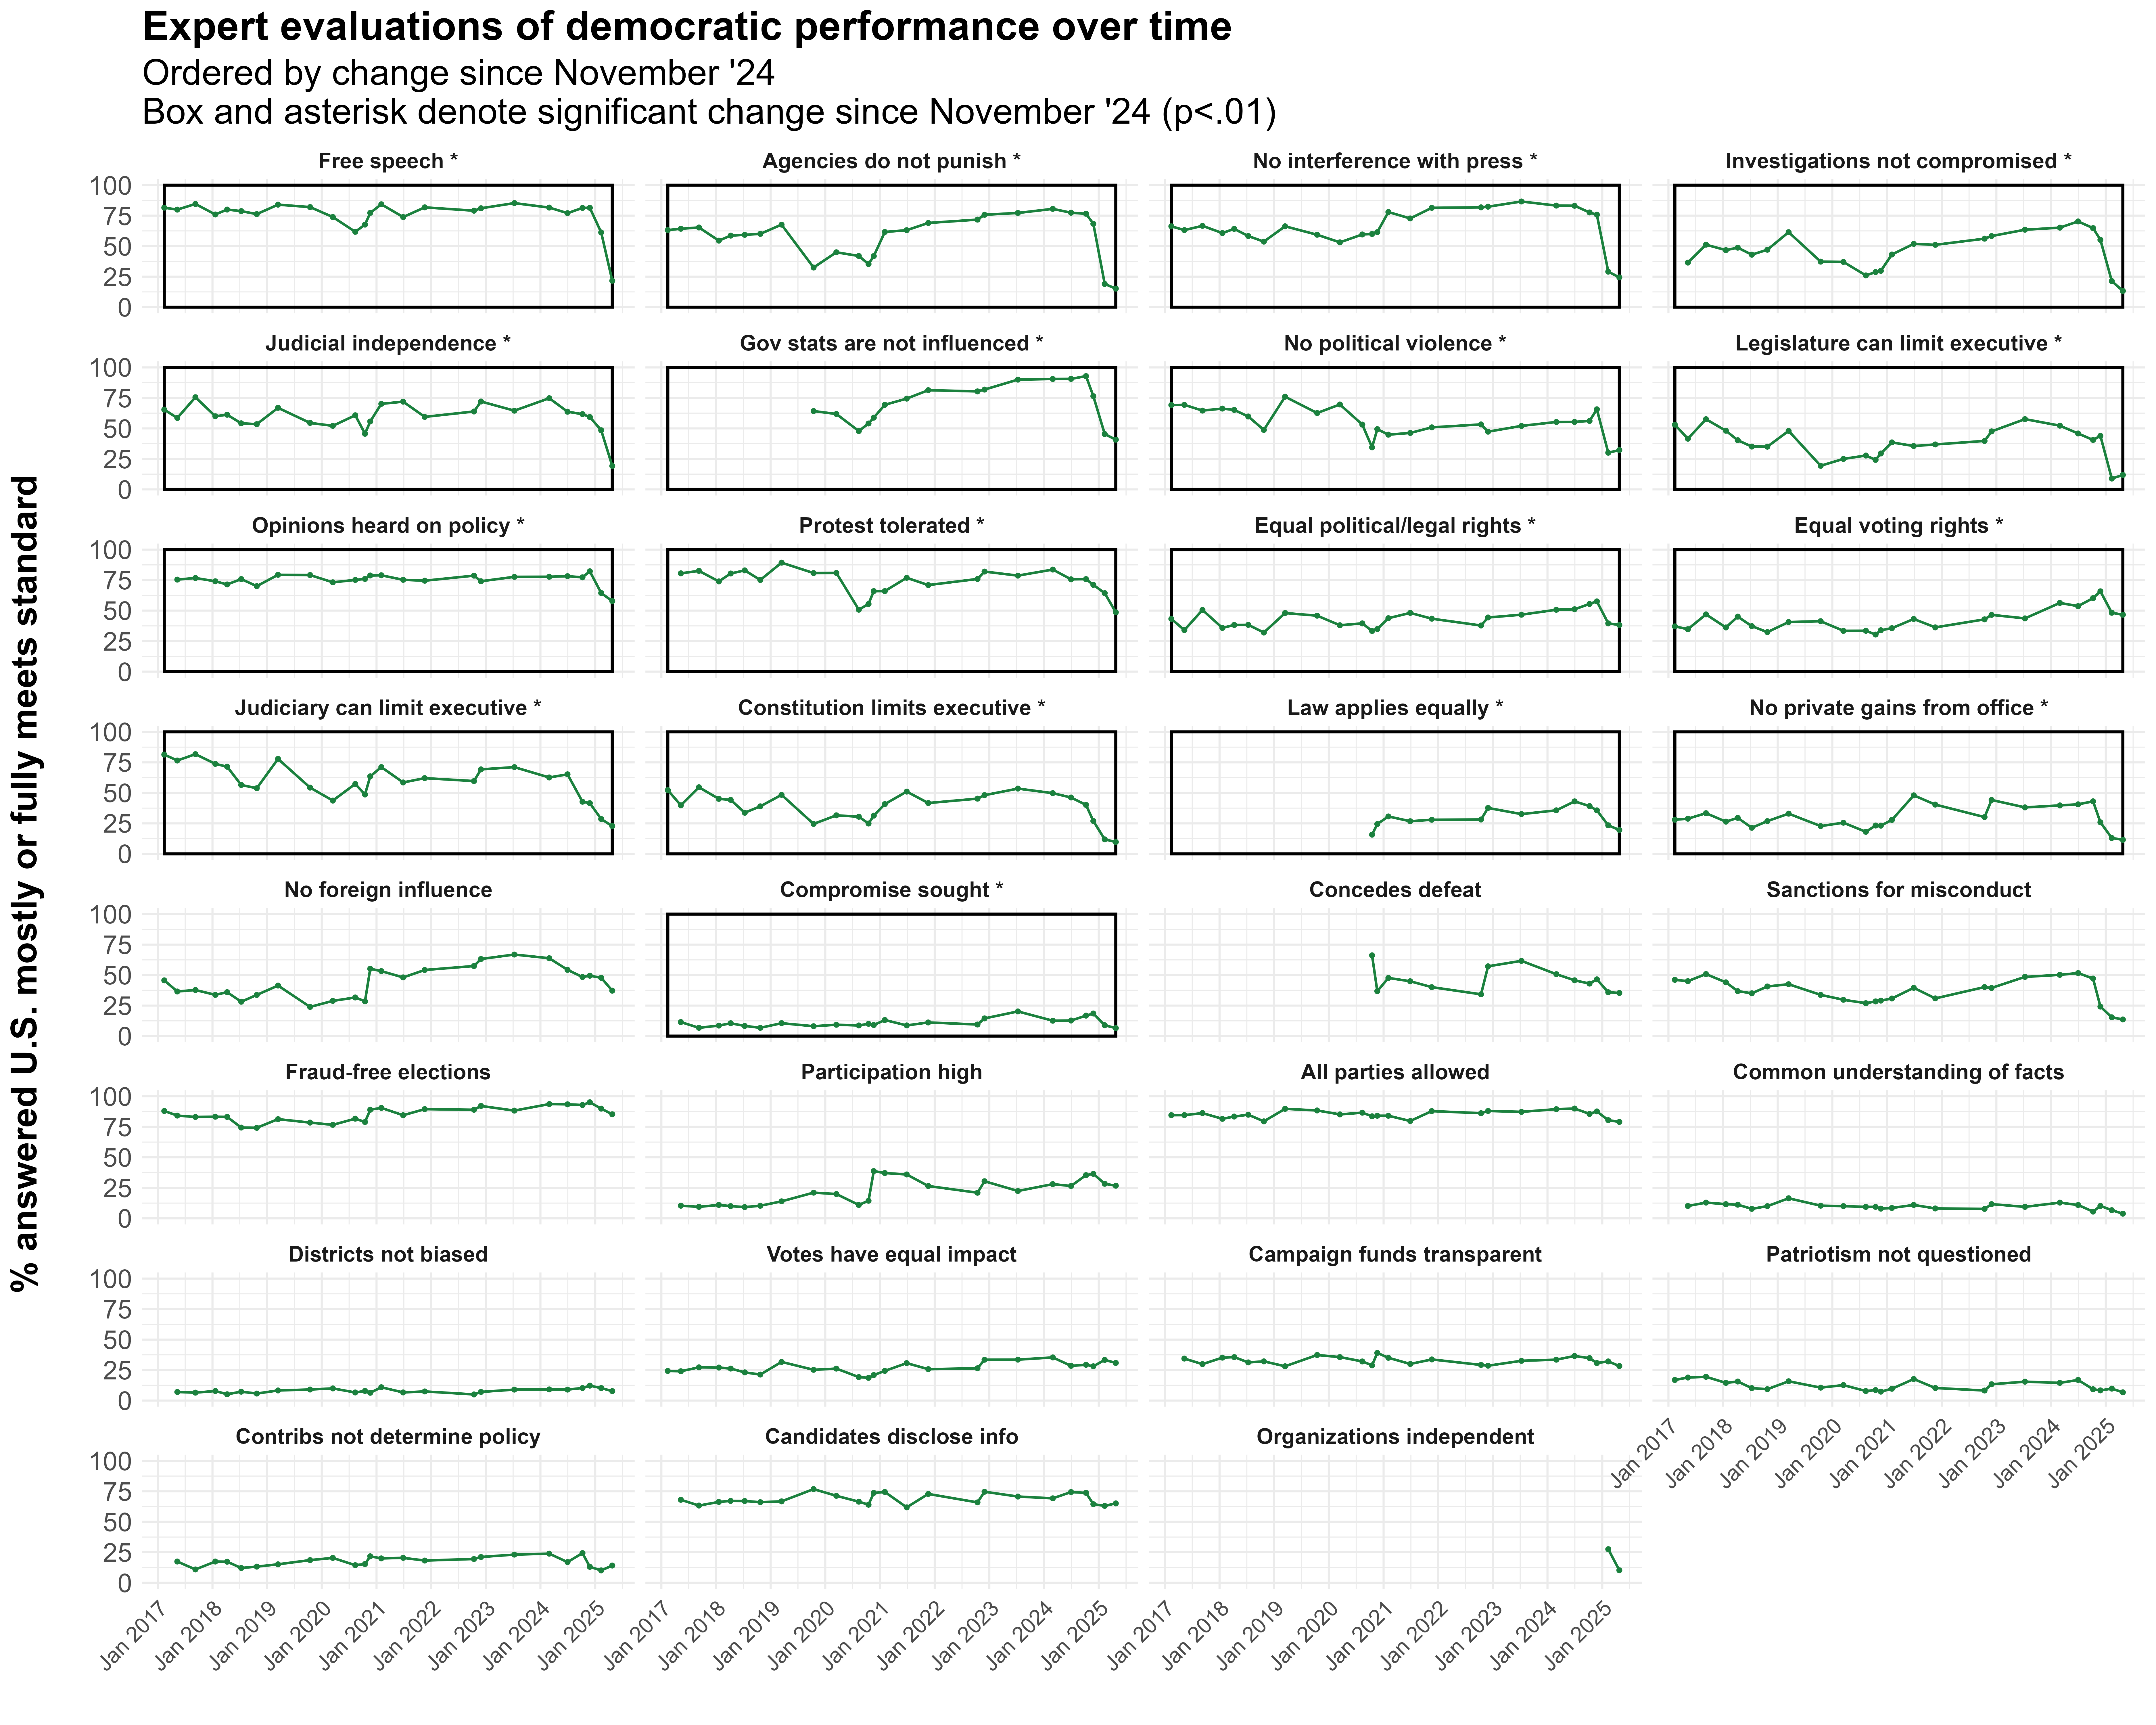
The figure highlights numerous dimensions of democracy on which assessments plummeted in the first months of 2025. These include protections for free speech and a free press, government agencies not being used to punish political opponents, law enforcement investigations are not politicized, respect for judicial independence, and the ability of courts and the legislature to check executive authority. In all these areas, the experts rate American democracy as having declined precipitously in 2025. Experts consistently have rated – and still rate – key aspects of electoral democracy favorably. Majorities regard American elections as largely free of fraud and open to all political parties. The experts also reliably rate our democracy as performing poorly on other principles – for example, that elected officials share a common understanding of facts or respect their adversaries’ patriotism.
Threats to democracy
We asked our experts to assess the impact of recent events and potential future events on American democracy. Respondents were first asked whether the event would benefit, threaten, or not affect American democracy. Those who selected “benefit” or “threaten” were then asked how they viewed the extent of the benefit or threat. The set of recent events that experts were asked to consider was the following:
- The Trump administration refusing to make efforts to return Kilmar Abrego Garcia from detention in El Salvador after a Supreme Court decision requiring the White House to “facilitate” his release.
- The Trump administration pressuring Columbia University and Harvard University to change their policies in order to retain federal funding.
- Columbia University’s response to pressure from the Trump administration to change policies in order to retain federal funding.
- Harvard University’s response to pressure from the Trump administration to change policies in order to retain federal funding.
- The Trump administration seeking to revoke Harvard’s tax-exempt status after it refused to change its policies in order to retain federal funding.
- President Trump directing the Justice Department to investigate ActBlue.3
The set of potential future events was the following:
- The federal government revokes citizenship from naturalized citizens at significantly higher rates than historical norms.
- U.S. citizens are transferred to El Salvador before July.
- Kilmar Abrego Garcia is released from custody before July.
- Harvard University publicly announces it will comply with any demands outlined in the Trump administration’s April 11 letter before June.
- Trump announces additional funding cuts to Harvard before June.4
- Judge Boasberg formally holds any official, agency, or representative of the Trump administration in contempt of court before May.
- A federal judge is impeached by Republican Members of Congress in a partisan vote before January 3, 2027.
- The US Senate weakens or eliminates the filibuster before January 3, 2029.
- The US establishes a government program rewarding information leading to deportations before January 3, 2027.
The left panels of the figures below show expert ratings of the perceived benefits and threats to democracy of events that have occurred (top graph) and potential future events (bottom graph). Events are listed in descending order of the percentage of experts who rate them as a threat to democracy. The right panels show the percentages of respondents who rated each scenario as neither a threat nor a benefit to democracy.
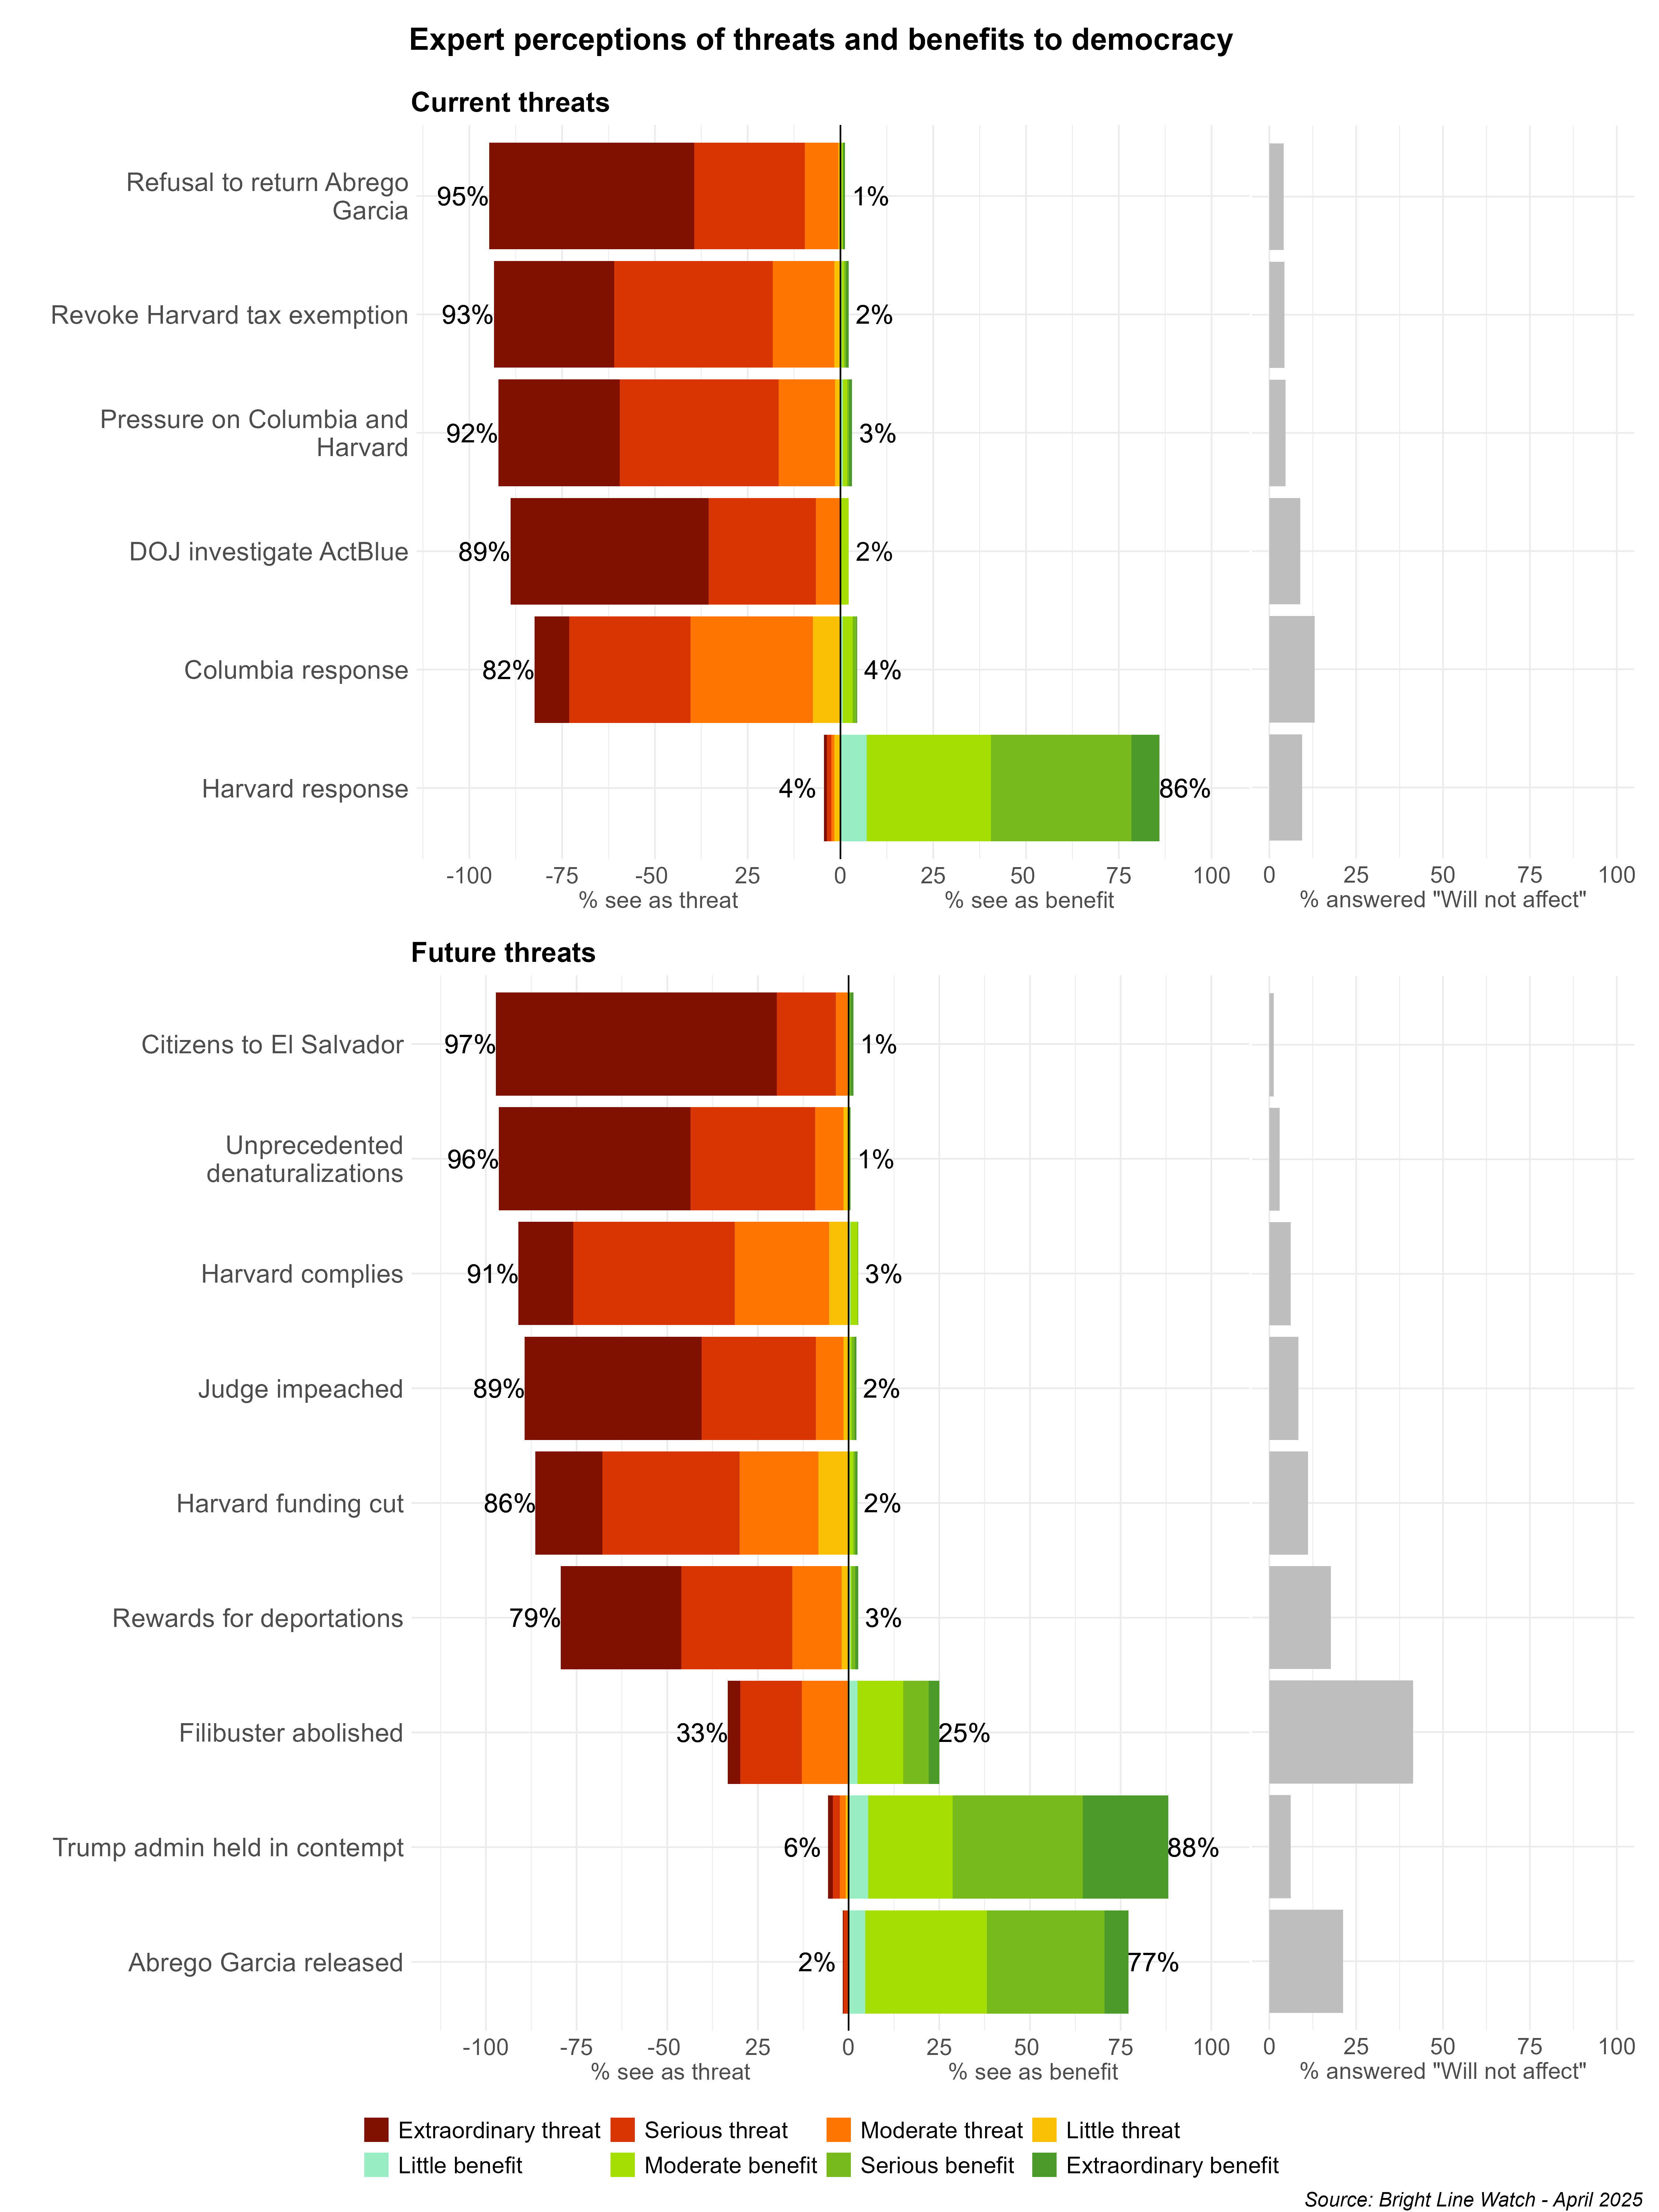
Experts overwhelmingly rate the administration’s ongoing refusal to facilitate the return of Kilmar Abrego Garcia from El Salvador as a threat to democracy (95%), with 55% rating this an extraordinary threat and another 30% rating the threat serious.5 We see similar consensus in assessments of the potential future transfer of American citizens to Salvadoran detention (97% threat, 78% extraordinary) and a potential dramatic increase in the federal government revoking citizenship for naturalized citizens in the future (96% threat, 53% extraordinary). A full 79% would regard a future program to reward citizens for information leading to deportations as a threat.
Experts see Trump’s moves against universities as nearly as threatening. A total of 92% of experts regard withholding federal funds to pressure Columbia and Harvard to change policies as a democratic threat; 82% see Columbia’s initial compliance as a threat and 93% regard the move to revoke Harvard’s tax-exempt status similarly.6 Eighty-six percent would see further funding cuts to Harvard in the future as threatening democracy, as would 91% if Harvard complied with the government’s demands.
Trump directing the Justice Department to investigate the Democratic Party’s principal fundraising platform, ActBlue, is also regarded by 89% of experts as a threat to democracy (53% extraordinary, 29% serious). This response might reflect the principles that law enforcement investigations should be free from political influence or interference and that government agencies should not be used to punish political opponents.
The only item that splits our expert respondents is the potential weakening or abolition of the Senate filibuster. One-third (33%) would regard this move toward majority rule as a threat to democracy, one-quarter (25%) as a benefit, and the rest as neither threat nor benefit (42%).
Assessing the likelihood of future events
Following our practice in past surveys, we asked experts and prediction platform forecasters to assign a probability to potential future events. In the latest iteration of our work comparing expert and forecasters, we collected contemporaneous forecasts from two forecasting platforms, Polymarket and Metaculus. The list of potential events below is separated by where prediction forecasts were collected.
Polymarket:
- Will U.S. citizens be transferred to El Salvador before July?
- Will Kilmar Abrego Garcia be released from custody before July?
- Will Harvard University publicly announce it will comply with any demands outlined in the Trump administration’s April 11 letter before June?
- Will Trump announce additional funding cuts to Harvard before June?
- Will Judge Boasberg formally hold any official agency or representative of the Trump administration in contempt of court before May?
Metaculus:7
- Will the U.S. establish a government program rewarding information leading to deportations before January 3, 2027?
- Will a federal judge be impeached by Republican Representatives in a partisan vote before January 3, 2027?
- Will the U.S. Senate weaken or eliminate the filibuster before January 3, 2029?
- How many journalists in the U.S. will face criminal charges related to their work before 2027?
On whether journalists will face criminal charges , respondents were asked to forecast a specific number in the range 0–200. On all previous items, they were asked to provide a likelihood estimate ranging from 0–100%.
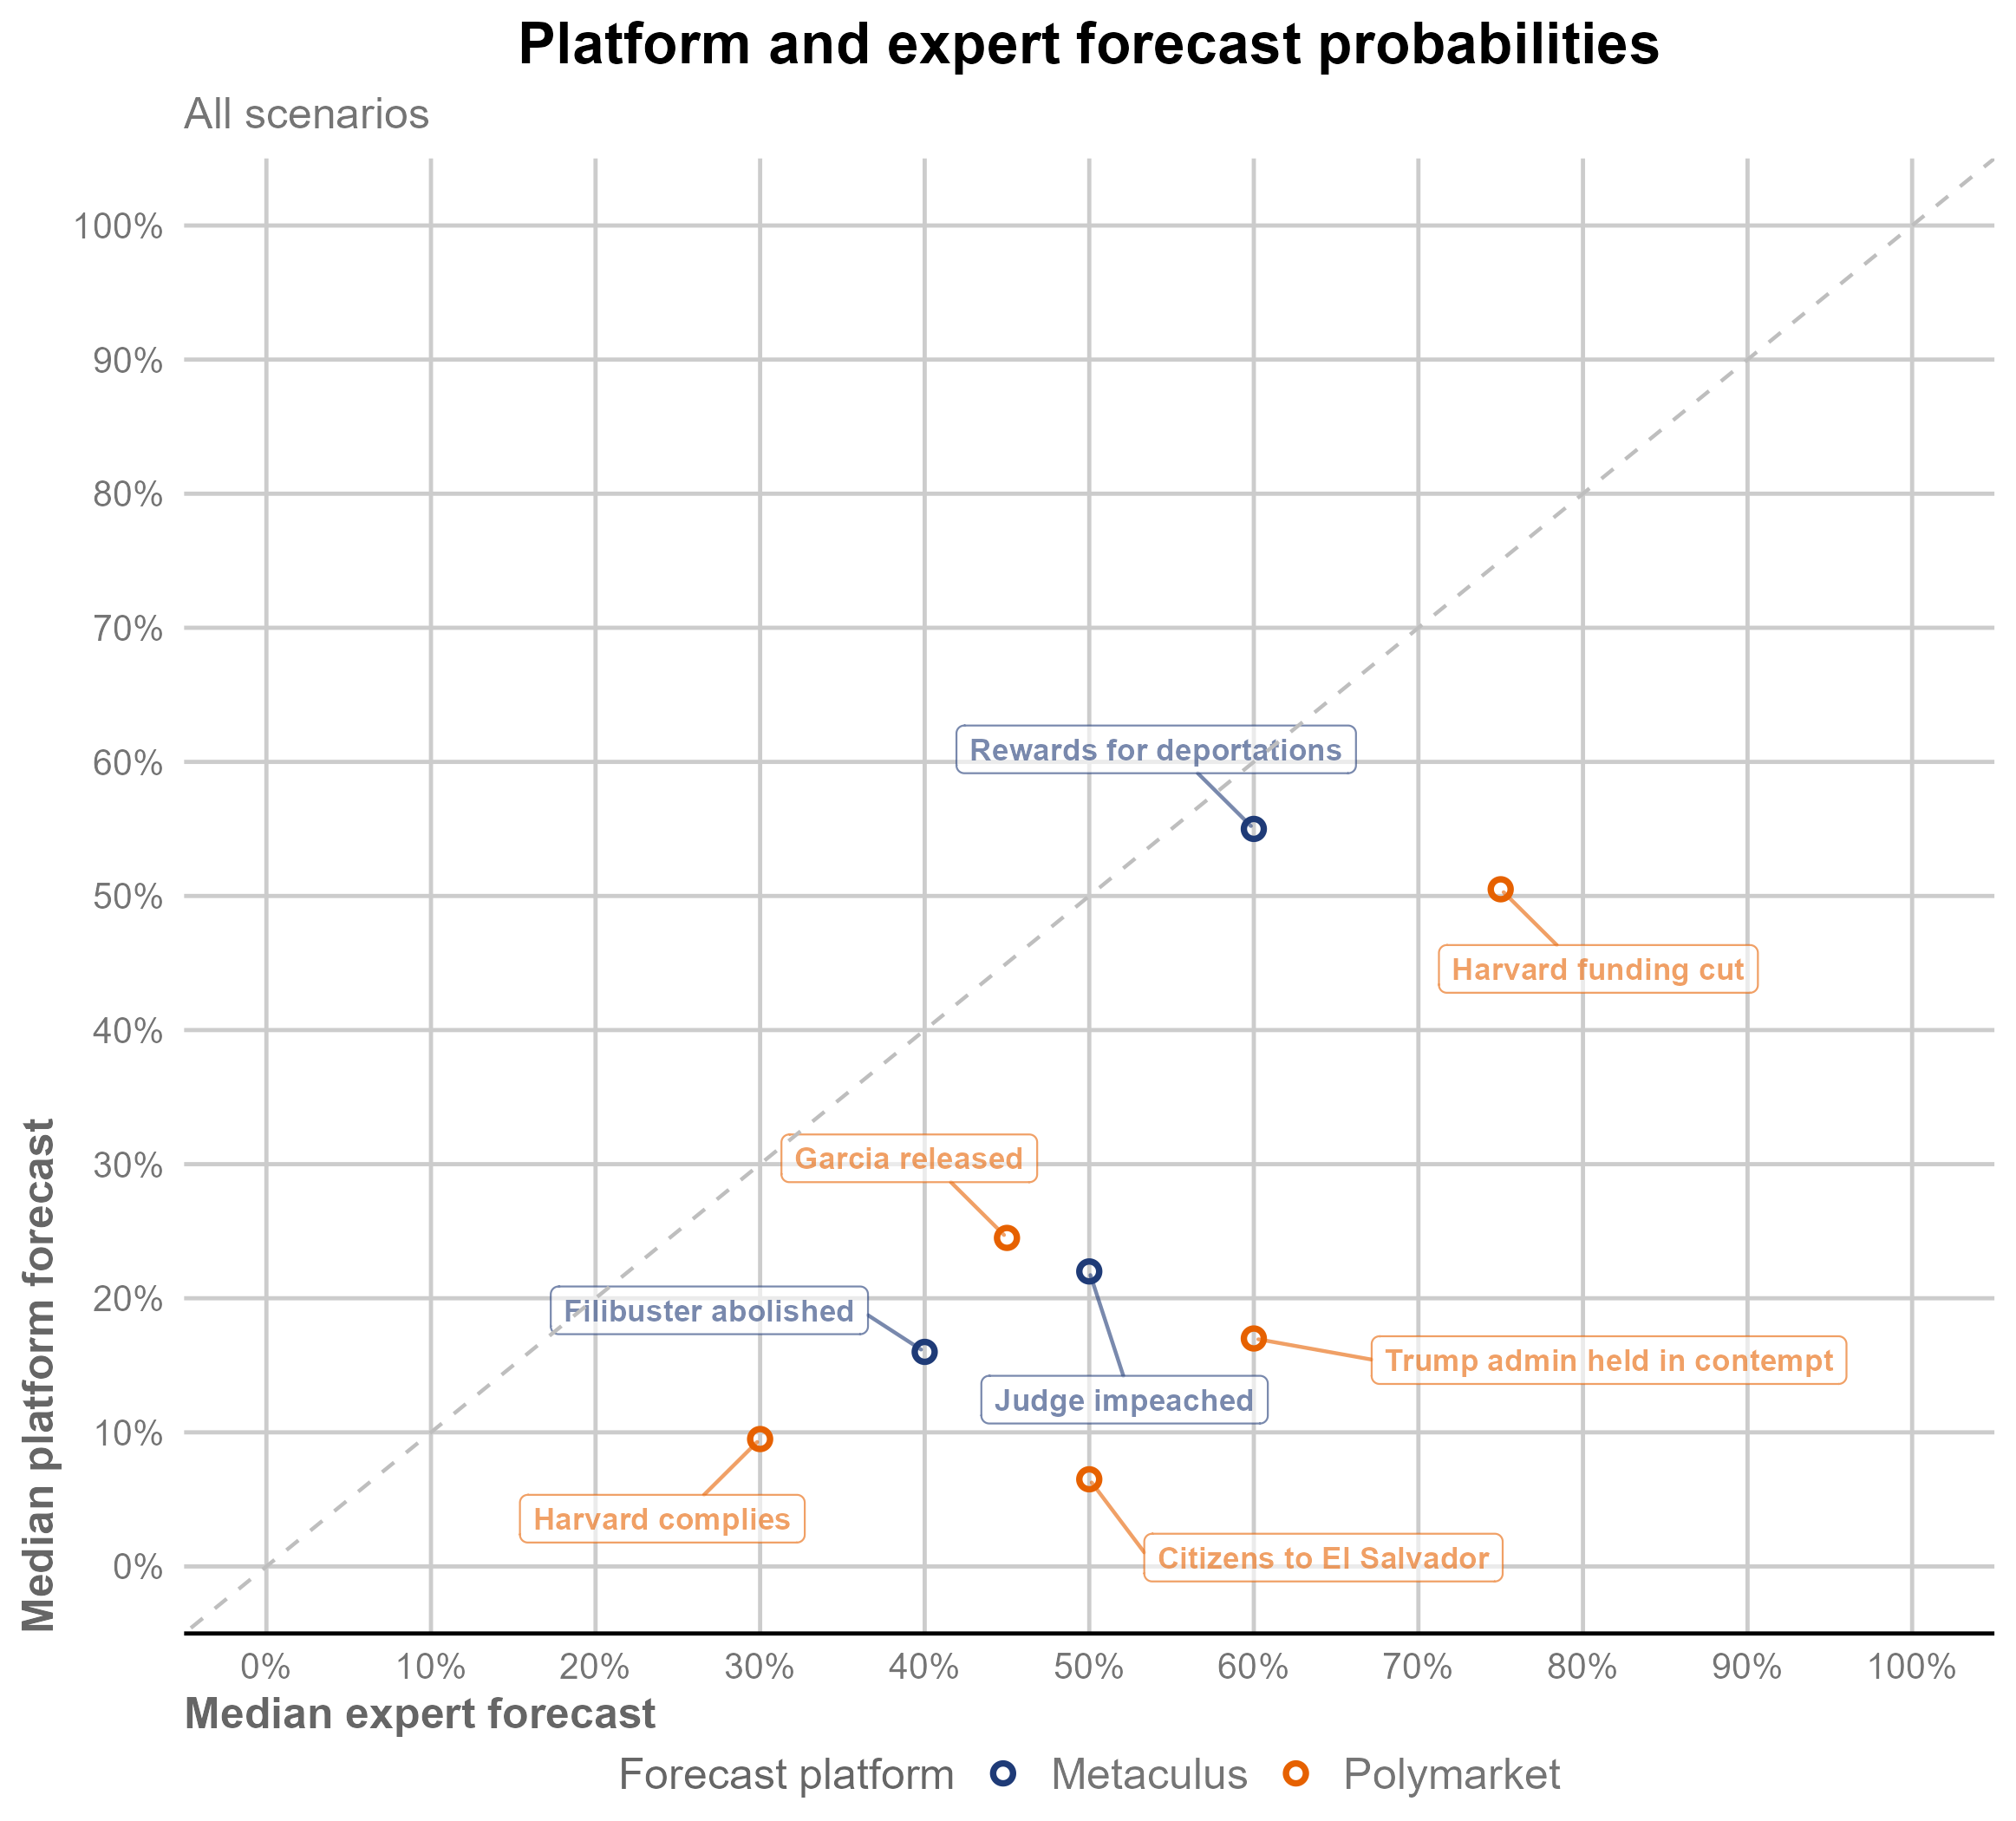
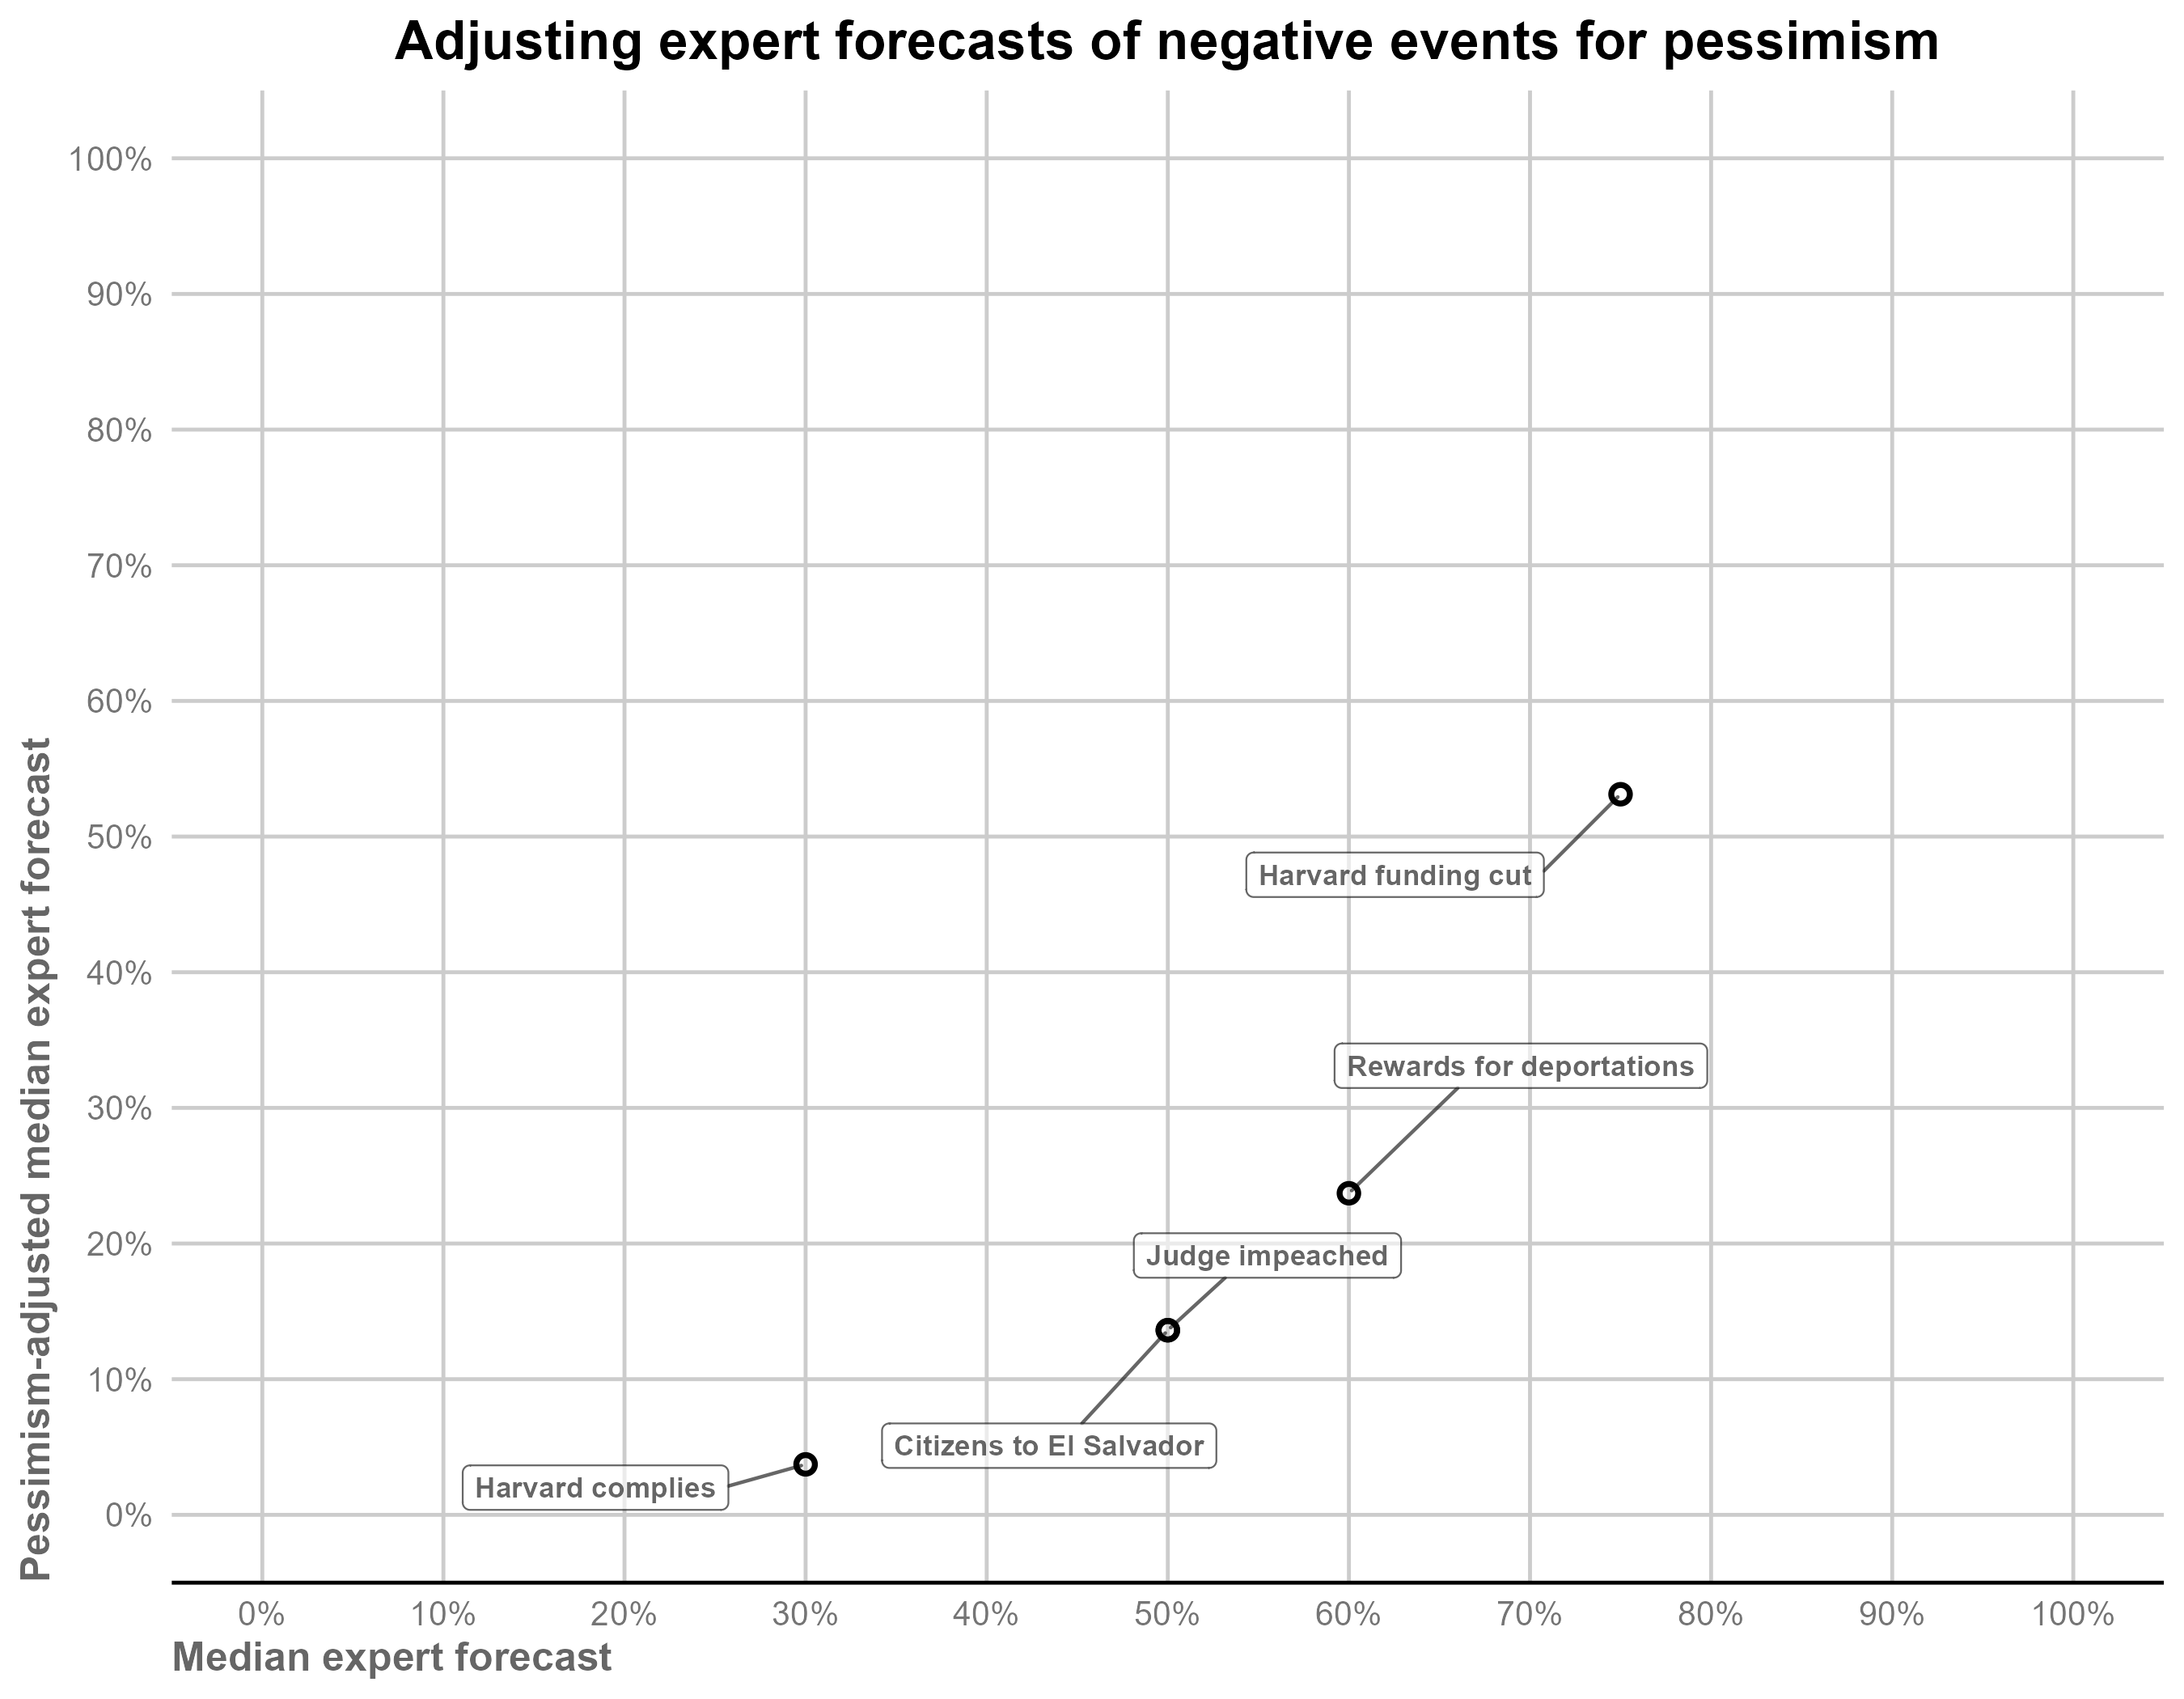
The figure below juxtaposes expert forecasts of the probabilities of these potential future events with their estimated probabilities on Metaculus and Polymarket. As the figure suggests, experts rated the probability of every event higher than did forecasters on the platforms, including the U.S. sending citizens to prison in El Salvador (50% experts, 14% forecasters) and the Trump administration being held in contempt by Judge James Boasberg (60% experts, 17% forecasters). Expectations are most similar for whether the U.S. will establish a government program rewarding information leading to deportations (60% experts, 55% forecasters).
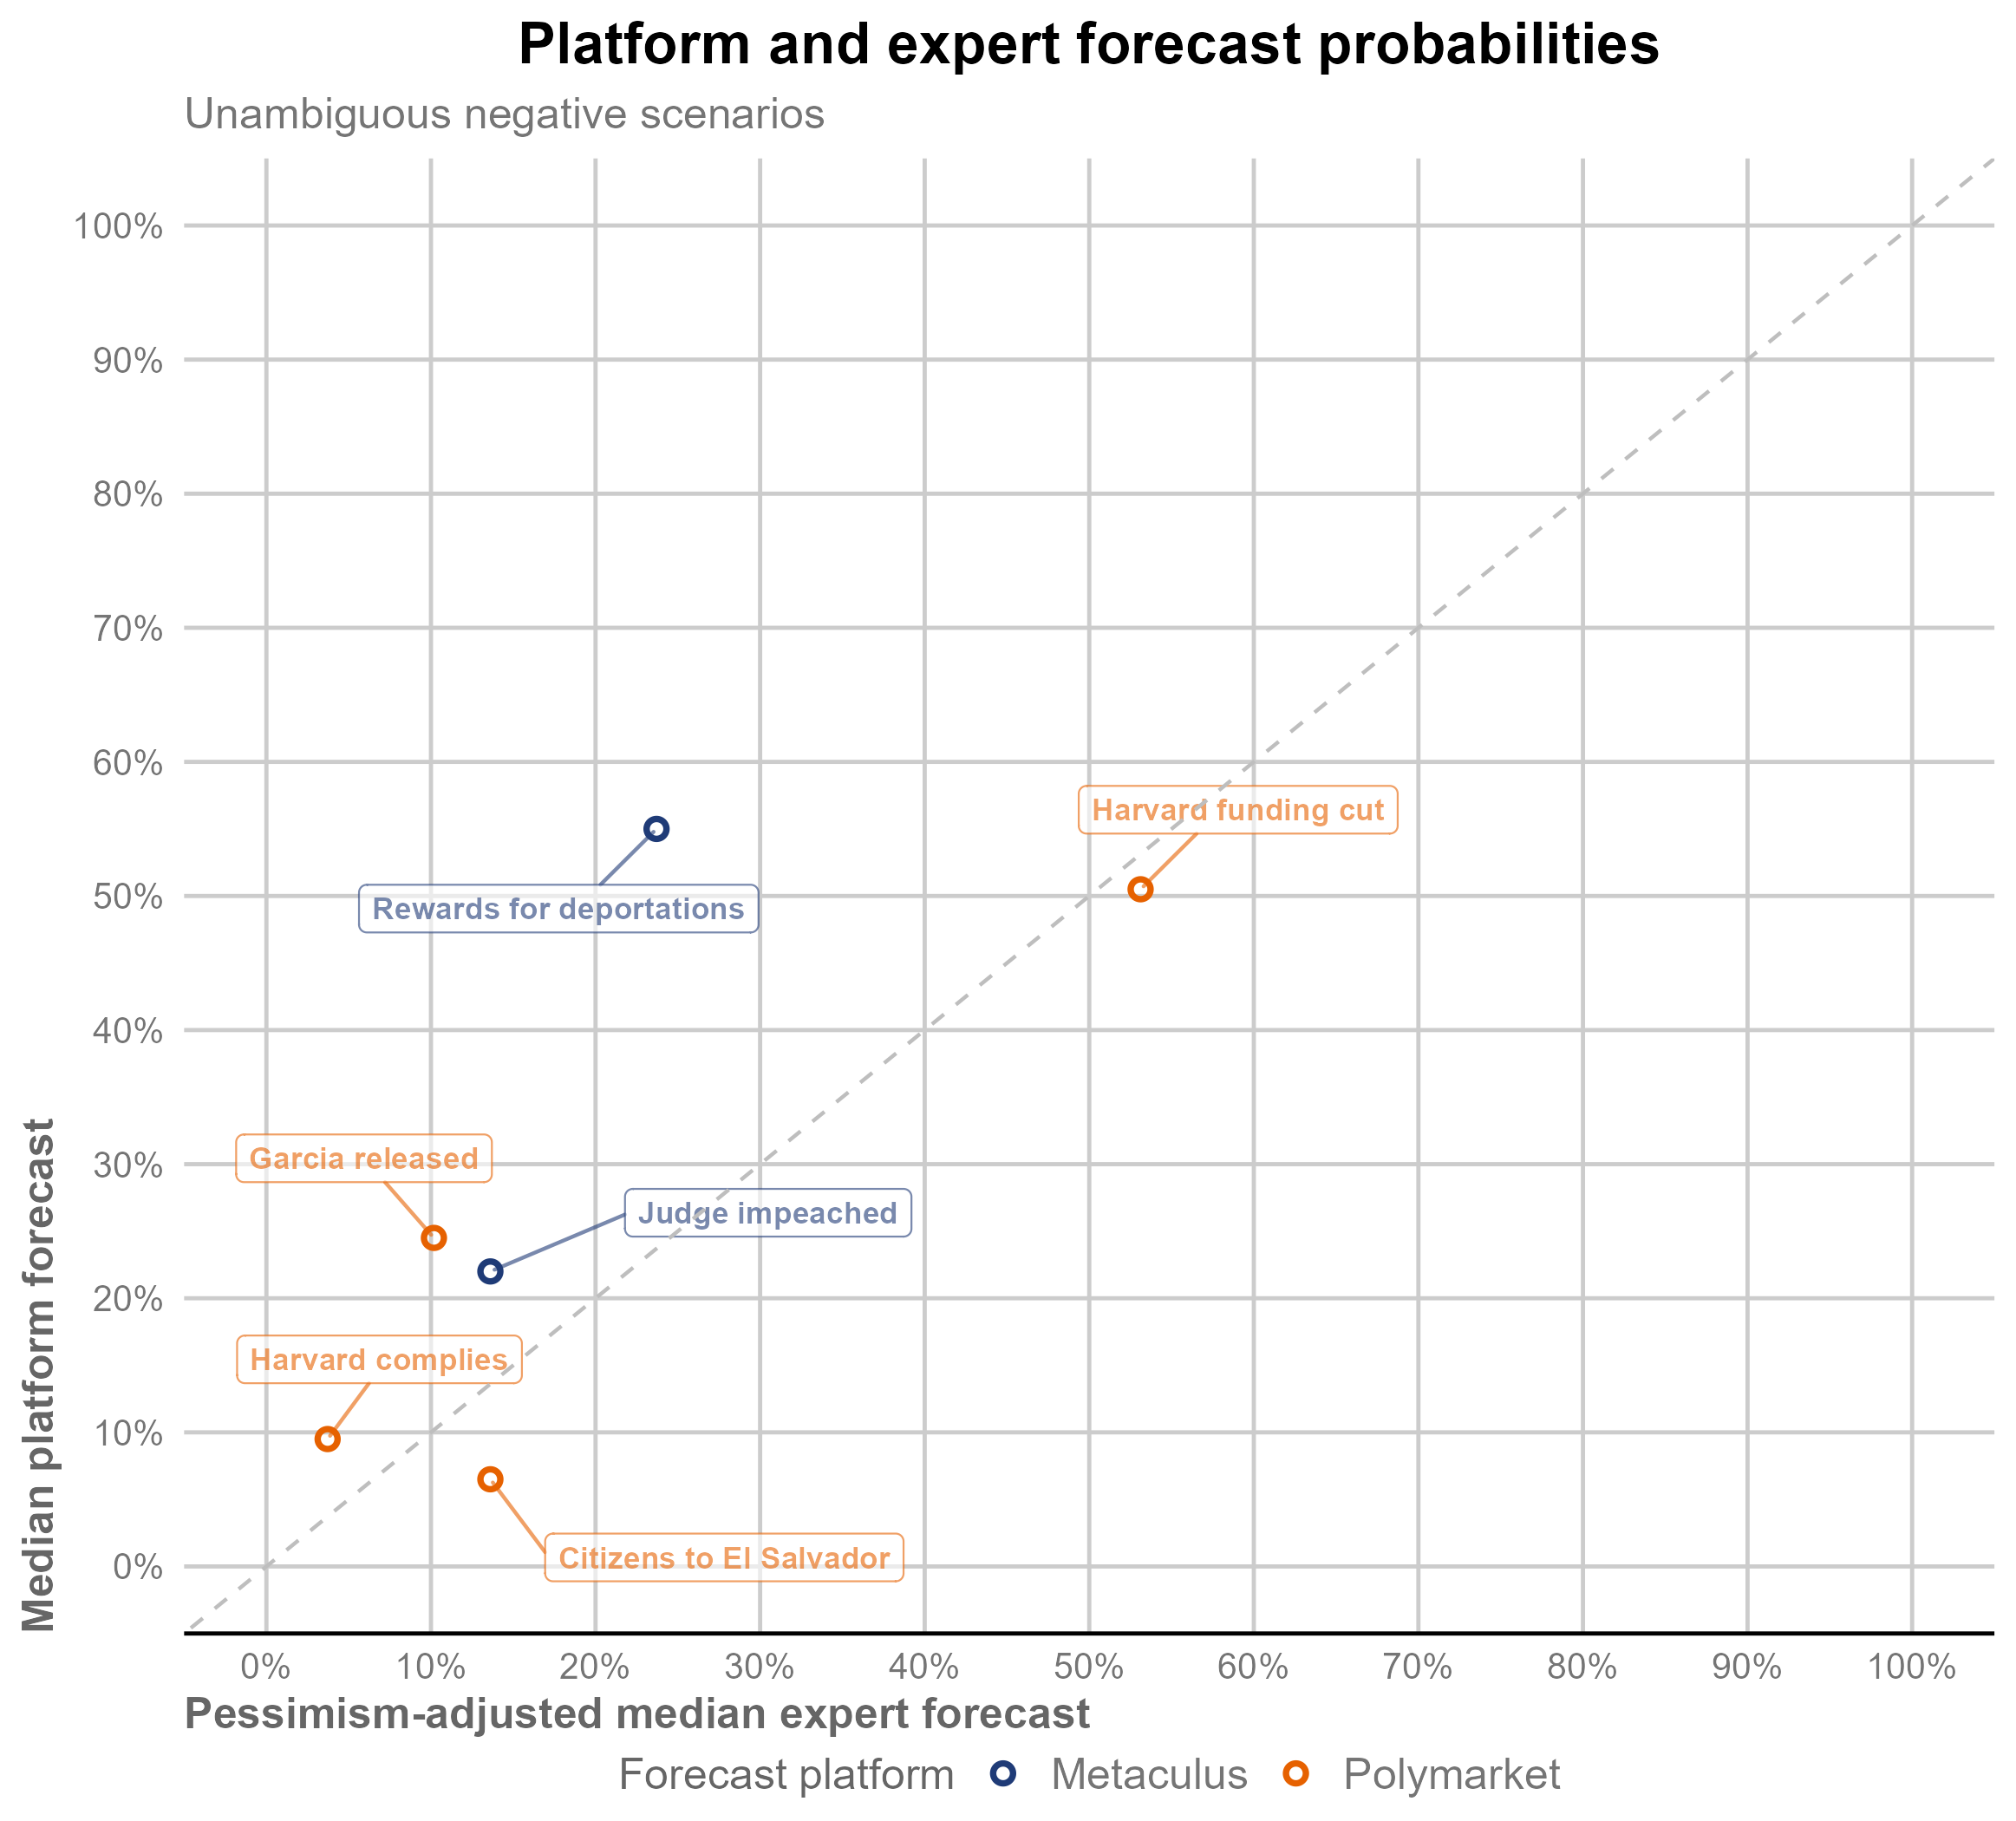
These findings are broadly consistent with our previous finding that political science experts tend to overestimate the probability of events that are negative for democracy relative to their actual frequency. We therefore follow the practice from our previous report and apply the adjustment for pessimism bias that we developed with Andrew Little in the figure below. This correction narrows the gap between experts and prediction platform forecasters considerably with the exception of the deportation rewards question, where the expert-adjusted forecast is now considerably more skeptical than prediction platform forecasters.
Finally, we also asked experts and prediction platform forecasters on Metaculus to predict the number of journalists who will face criminal charges related to their work before 2027. Experts were more optimistic than the Metaculus forecasters, with a median prediction of 29 to Metaculus’s 53. (According to U.S. Press Freedom Tracker, 45 journalists faced criminal charges from 2023–2024.)
Expert perspectives on academic freedom
The next sections report on survey results exclusively from our sample of experts, all of whom are or were faculty in political science at American universities.8 Bright Line Watch seeks to translate scholarly expertise on democracy into public discourse. Accordingly, we do not survey academic experts about their personal political attitudes.
Much of the current survey focuses on threats to academic freedom, which we regard as a core pillar of liberal democracy and, therefore, as central to Bright Line Watch’s mission. Academic freedom is also a topic where the personal experience of our faculty experts is salient. For this reason, this particular survey wave included questions about the experts’ own perceptions and experiences with academic freedom. We prefaced this section of the survey by establishing for survey respondents what we mean by the term using a definition from a previous faculty poll conducted by the American Association of Colleges and Universities and the American Association of University Professors:
Academic freedom is the freedom of teachers or researchers in higher education to investigate and discuss the issues in their academic field, and to teach or publish findings without interference from political figures, boards of trustees, donors, or other entities. Academic freedom also protects the right of faculty members to speak freely when participating in institutional governance, as well as to speak freely as a citizen.
Note that our survey is limited to a single discipline. The perceptions and experiences of faculty in fields other than political science could of course differ.
Antisemitism and DEI: How big are the problems and how effective are campus policies?
Recent, high-profile initiatives from the Trump administration have withheld federal research funds and threatened other financial sanctions against universities unless the institutions commit to compliance with lists of administration demands. The principal stated rationale for these demands is the charge that academic and administrative practices at these schools foster antisemitism and have failed to protect Jewish students from the effects of that antisemitism.9 We therefore sought to assess the degree to which faculty respondents regard antisemitism as a problem at the institutions where they work and their perceptions of the policies their universities had in place to address antisemitism before the Trump administration began its current pressure campaign.
Using wording adapted from a recent survey conducted by the American Jewish Committee, we asked the experts, “How much of a problem, if at all, do you think antisemitism, that is hostility or prejudice toward Jewish people, was at your institution as of January 2025?” We also asked the experts about the effectiveness of the policies in place at their institutions as of January 2025 at protecting members of the campus community from antisemitism.
The Trump administration is also pressuring universities to change their policies related to diversity, equity, and inclusion (DEI). The administration demanded the termination of all programs that recognize participants by race, and the shuttering of DEI offices and initiatives – changes that greatly exceed the scope of the Supreme Court’s 2023 prohibition of explicit consideration of race in undergraduate admissions.
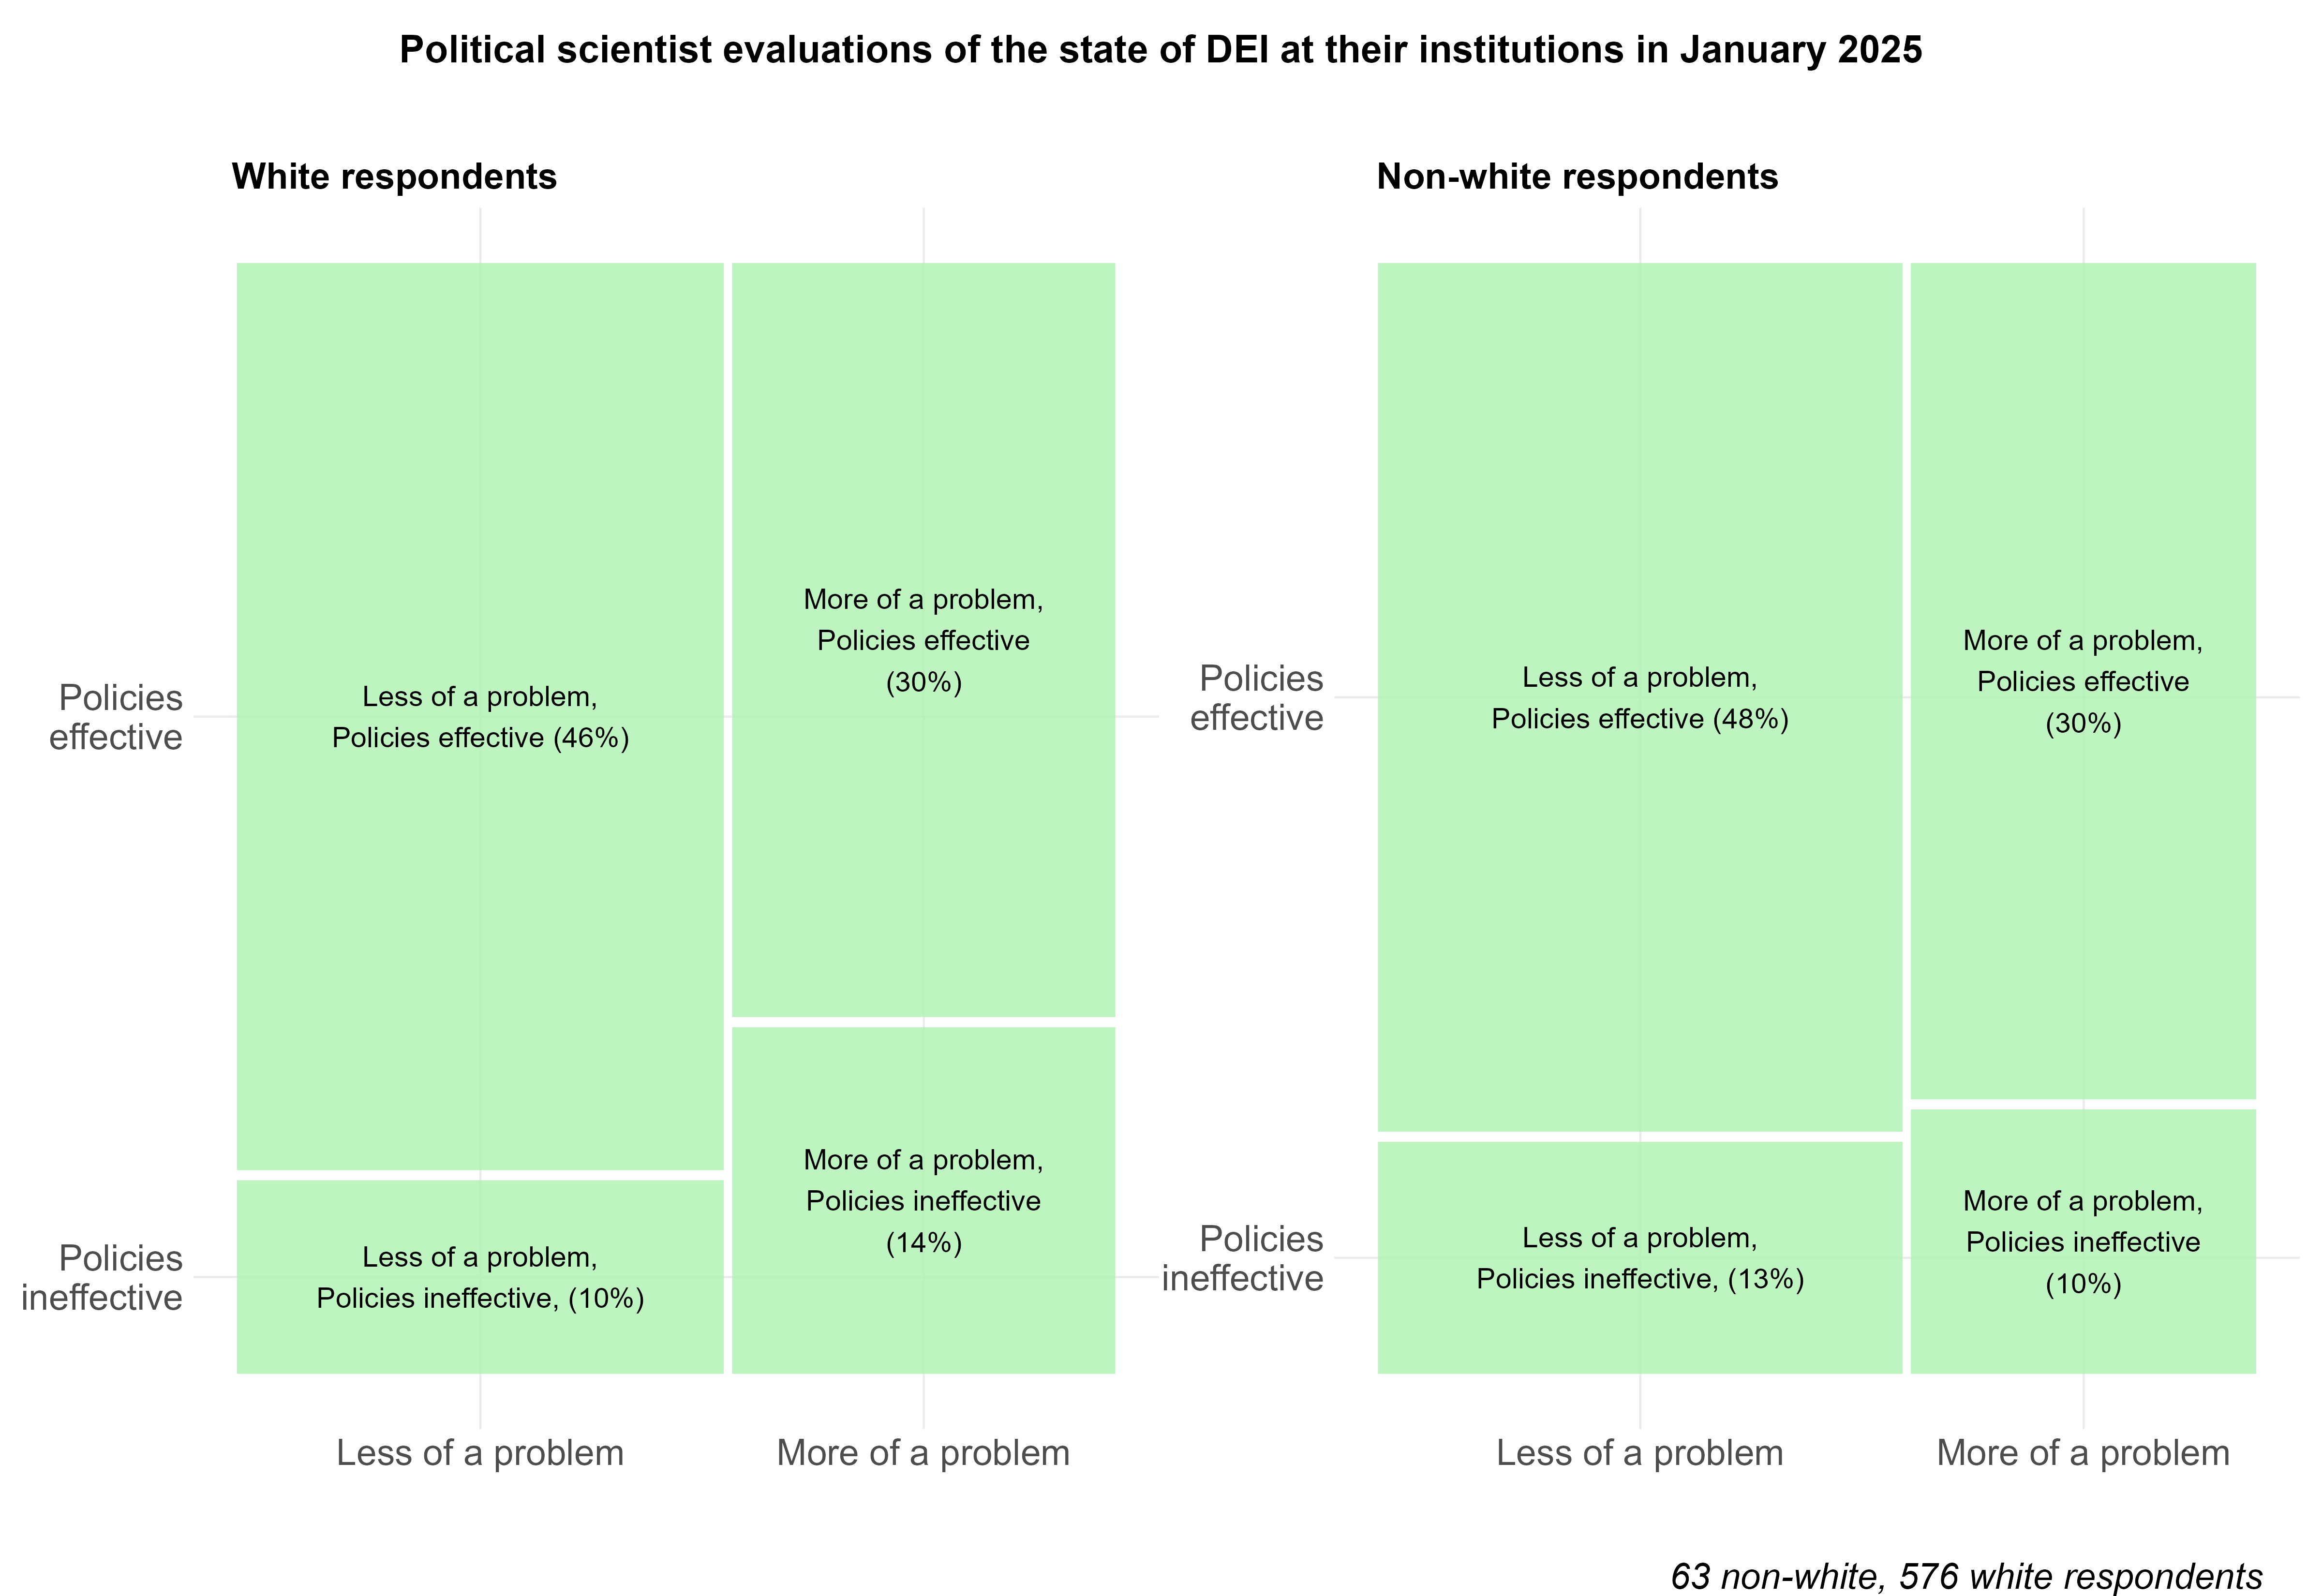
We again first sought to measure the degree to which our faculty respondents regard racial exclusion/inclusion to be a problem at their universities (“How much of a problem, if at all, do you think the state of racial and ethnic diversity and inclusion was at your institution as of January 2025?”) and then asked them to assess the policies their schools had in place before the Trump administration took office (“How effective were the policies in place at your institution as of January 2025 at promoting racial and ethnic diversity and inclusion on campus?”). The figure below summarizes responses from our faculty experts to all four of the questions described above. In each case, we sorted responses into binary categories:10
- Less a problem (not a problem or not much of a problem) versus more of a problem (somewhat of a problem or a very serious problem); and
- Policies were ineffective (not at all or not very effective) or policies were effective (somewhat or very effective).
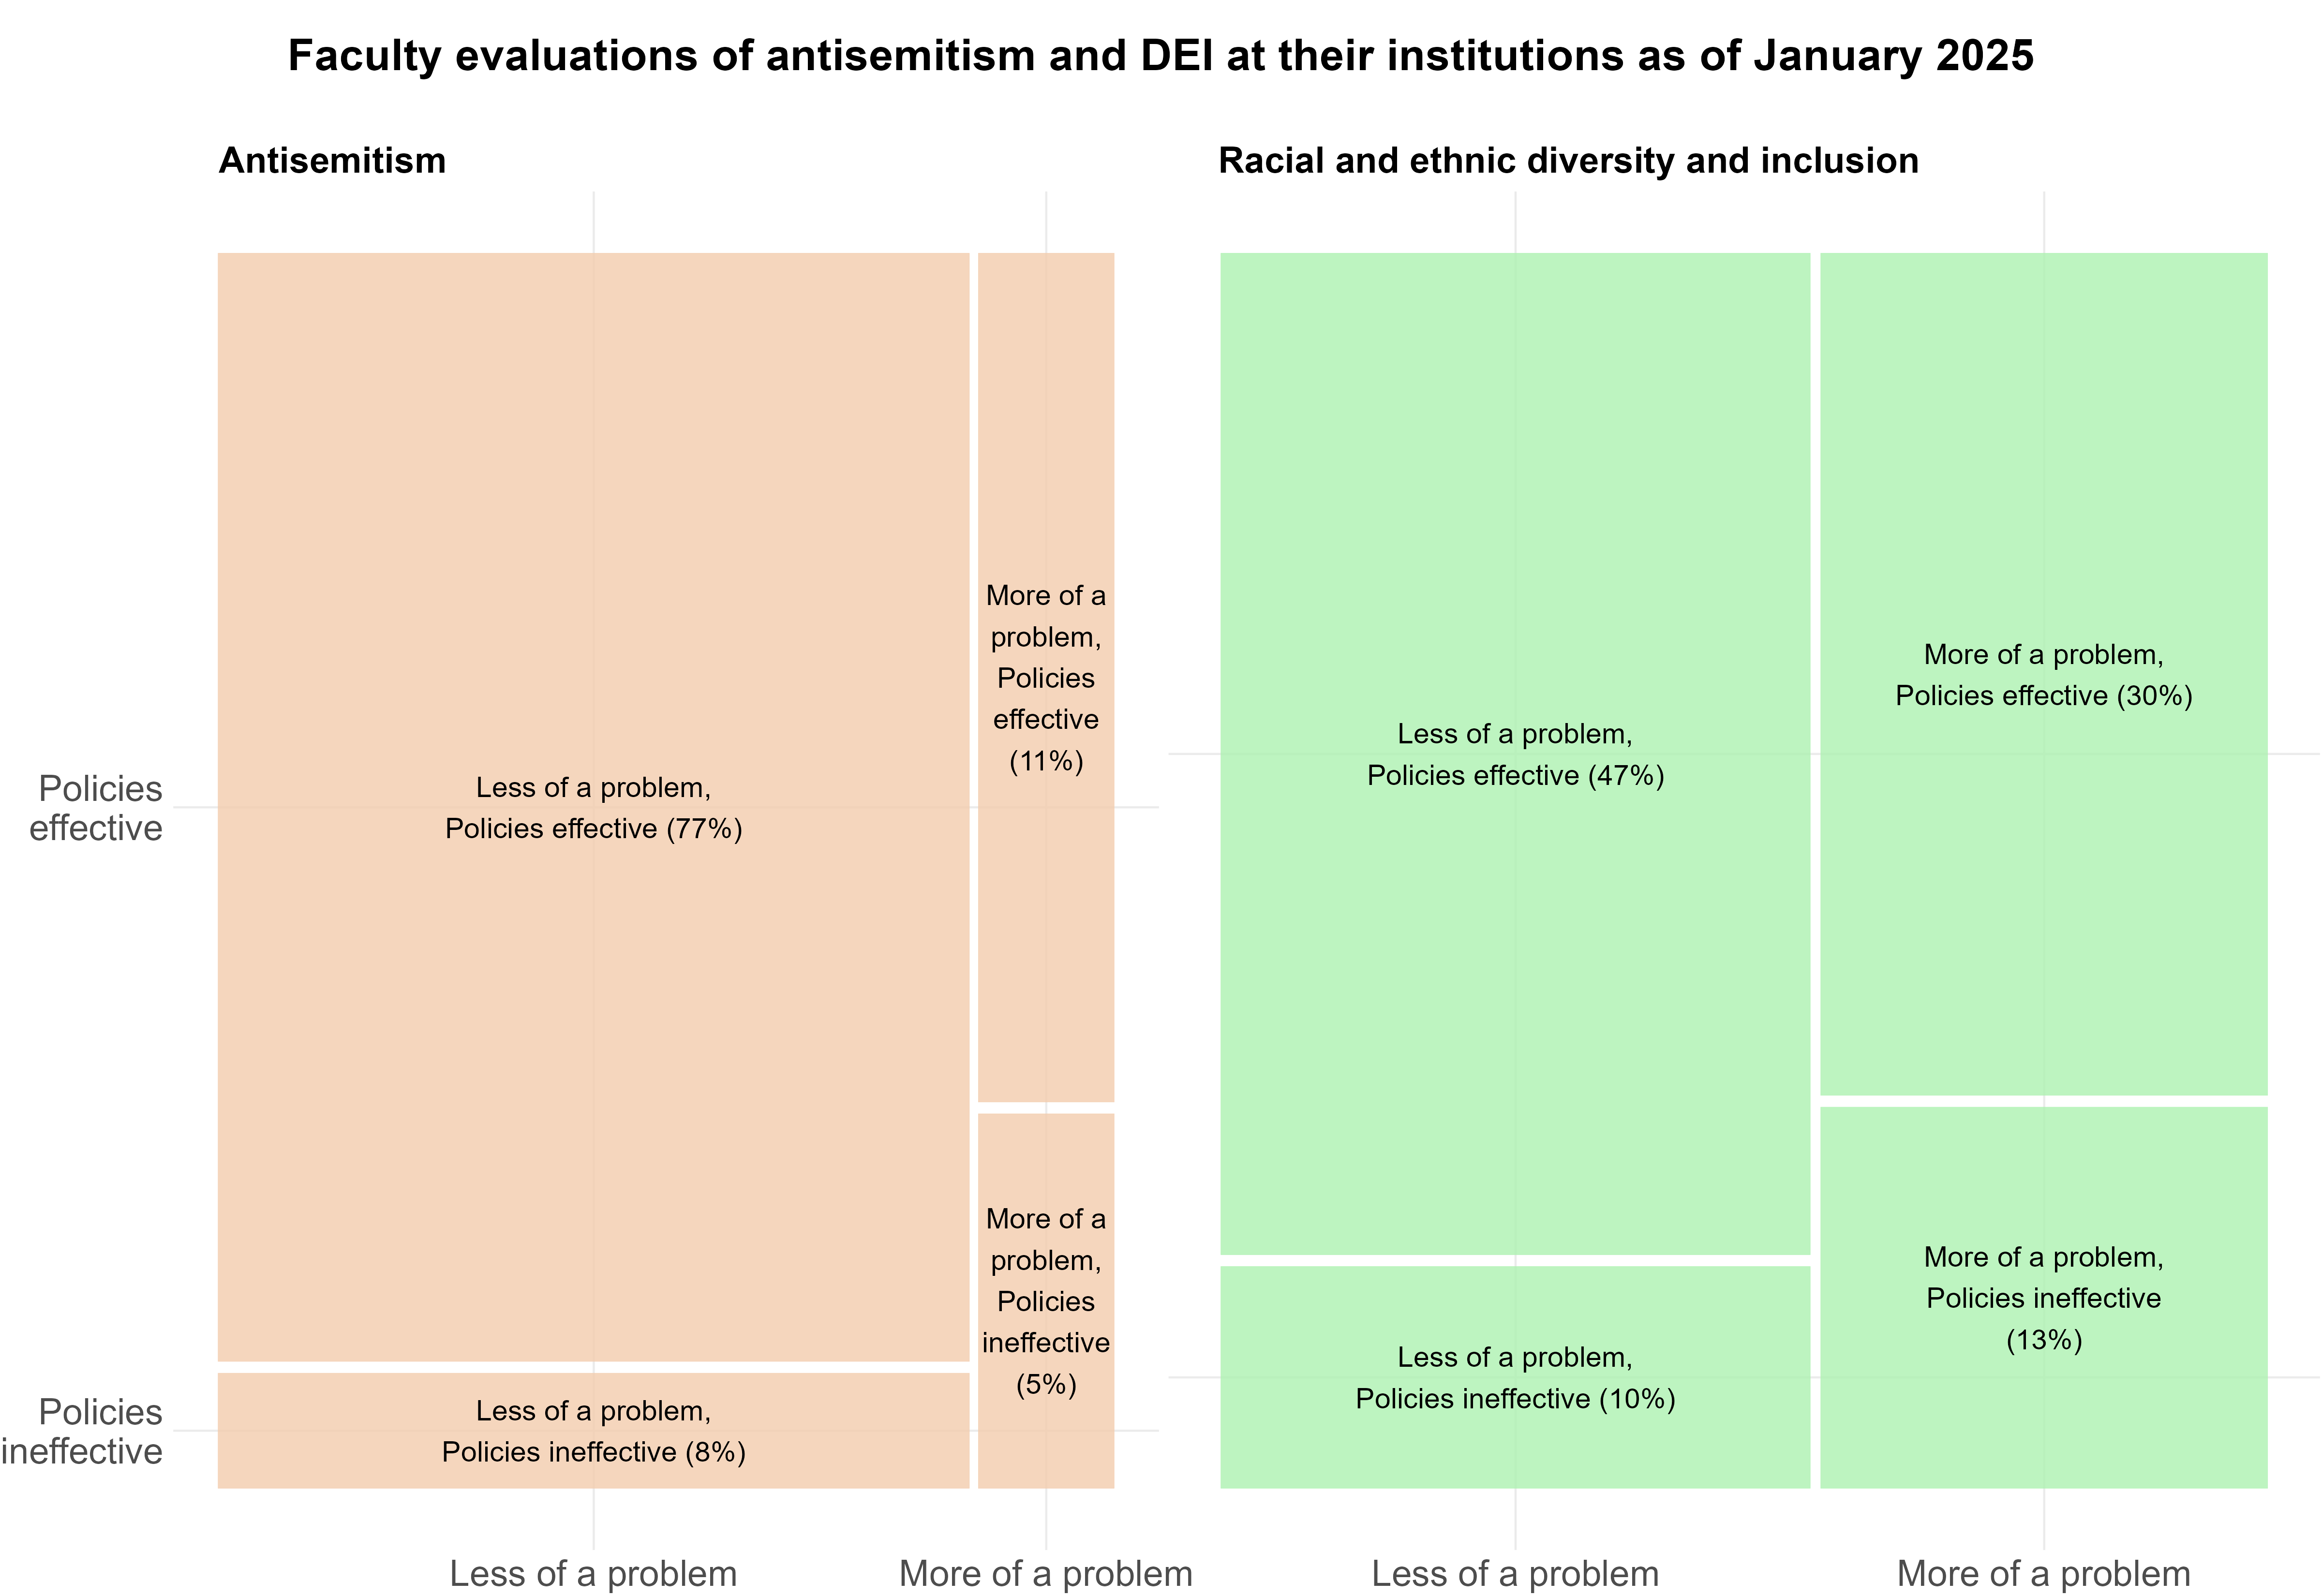
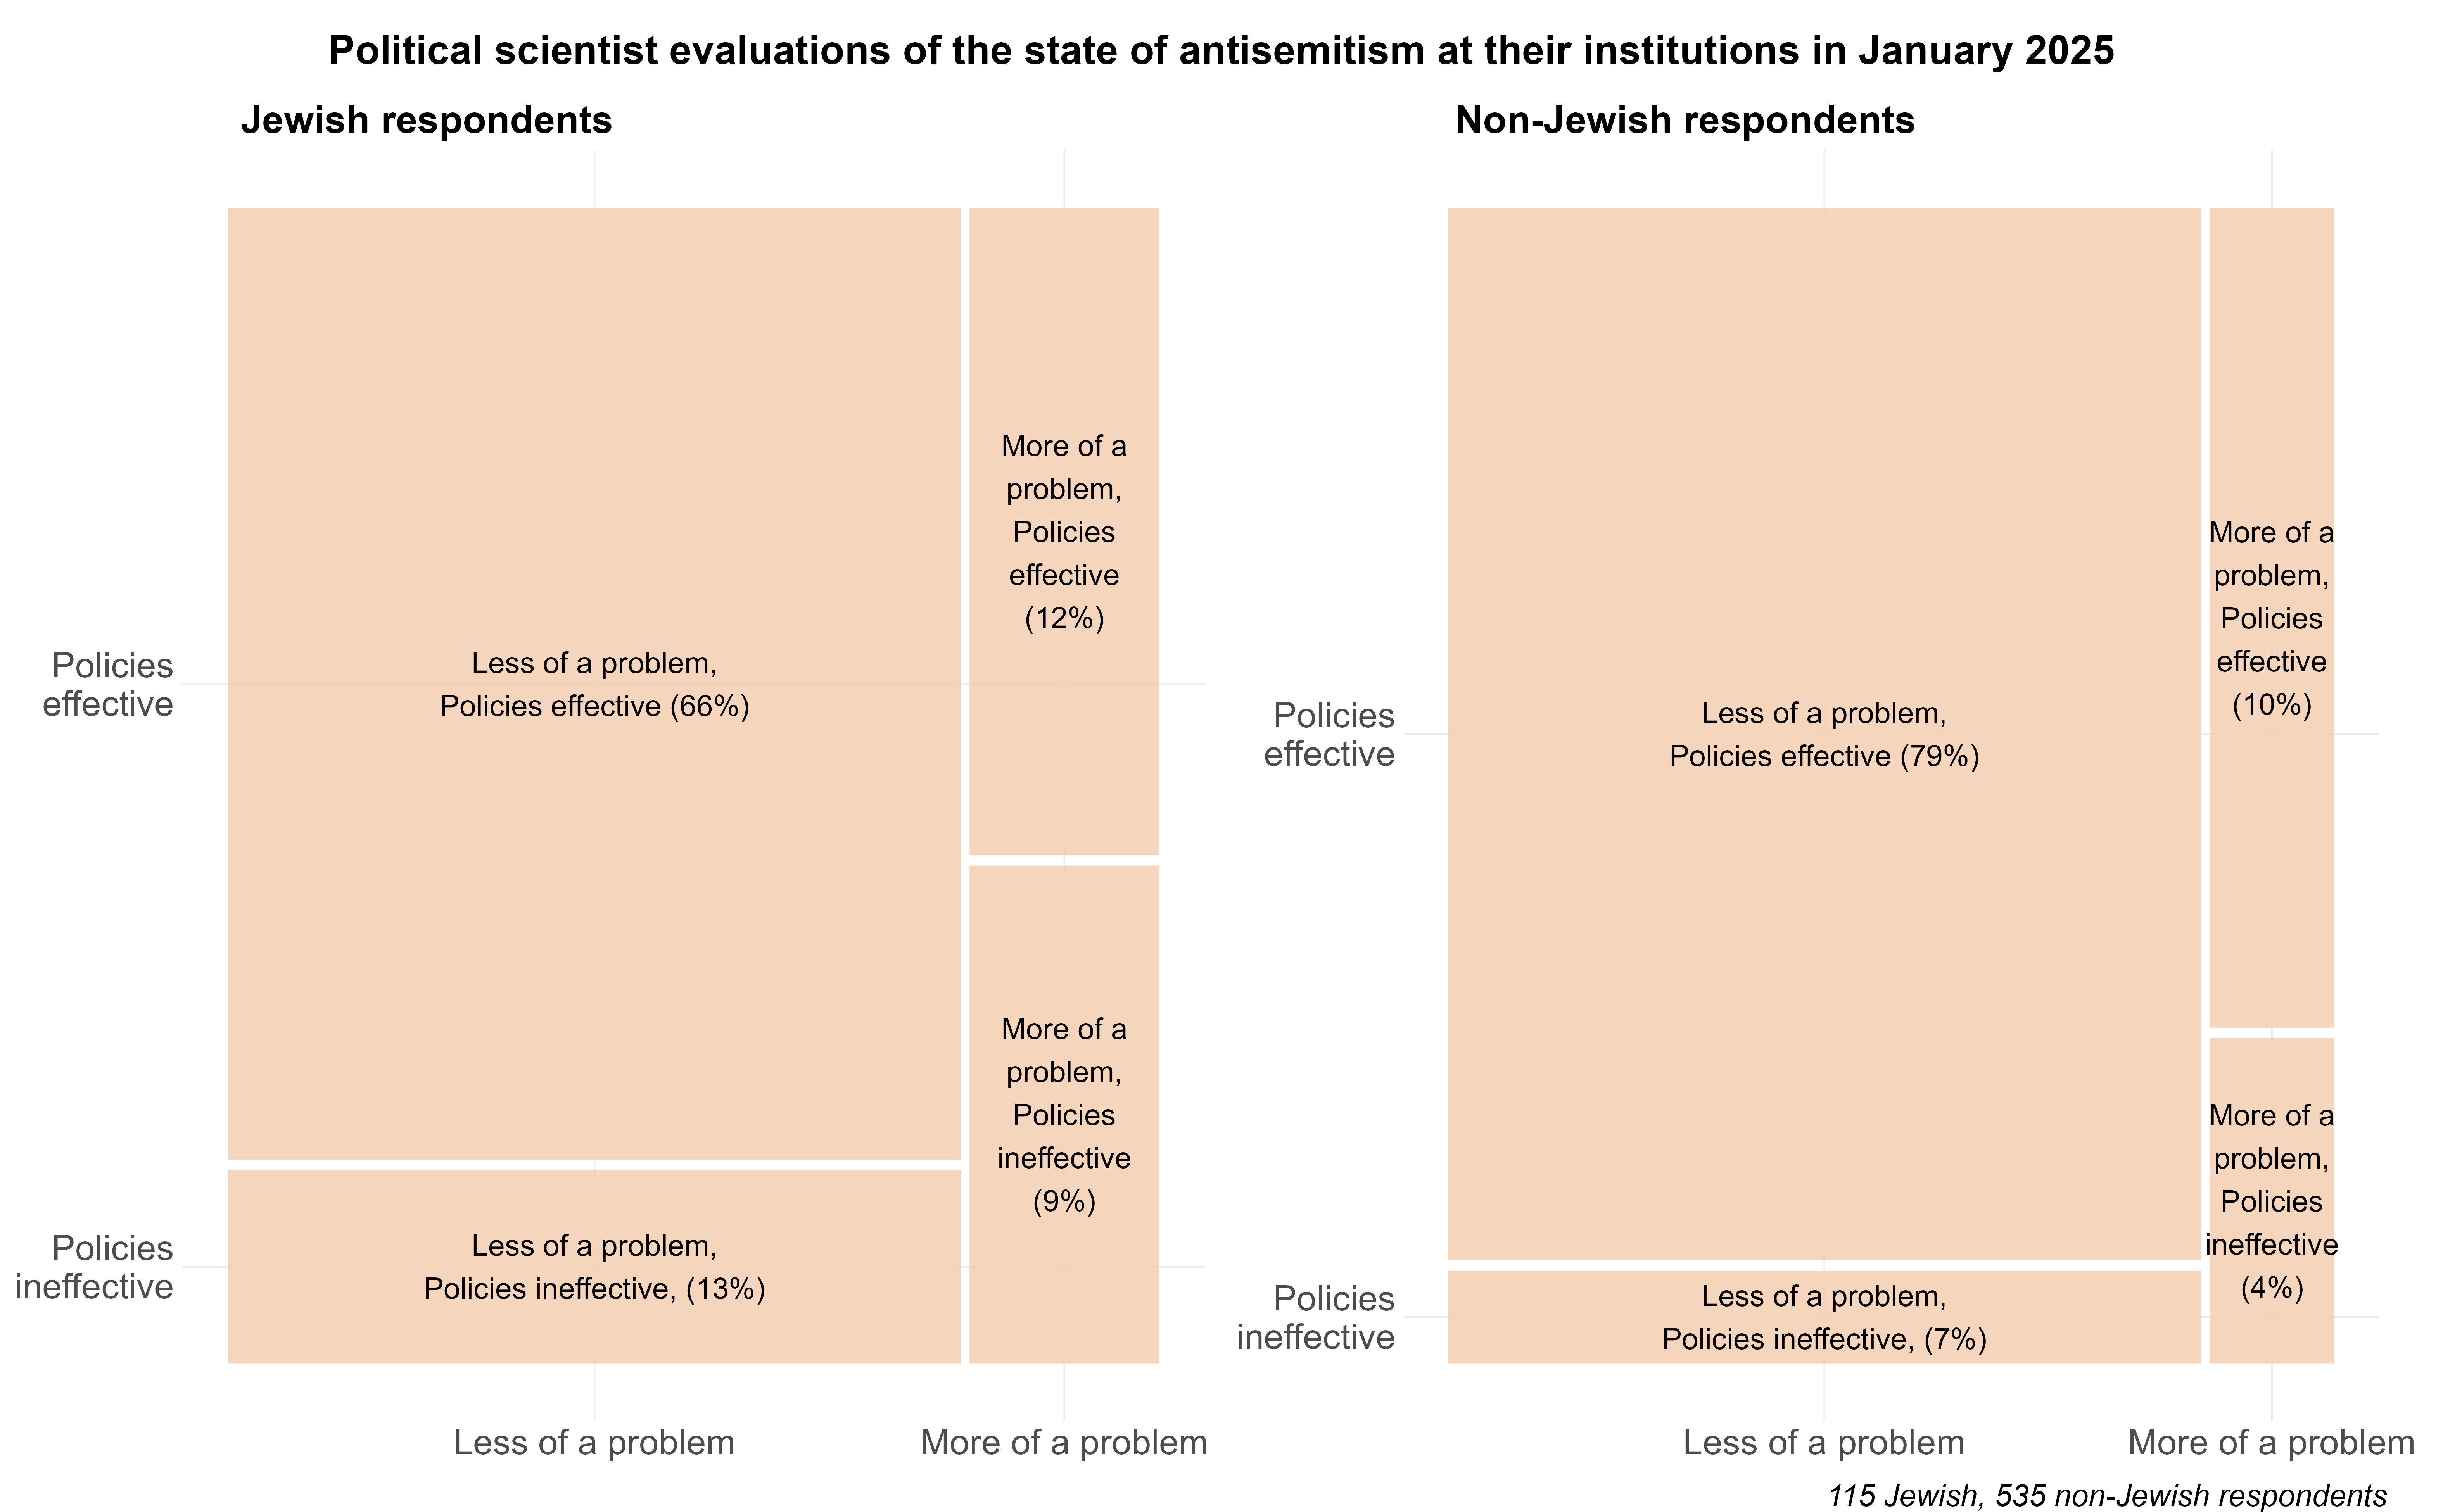
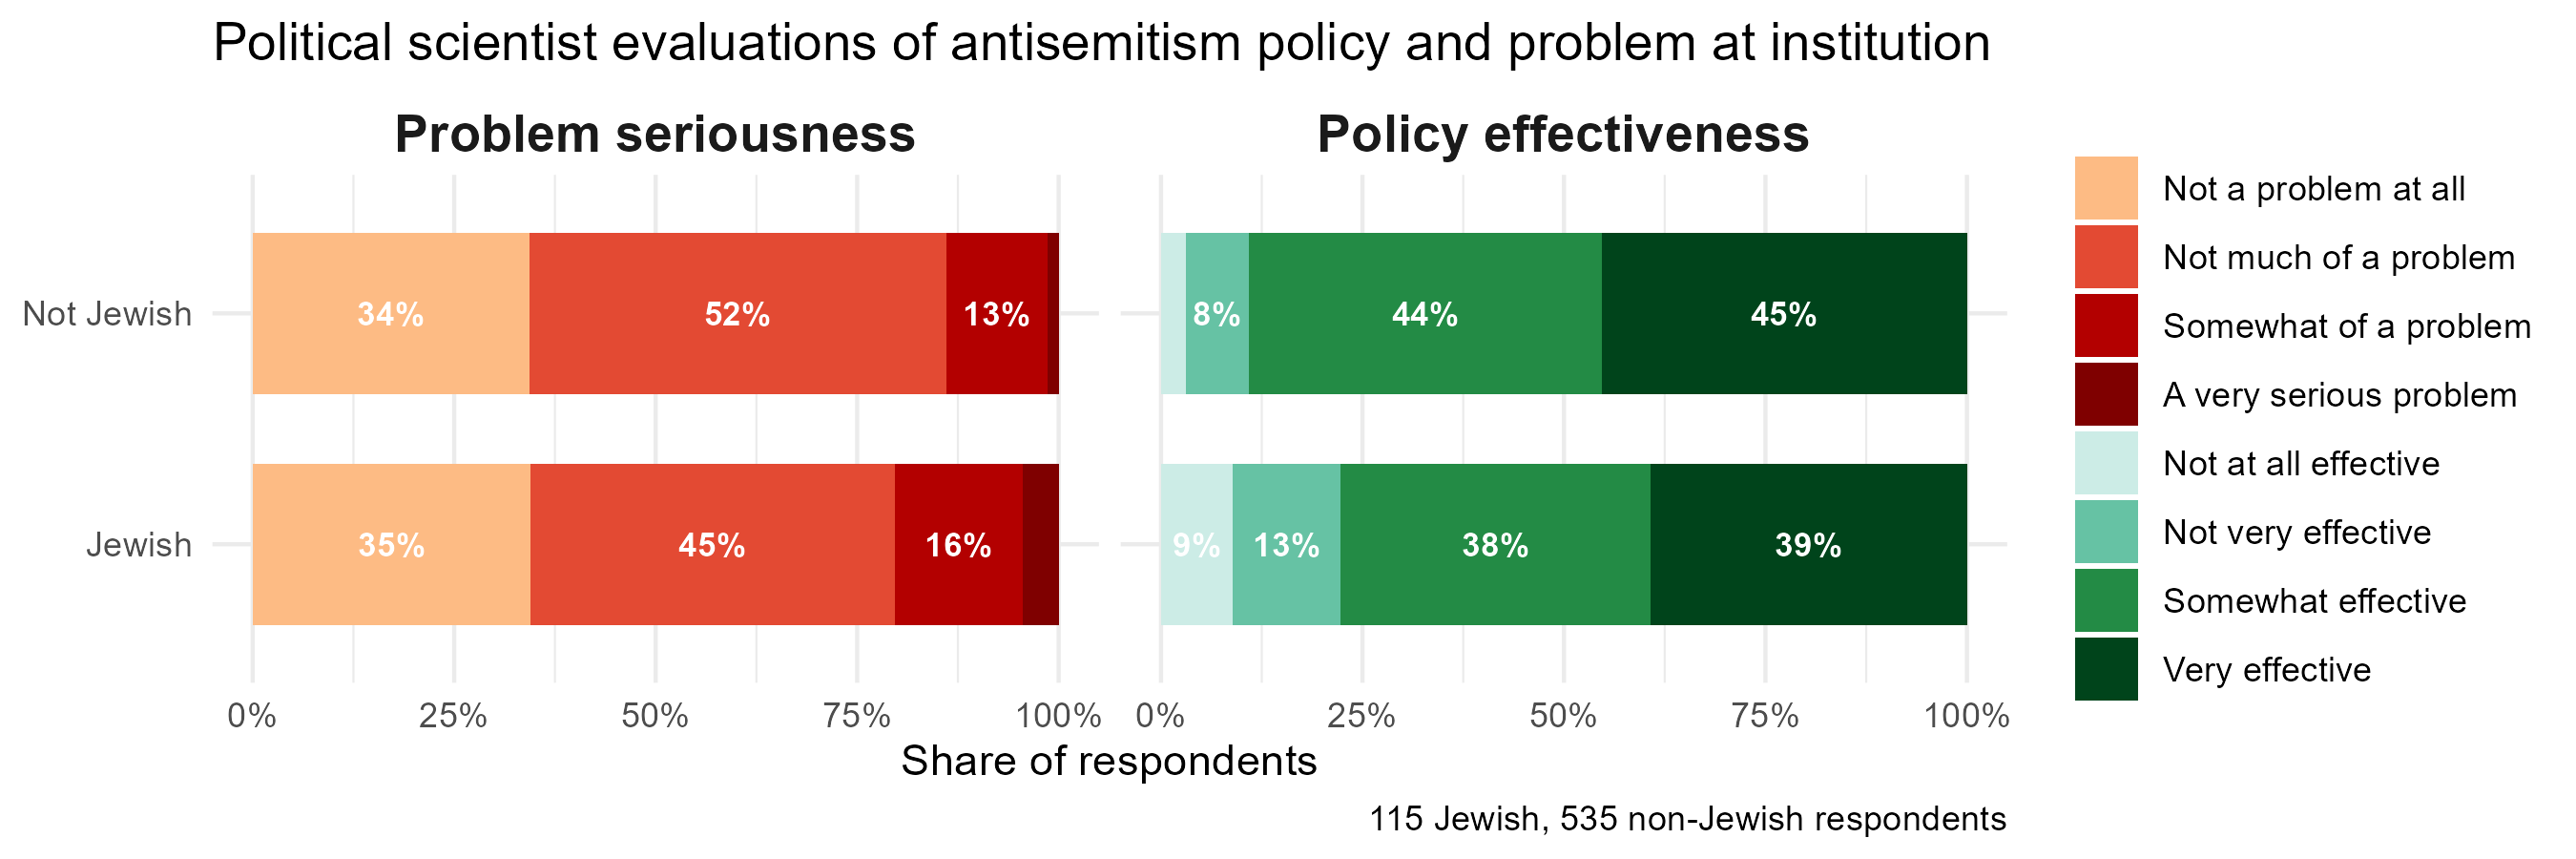
The left side of the figure shows responses related to antisemitism. Looking back to January of this year, most political science faculty (77%) say antisemitism on their campus was not much of a problem in January 2025 and said it was being effectively addressed by policies that were in place. Another 11% say antisemitism was a problem on their campus but that pre-Trump policies were effective in protecting the campus community from its effects. Eight percent regard those campus policies as ineffective but do not view pre-Trump campus antisemitism as a problem. Only 5% of faculty respondents regard campus antisemitism as somewhat of a problem or a serious problem and say that it was not being effectively addressed by policies in place in January.
Faculty who identify as Jewish express higher levels of concern about campus antisemitism in January 2025 than did non-Jewish faculty but large majorities of both groups held that antisemitism on campus was a limited problem that was effectively addressed by policies in place at the time. Jewish faculty are more likely to regard antisemitism as somewhat of a problem (16%) or a very serious problem (4%) on their campus pre-Trump than were non-Jewish faculty (13% and 1%, respectively), but a large majority of Jewish survey respondents say antisemitism was not a problem (35%) or not much of a problem (45%) on their campus. Similarly, Jewish faculty are marginally less optimistic than were non-Jewish faculty about the effectiveness of campus policies in place as of January 2025 in protecting the campus community from antisemitism, with 39% rating them very effective (compared with 45%) and 38% somewhat effective (versus 44%), as opposed to 13% regarding them as not very effective (versus 8%) and 9% not at all effective (versus 3%). The appendix includes separate versions of the figure above for Jewish and non-Jewish faculty as well as the full distributions of responses from each group.11
The right side of the figure shows faculty responses about racial and ethnic diversity and inclusion at respondents’ institutions. Faculty are more divided on this issue. In total, 47% say that diversity and inclusion was not much of or not at all a problem in January 2025 and view the diversity-related policies that were in place at the time as effective at promoting diversity and inclusion. Another 30% regard diversity and inclusion as more of a problem on their campus (i.e., somewhat of a problem or a serious problem) but view existing policies as effective. Faculty respondents who regard diversity and inclusion policies as ineffective are split between those who see diversity and inclusion in January 2025 as less of a problem (10%) and those who regard it as a more serious problem that was not being effectively addressed by existing policies (13%).
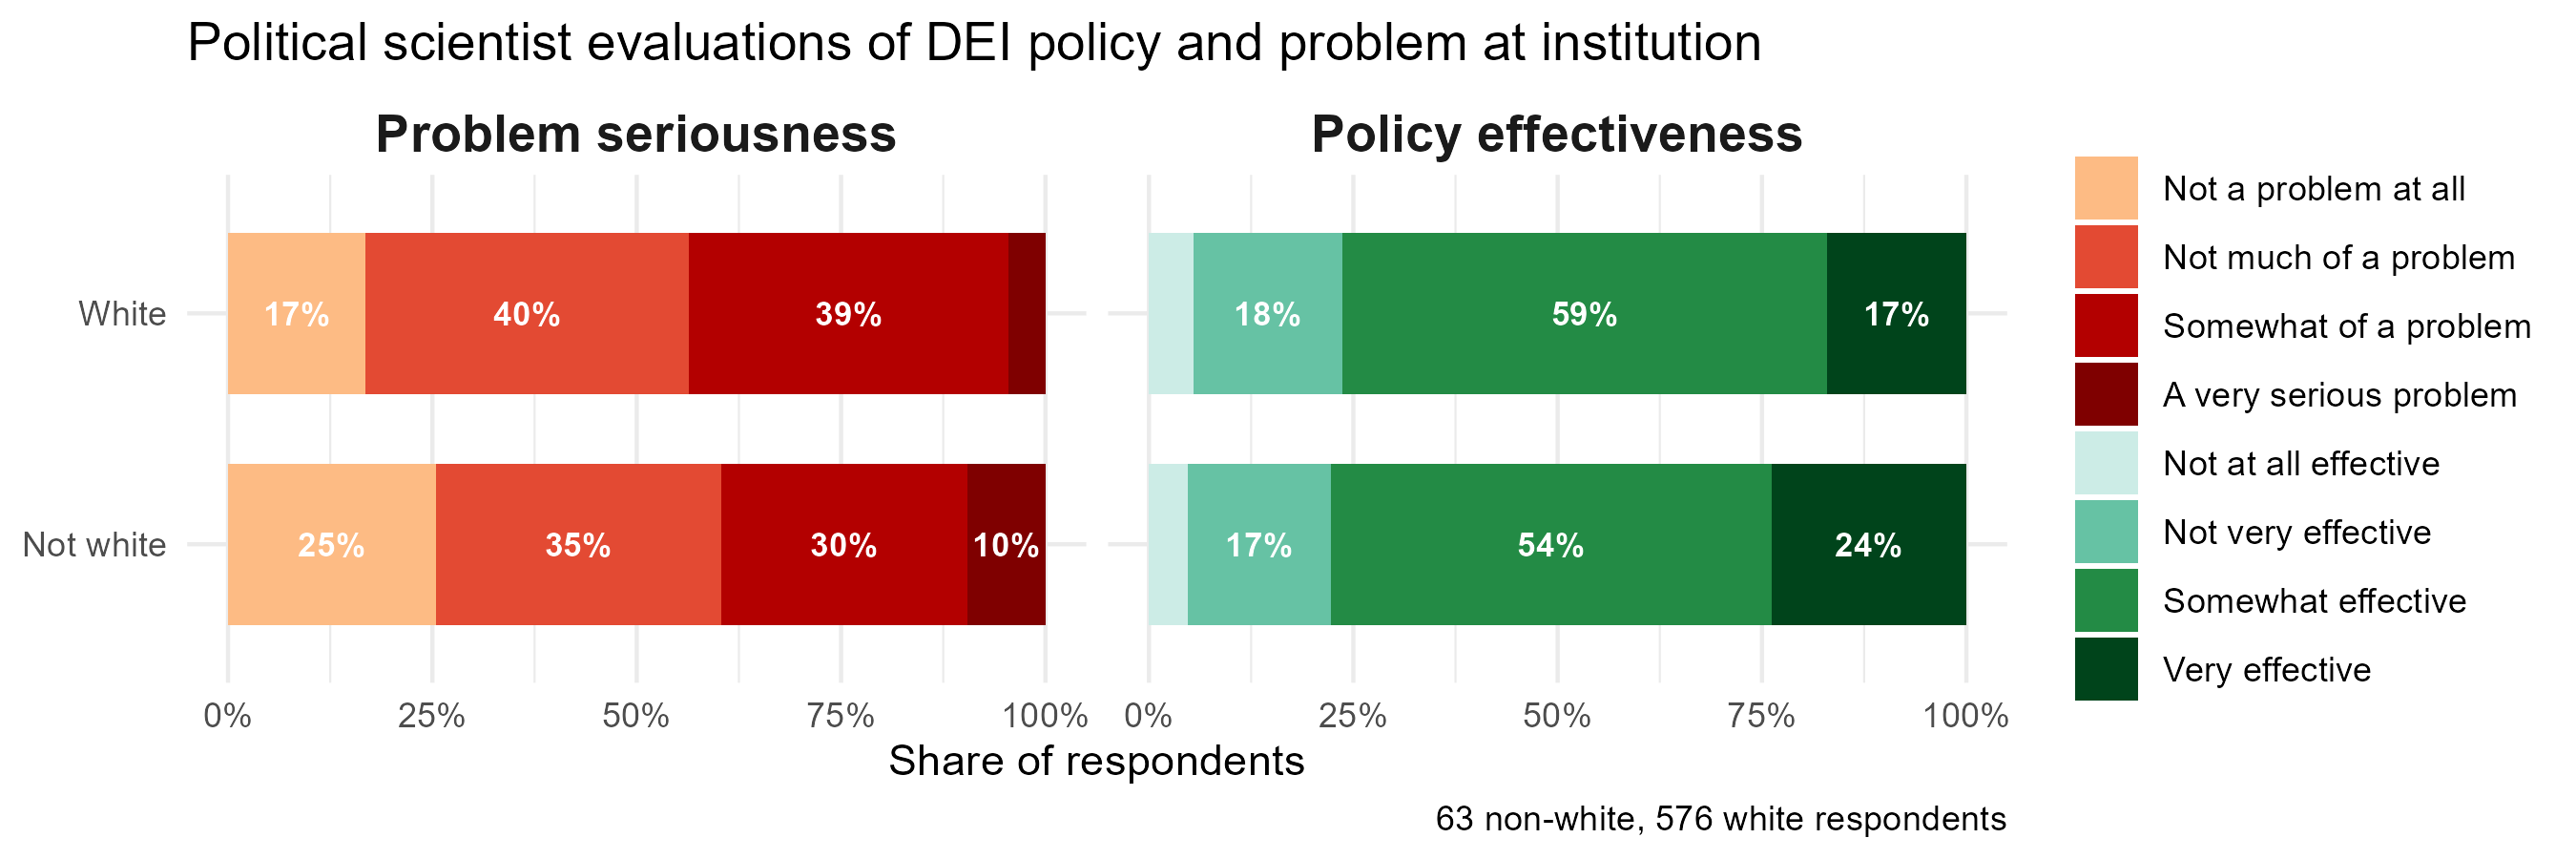
On the DEI questions, we separately analyze respondents who identify as white and those who identify primarily with any other race or ethnicity (Asian/Pacific Islander, American Indian or Alaska Native, Hispanic/Latino/Chicano/a, Black or African American, Other) or who identify as multiracial. We find some differences, but they are less pronounced than might be expected. Non-white faculty are more likely than white faculty to regard a lack of diversity and inclusion on their campus as a very serious problem (10% to 4%), less likely to regard it as somewhat of a problem (30% to 39%) or not much of a problem (35% to 40%), and more likely (25% to 17%) to state that it is not a problem at all. Non-white faculty are more likely than white faculty to regard DEI policies in place as of January 2025 as very effective (24% to 17%), less likely to see them as somewhat effective (54% to 59%) and equally likely to see them as not very effective (17% to 18%) or not at all effective (4% to 5%).
Academic freedom
The Trump administration portrays its recent initiatives as efforts to promote academic freedom and freedom of expression, but these policies have also been widely criticized as unprecedented threats to those same values. We therefore sought to measure attitudes among our faculty respondents on the status of academic freedom and free expression at their institutions.
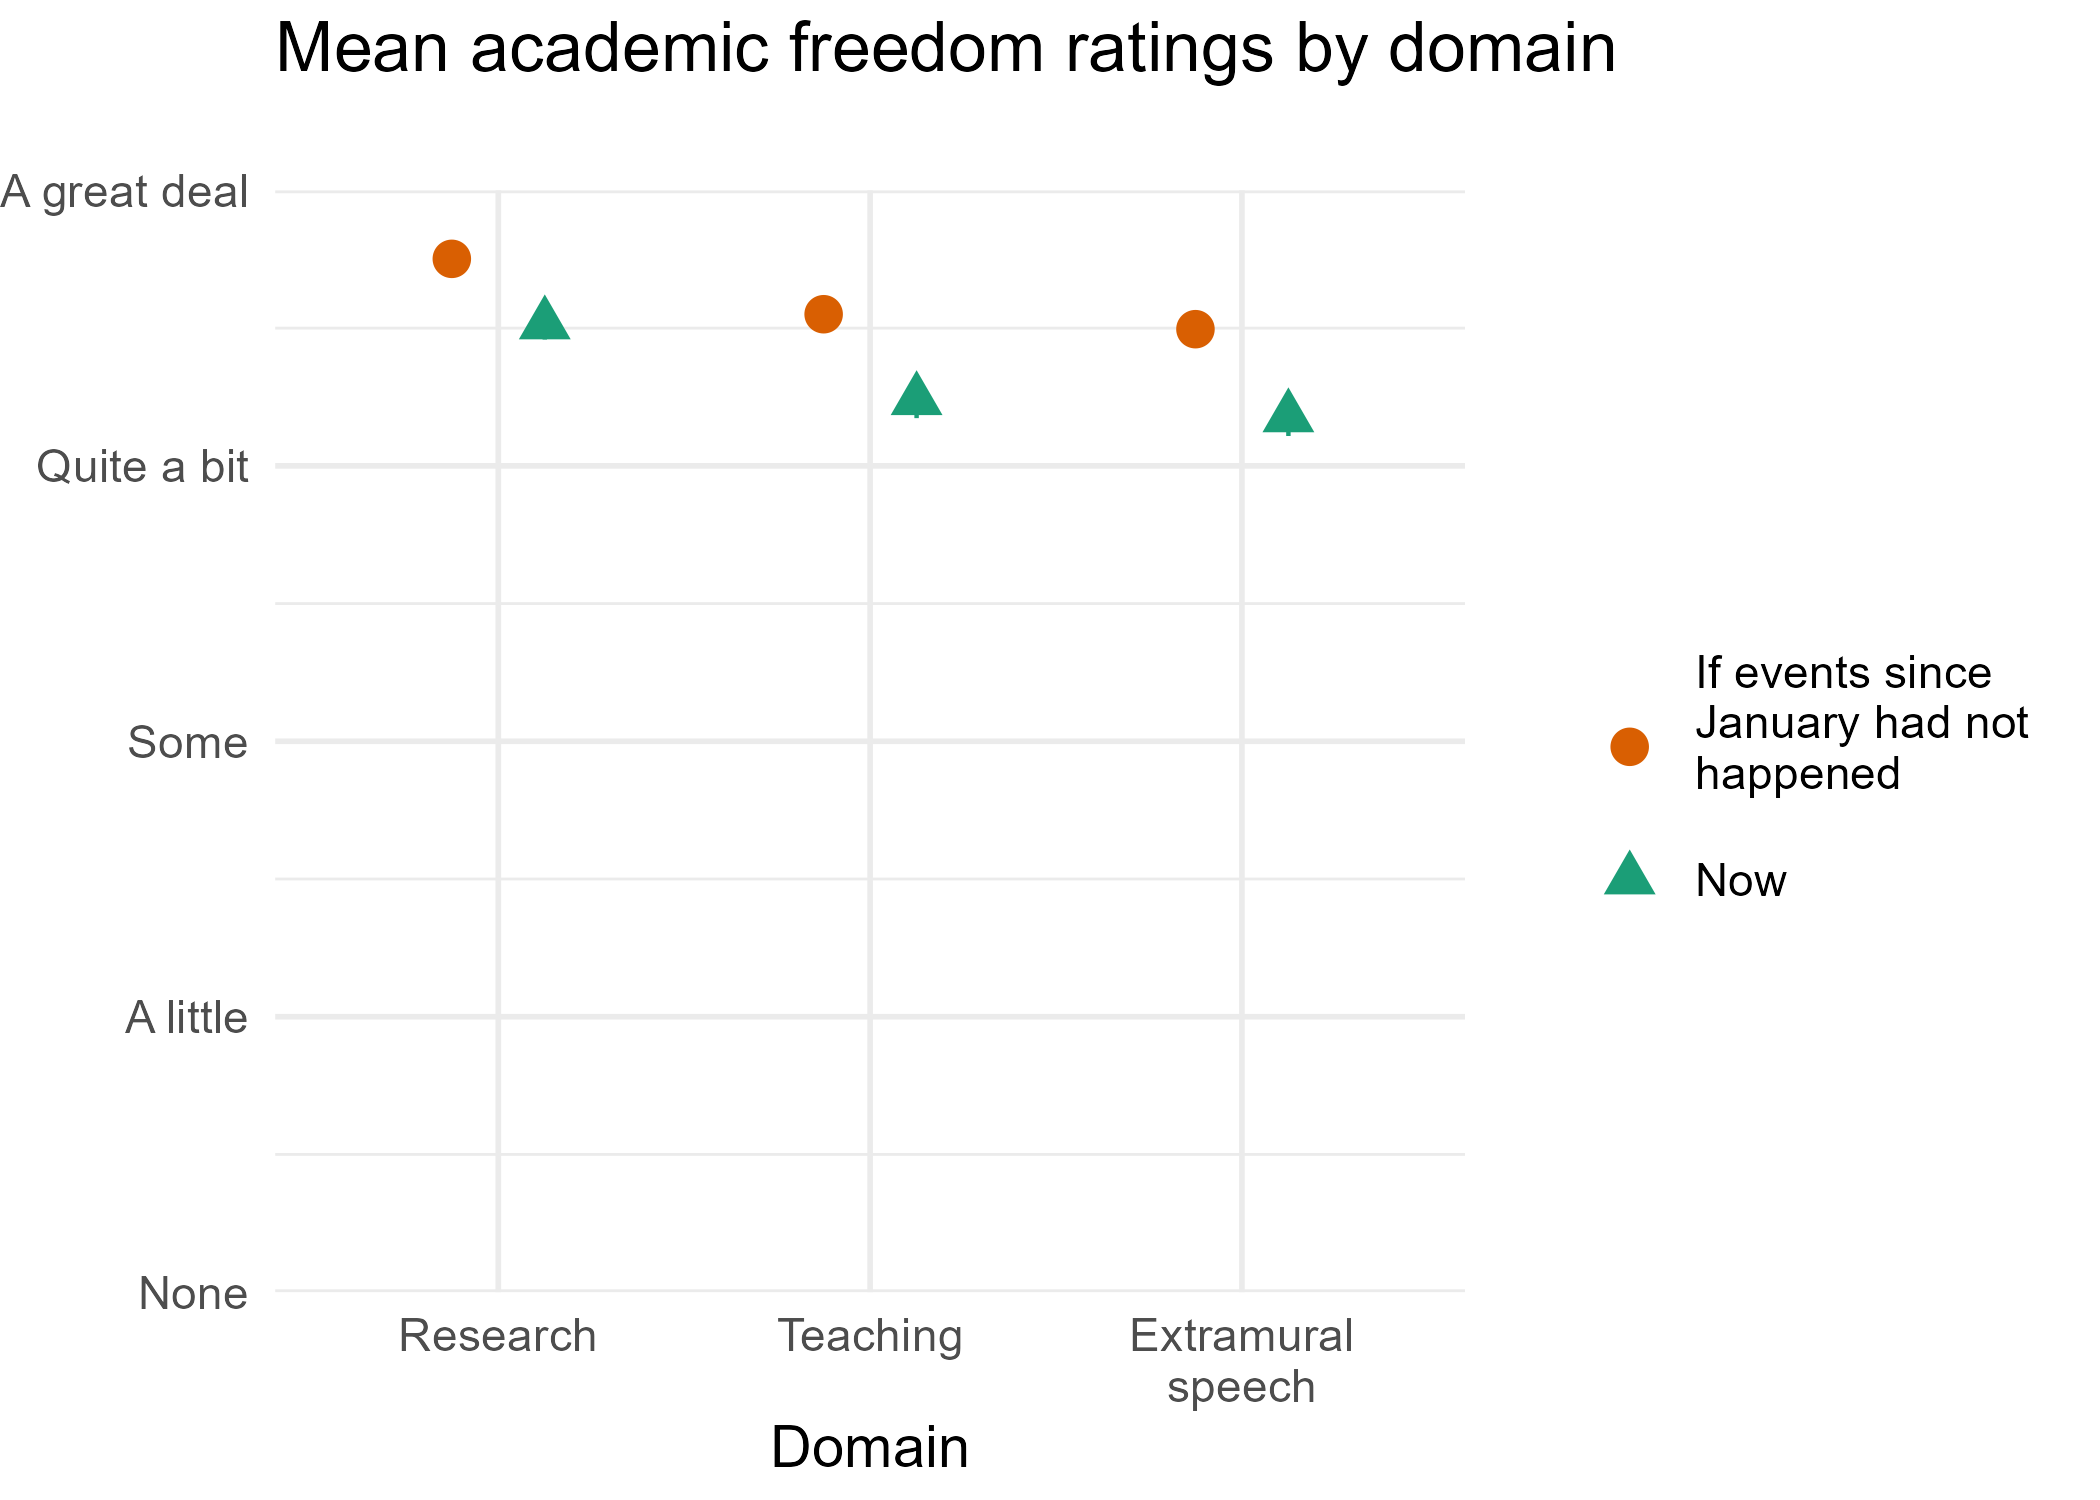
Following question wording from a prior survey by Inside Higher Education and Hanover Research, we asked respondents how much academic freedom they have in their research, teaching, and extramural speech. The figure below summarizes their responses, with the triangular markers indicating faculty assessments of current academic freedom. Political scientists, on average, regard themselves as having somewhere between “quite a bit” and “a great deal” of academic freedom in their research, teaching, and extramural speech, with freedom in the first domain slightly greater than in the latter two.
We also sought to estimate whether and how events in the first three months of Trump’s second term have affected faculty perceptions of academic freedom. Because we do not have previous estimates on this issue, we drew on a technique developed by the political scientists Matthew Graham and Alexander Coppock, repeating the same question as above, but prefaced as follows: “Suppose you had not experienced the events that have taken place in the United States since January 20, 2025. How would you have answered the following question?”12
The round markers in the figure below show estimates of academic freedom in the absence of events of the last three months. The gaps between the round and triangular markers, therefore, are estimates of changes in academic freedom attributable to events since January. In this counterfactual world, the political science faculty respondents envision somewhat more freedom in each domain.
Because most experts report high levels of academic freedom, the average degree to which they might report feeling more freedom in the absence of recent events is necessarily limited. The following figure provides a different perspective, showing the shares of respondents who indicate that they would have less (for example, moving from “a great deal” to “quite a bit”), the same, or more academic freedom had events since January not happened.
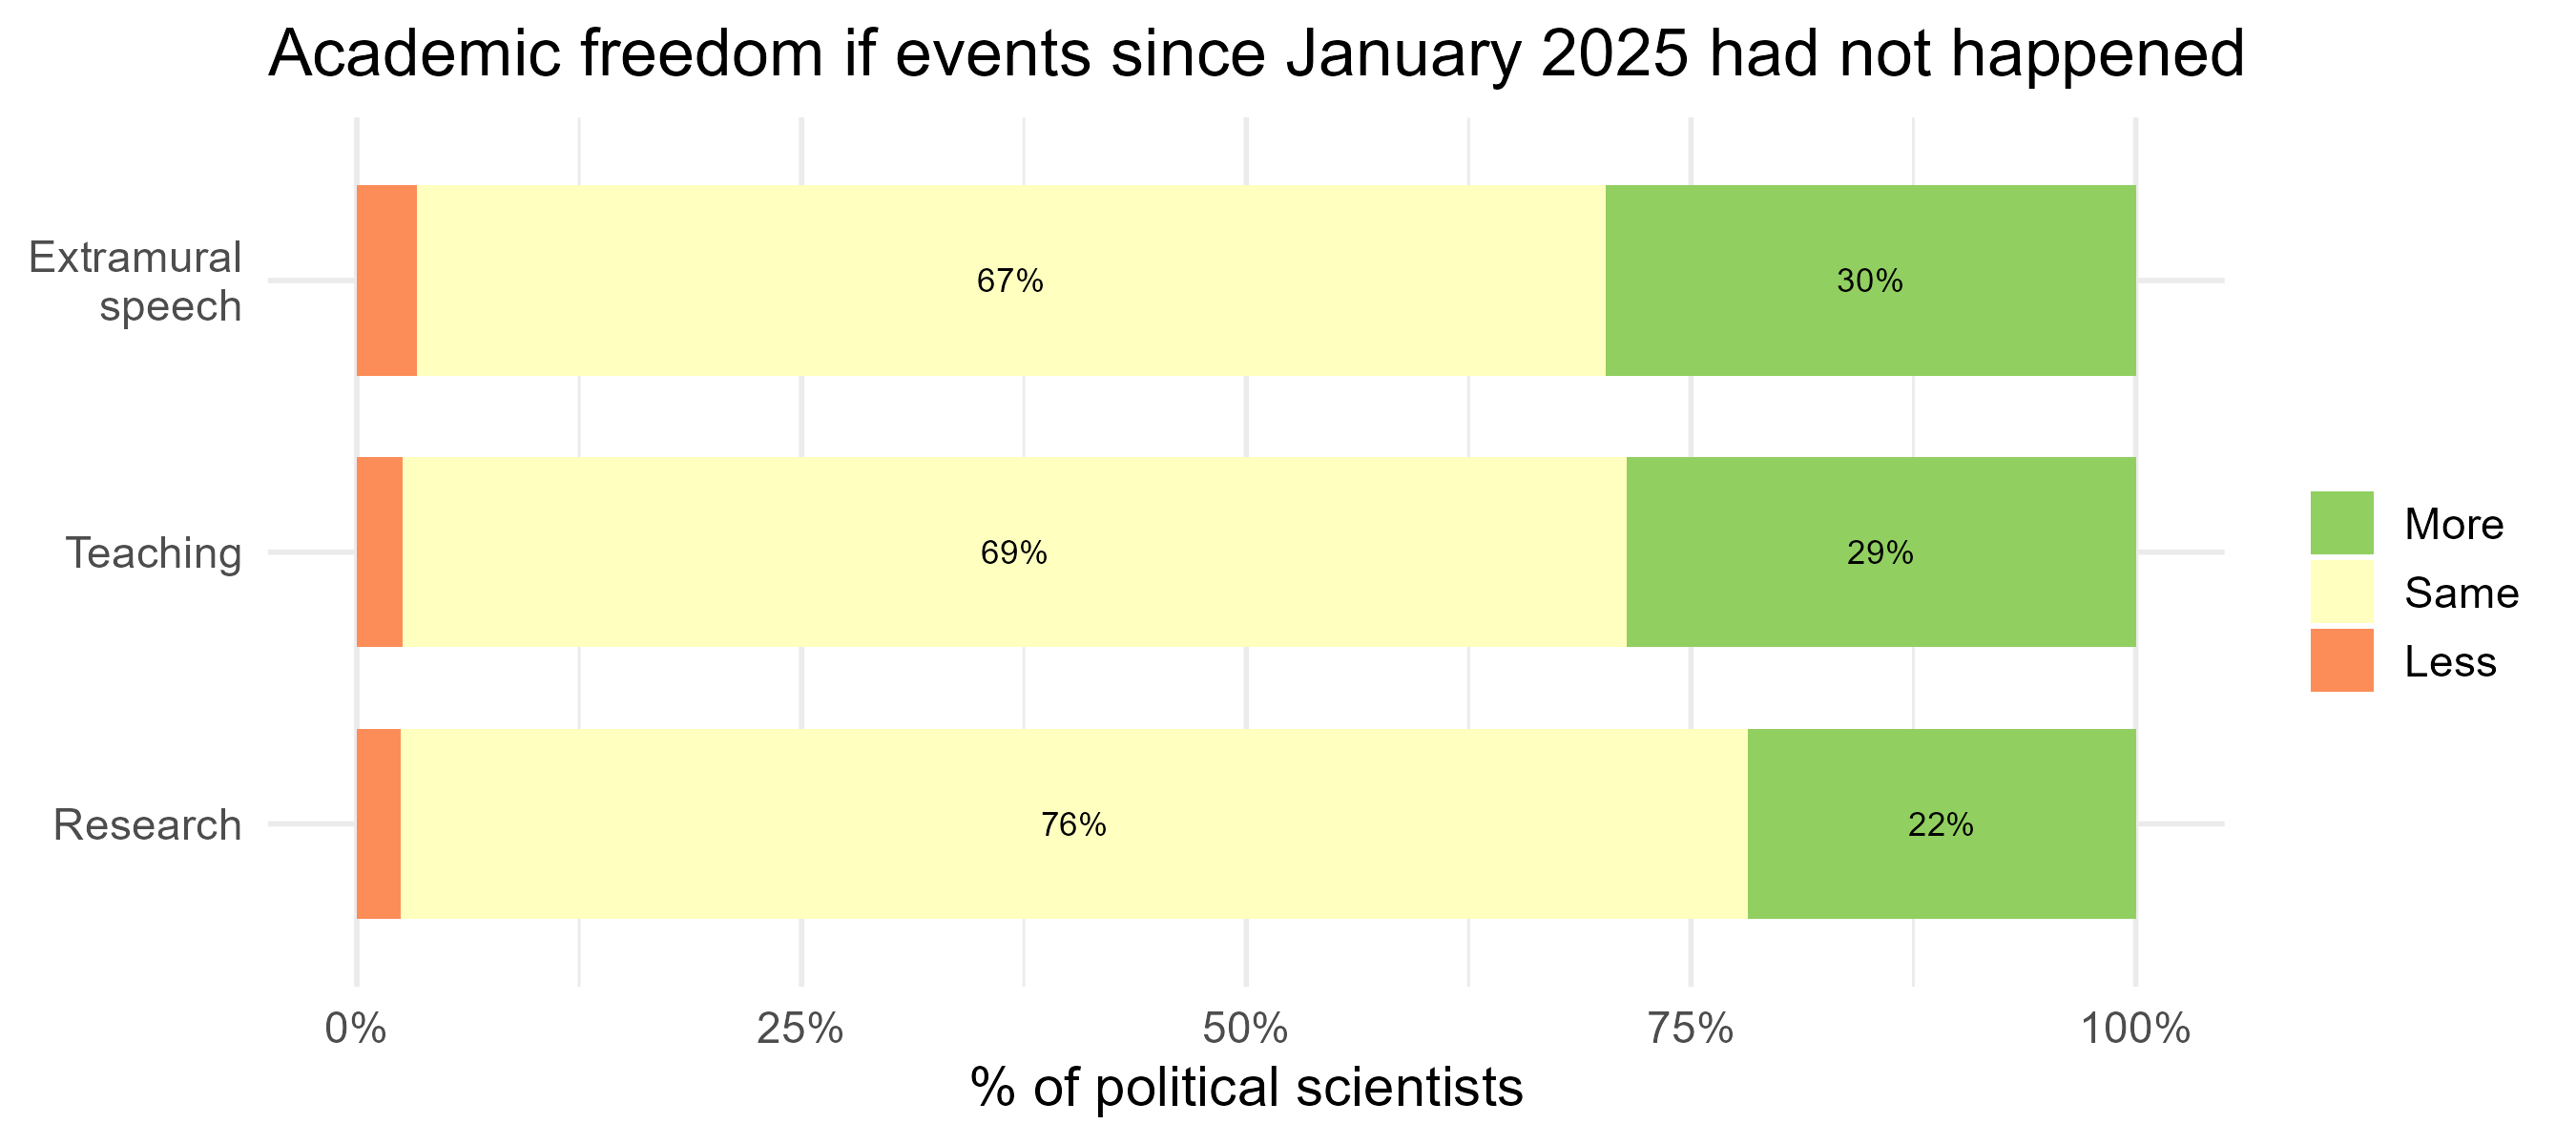
In each domain, large majorities (between 67% and 76%) report no change in freedom. Among those who perceive a change, however, far more perceive declines in freedom due to events since January 2025 (22% for research, 29% for teaching, 30% for extramural speech) than perceive increases (2%, 2%, and 3%, respectively). Those declines are limited in size and perceived by only a minority of faculty to date, but many more faculty perceive declines in academic freedom than increases.
In addition to measuring changes in freedom by domain, we also sought to assess whether political scientists feel that academic freedom has changed more on some topics than others. The next figure shows the share of respondents who feel less freedom, the same level of freedom, or more freedom now than they did in January 2025 to discuss a range of politically controversial issues.13
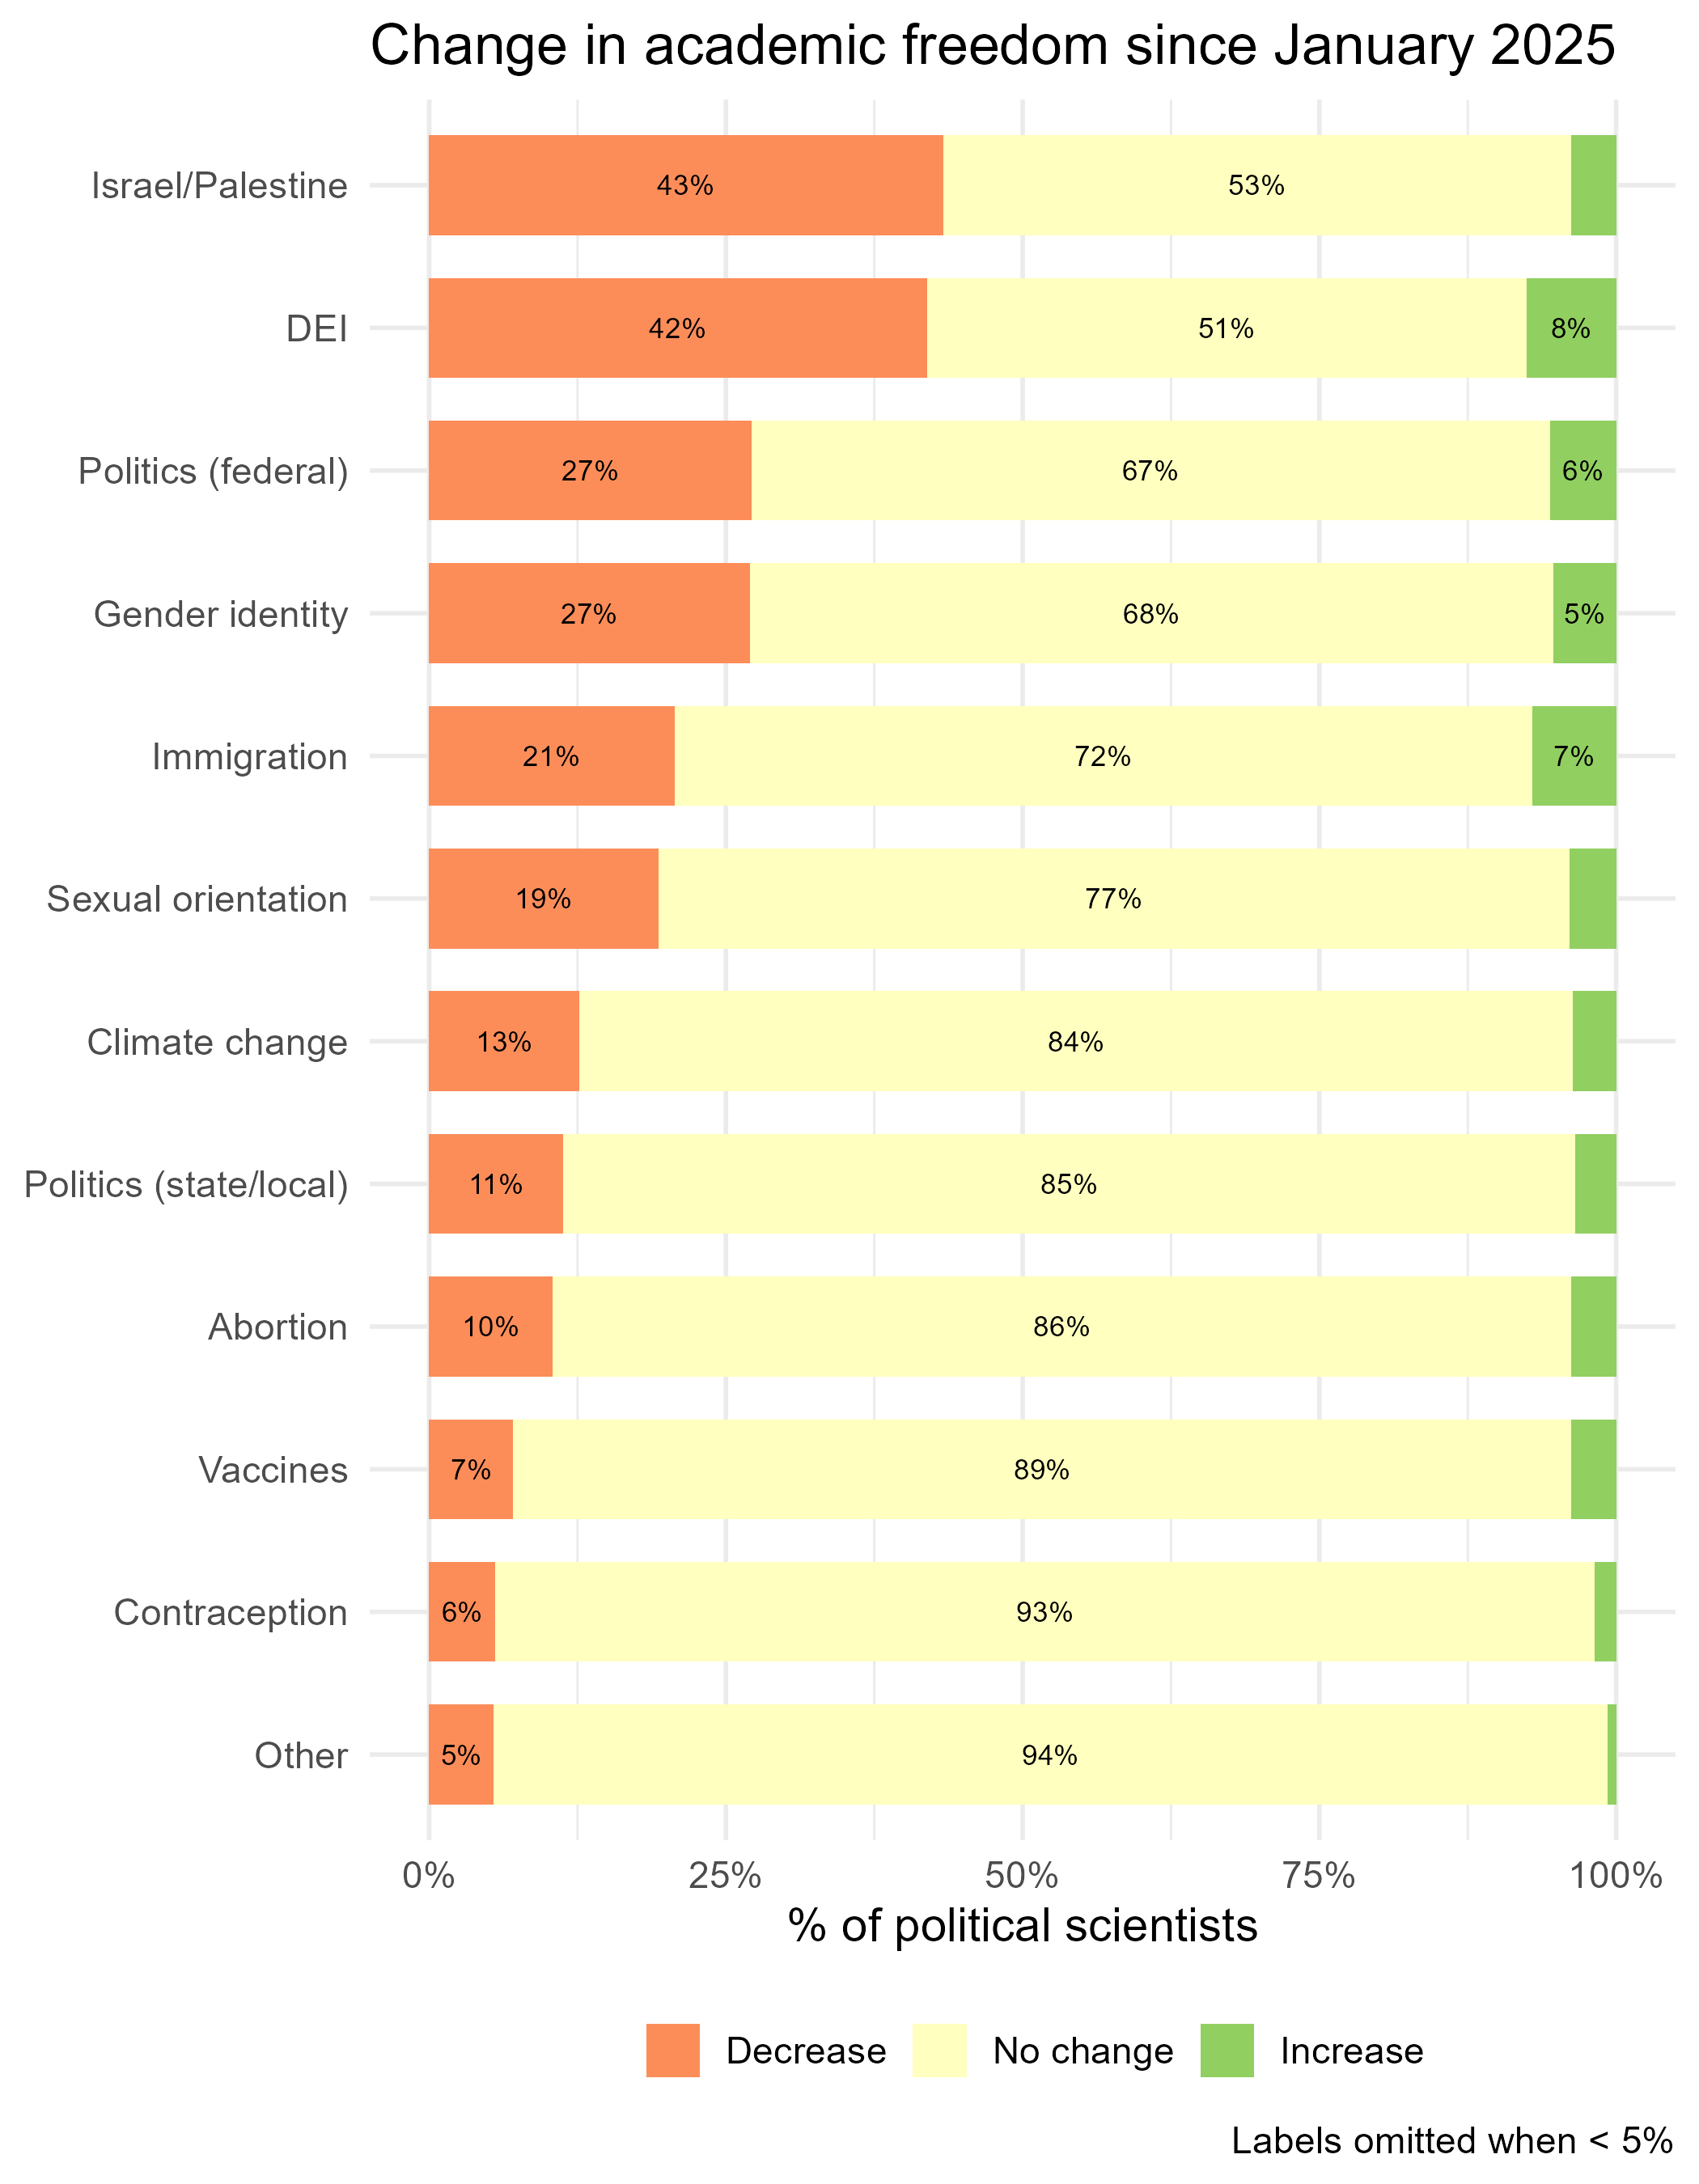
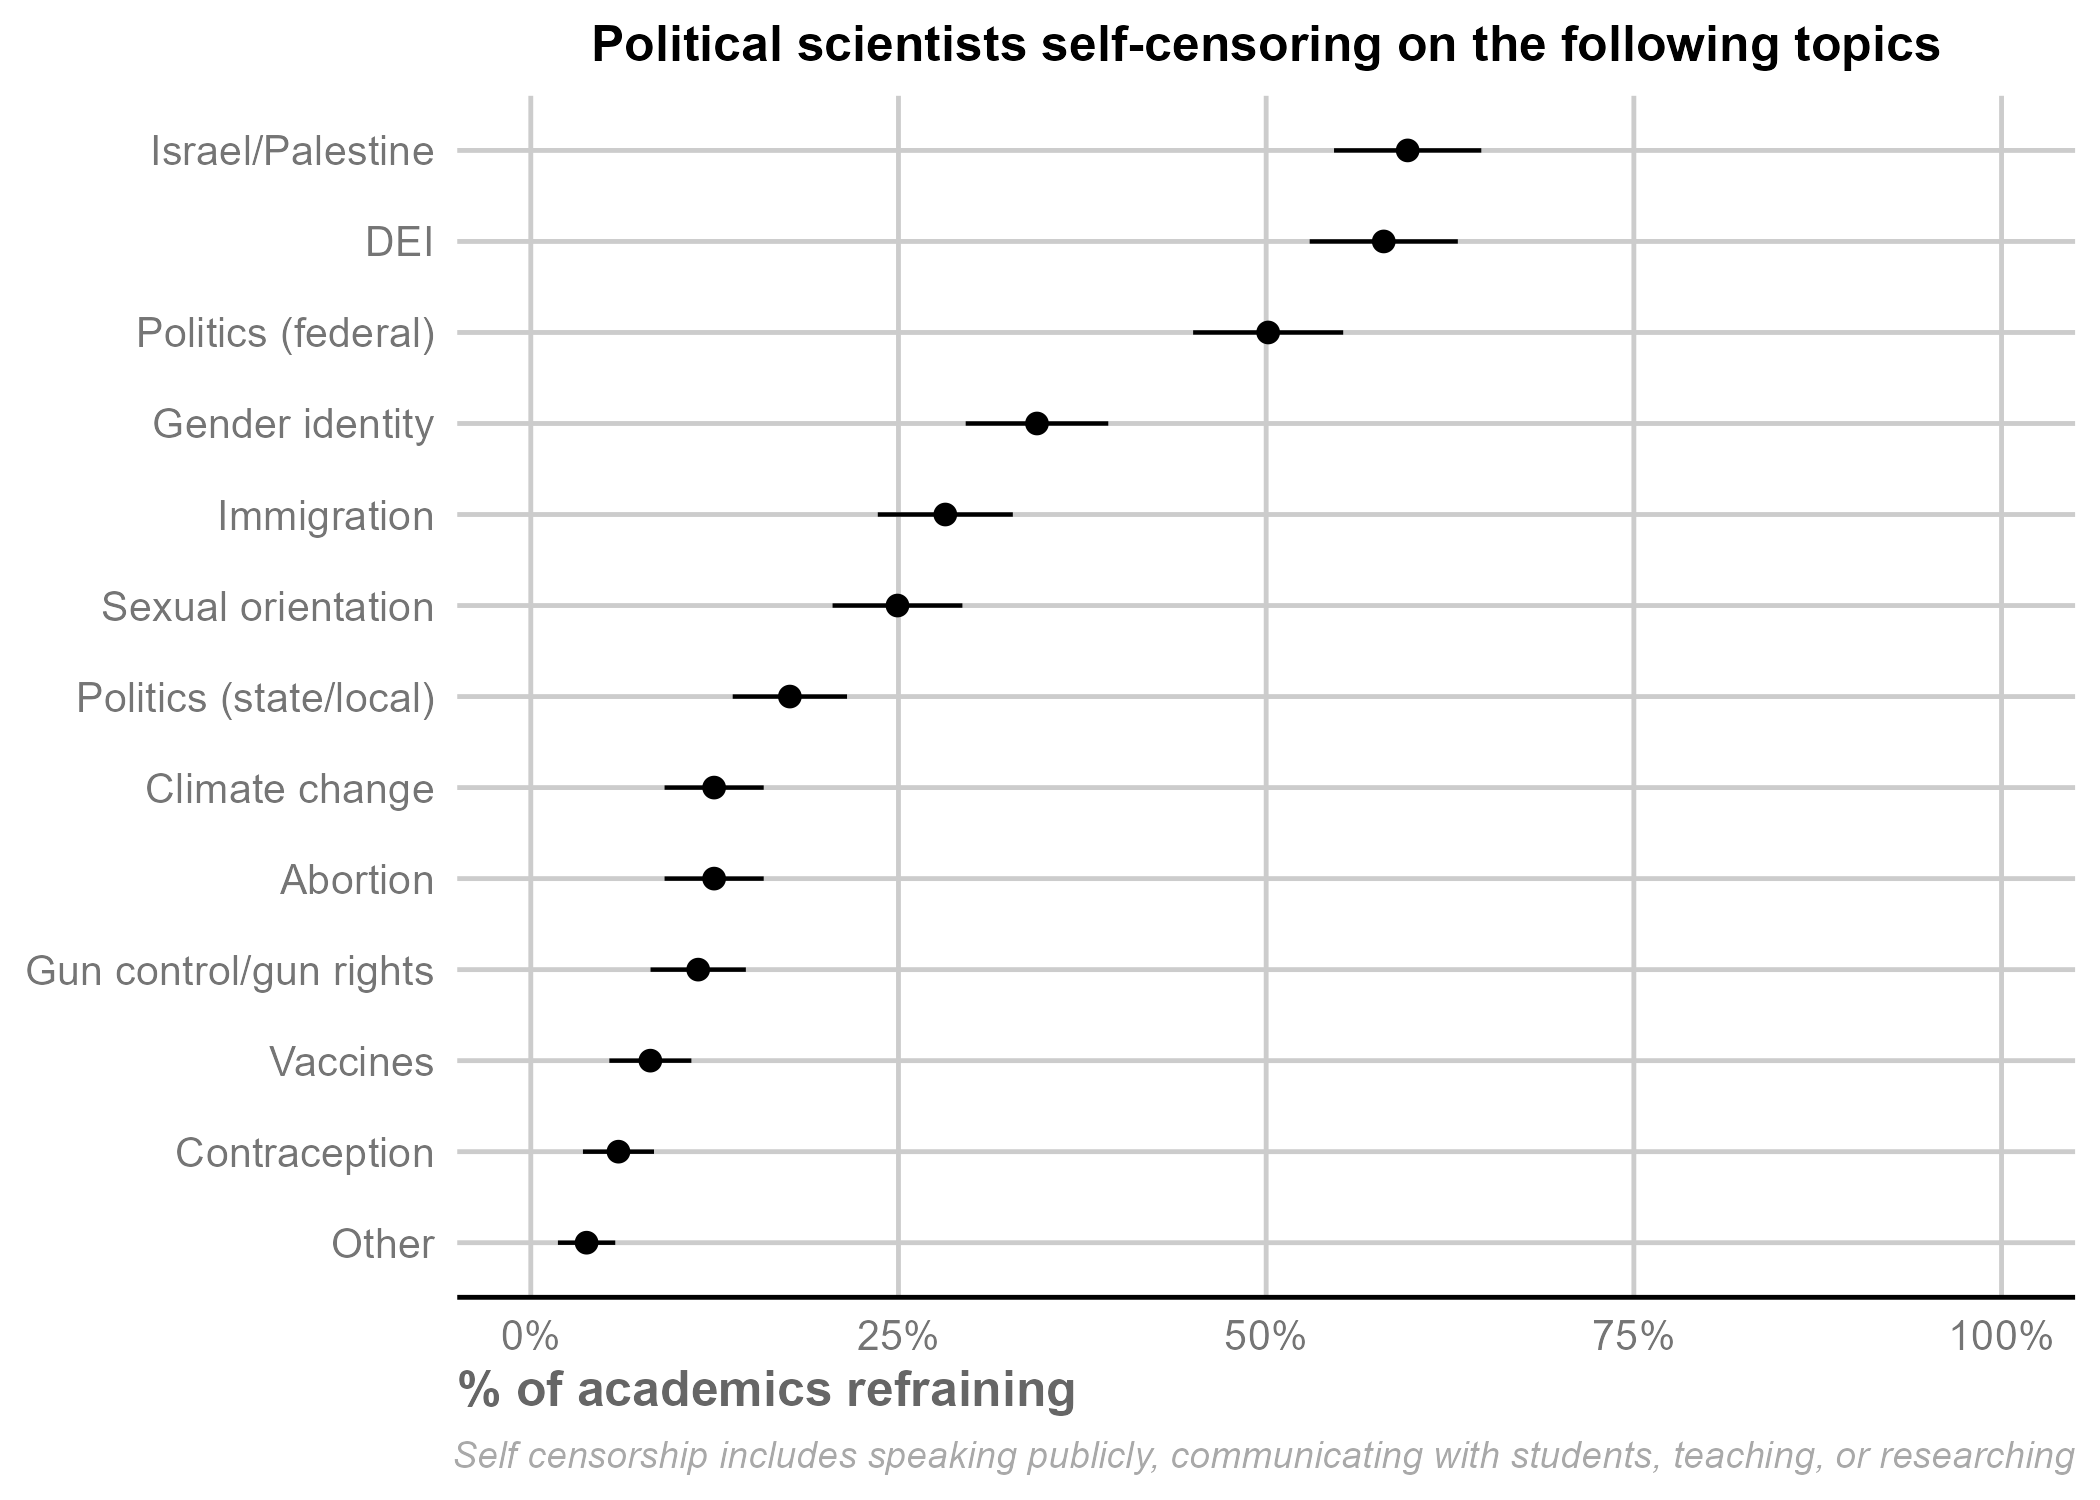
On most topics, majorities of faculty respondents reported no change since January in their sense of freedom. The exceptions are the Israel/Palestine conflict and DEI. Forty-three percent of political scientists report feeling less freedom now to discuss Israel/Palestine than they did in January; only 4% report feeling more freedom. On DEI, 42% report a decline in freedom compared to 8% who perceive an increase. Perceived levels of changes are lower for national politics, gender identity, immigration, and sexual orientation, but 19–27% of faculty report less freedom to discuss these topics as well.
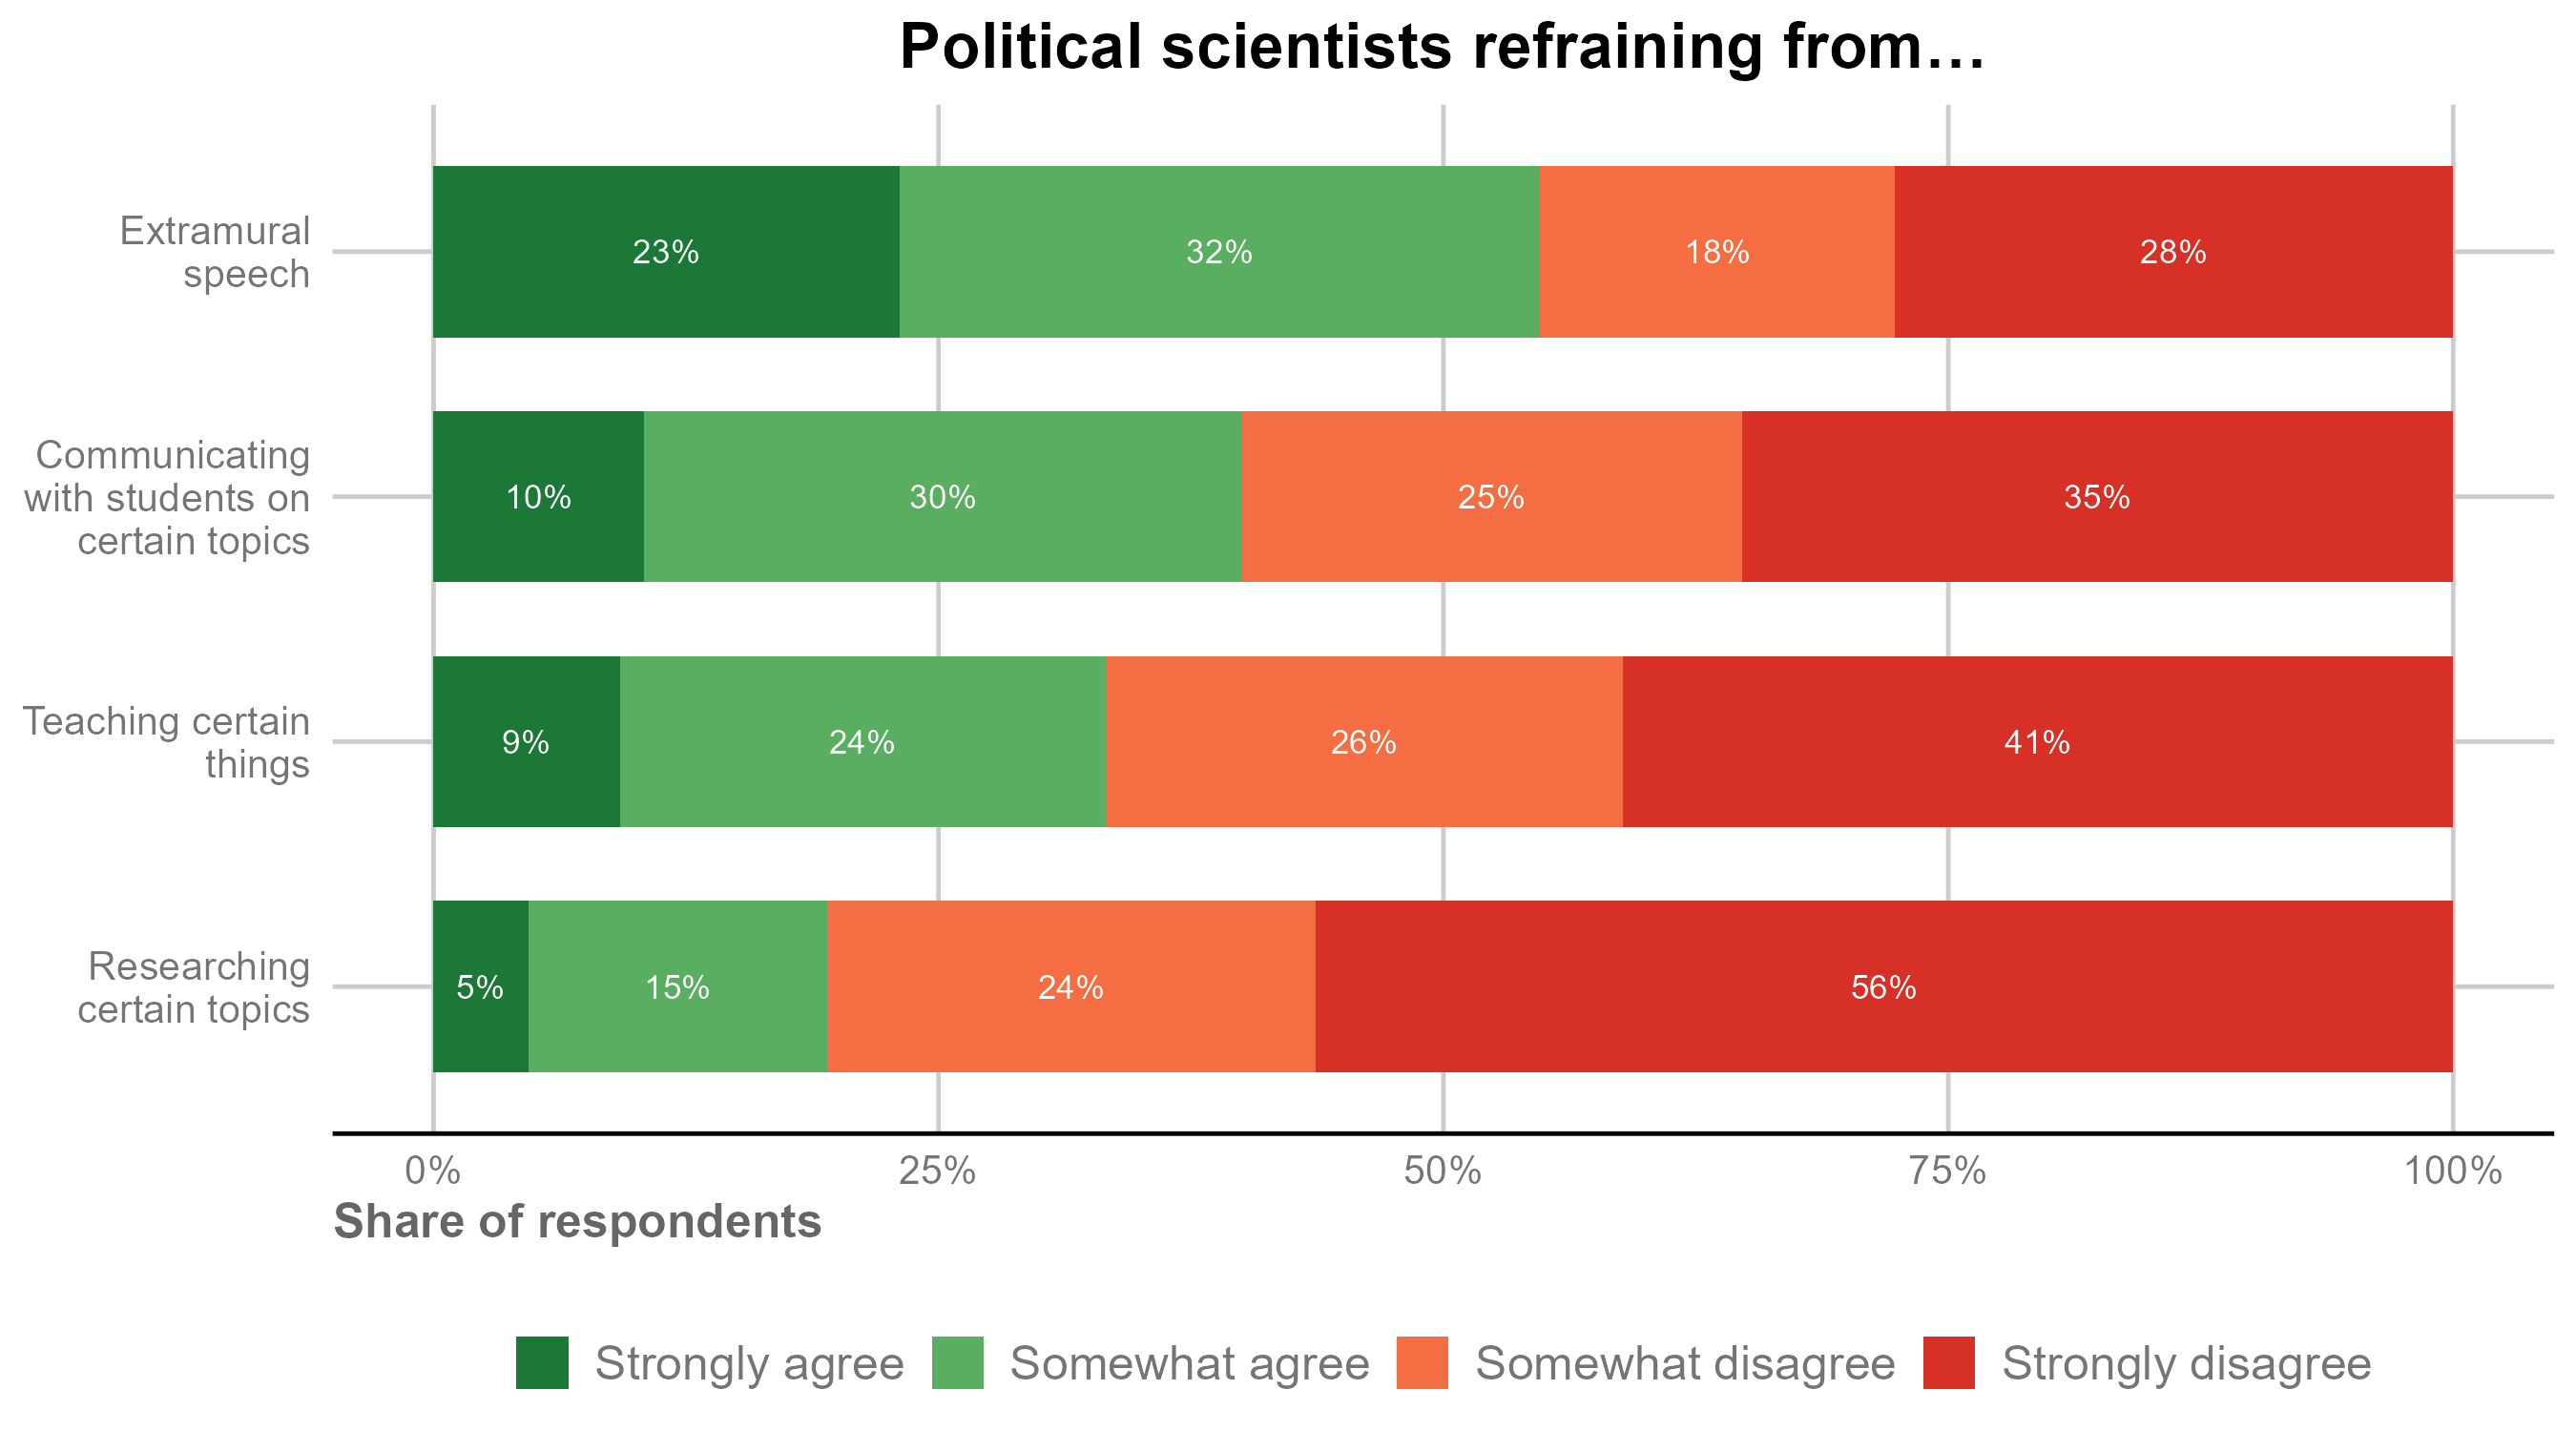
We also asked how political scientists have changed their behaviors because of perceived threats to academic freedom. The following figure shows the percentage of faculty respondents who indicated that they currently refrain from expression in four distinct areas “due to the situation on my campus and/or the broader political environment.”
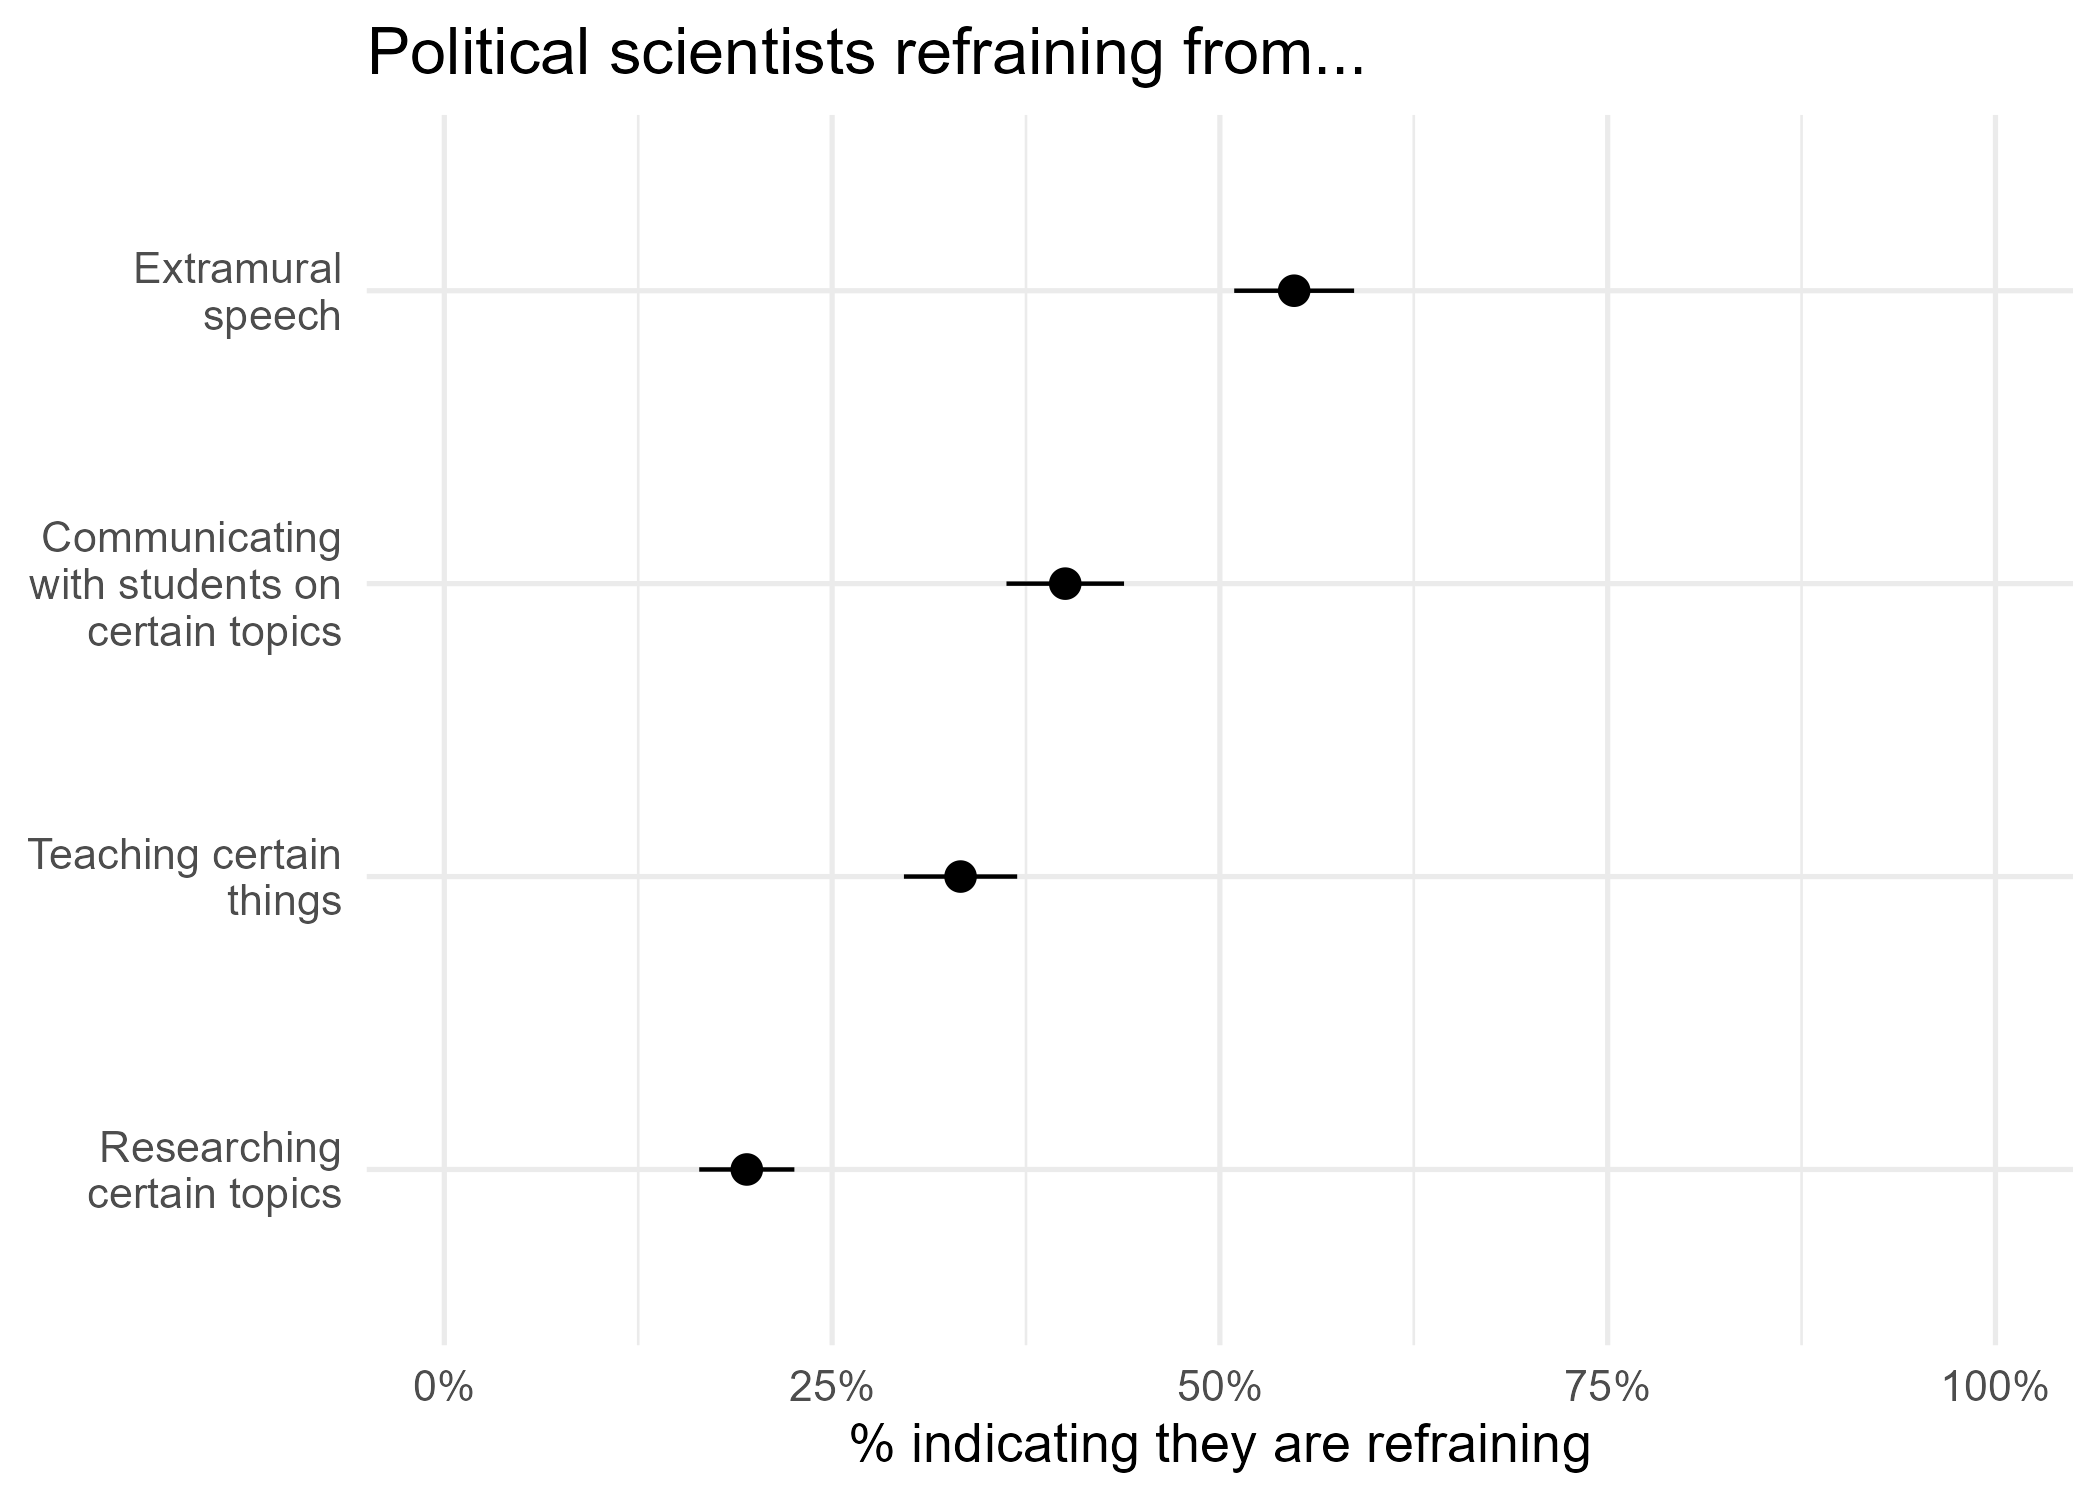
The smallest share of political scientists, 20%, indicated that they are avoiding research topics due to political pressures. One-third, 33%, reported that they are refraining from addressing certain topics in class. A larger share, 40%, avoid some topics in communications with students outside of class. A majority of political scientists (55%) report refraining from extramural communications such as on social media due to external pressures, including 78% among faculty respondents who are not U.S. citizens (see figure in the appendix). We examine differences in perceived academic freedom between citizens and non-citizens further below.
Overall, 61% of participants said that they refrained from at least one of these activities. We followed up with those respondents to ask whether campus-specific factors or the broader political environment were more important in causing them to refrain from the factor in question (they could also say that both affected them equally). Most (71% of those who said they refrained, 44% of all respondents) cited the political environment beyond campus and another 22% (14% of all) indicated that campus-specific factors and broader factors both played a role. Only 8% (4% of all) pointed exclusively to factors on their own campus. In short, factors external to campus climate weigh far more heavily on faculty who are self-censoring than do campus-based factors.
We asked those who indicated that they exercise restraint in at least one area what concerns drive their self-censorship. The next figure shows the percentage who said each concern affects their behavior for six potential factors (as well as an open-response option for “other”). The factors are listed in declining order of prevalence, with the exception of the immigration/residency/citizenship option, which is listed at the bottom and discussed separately below.
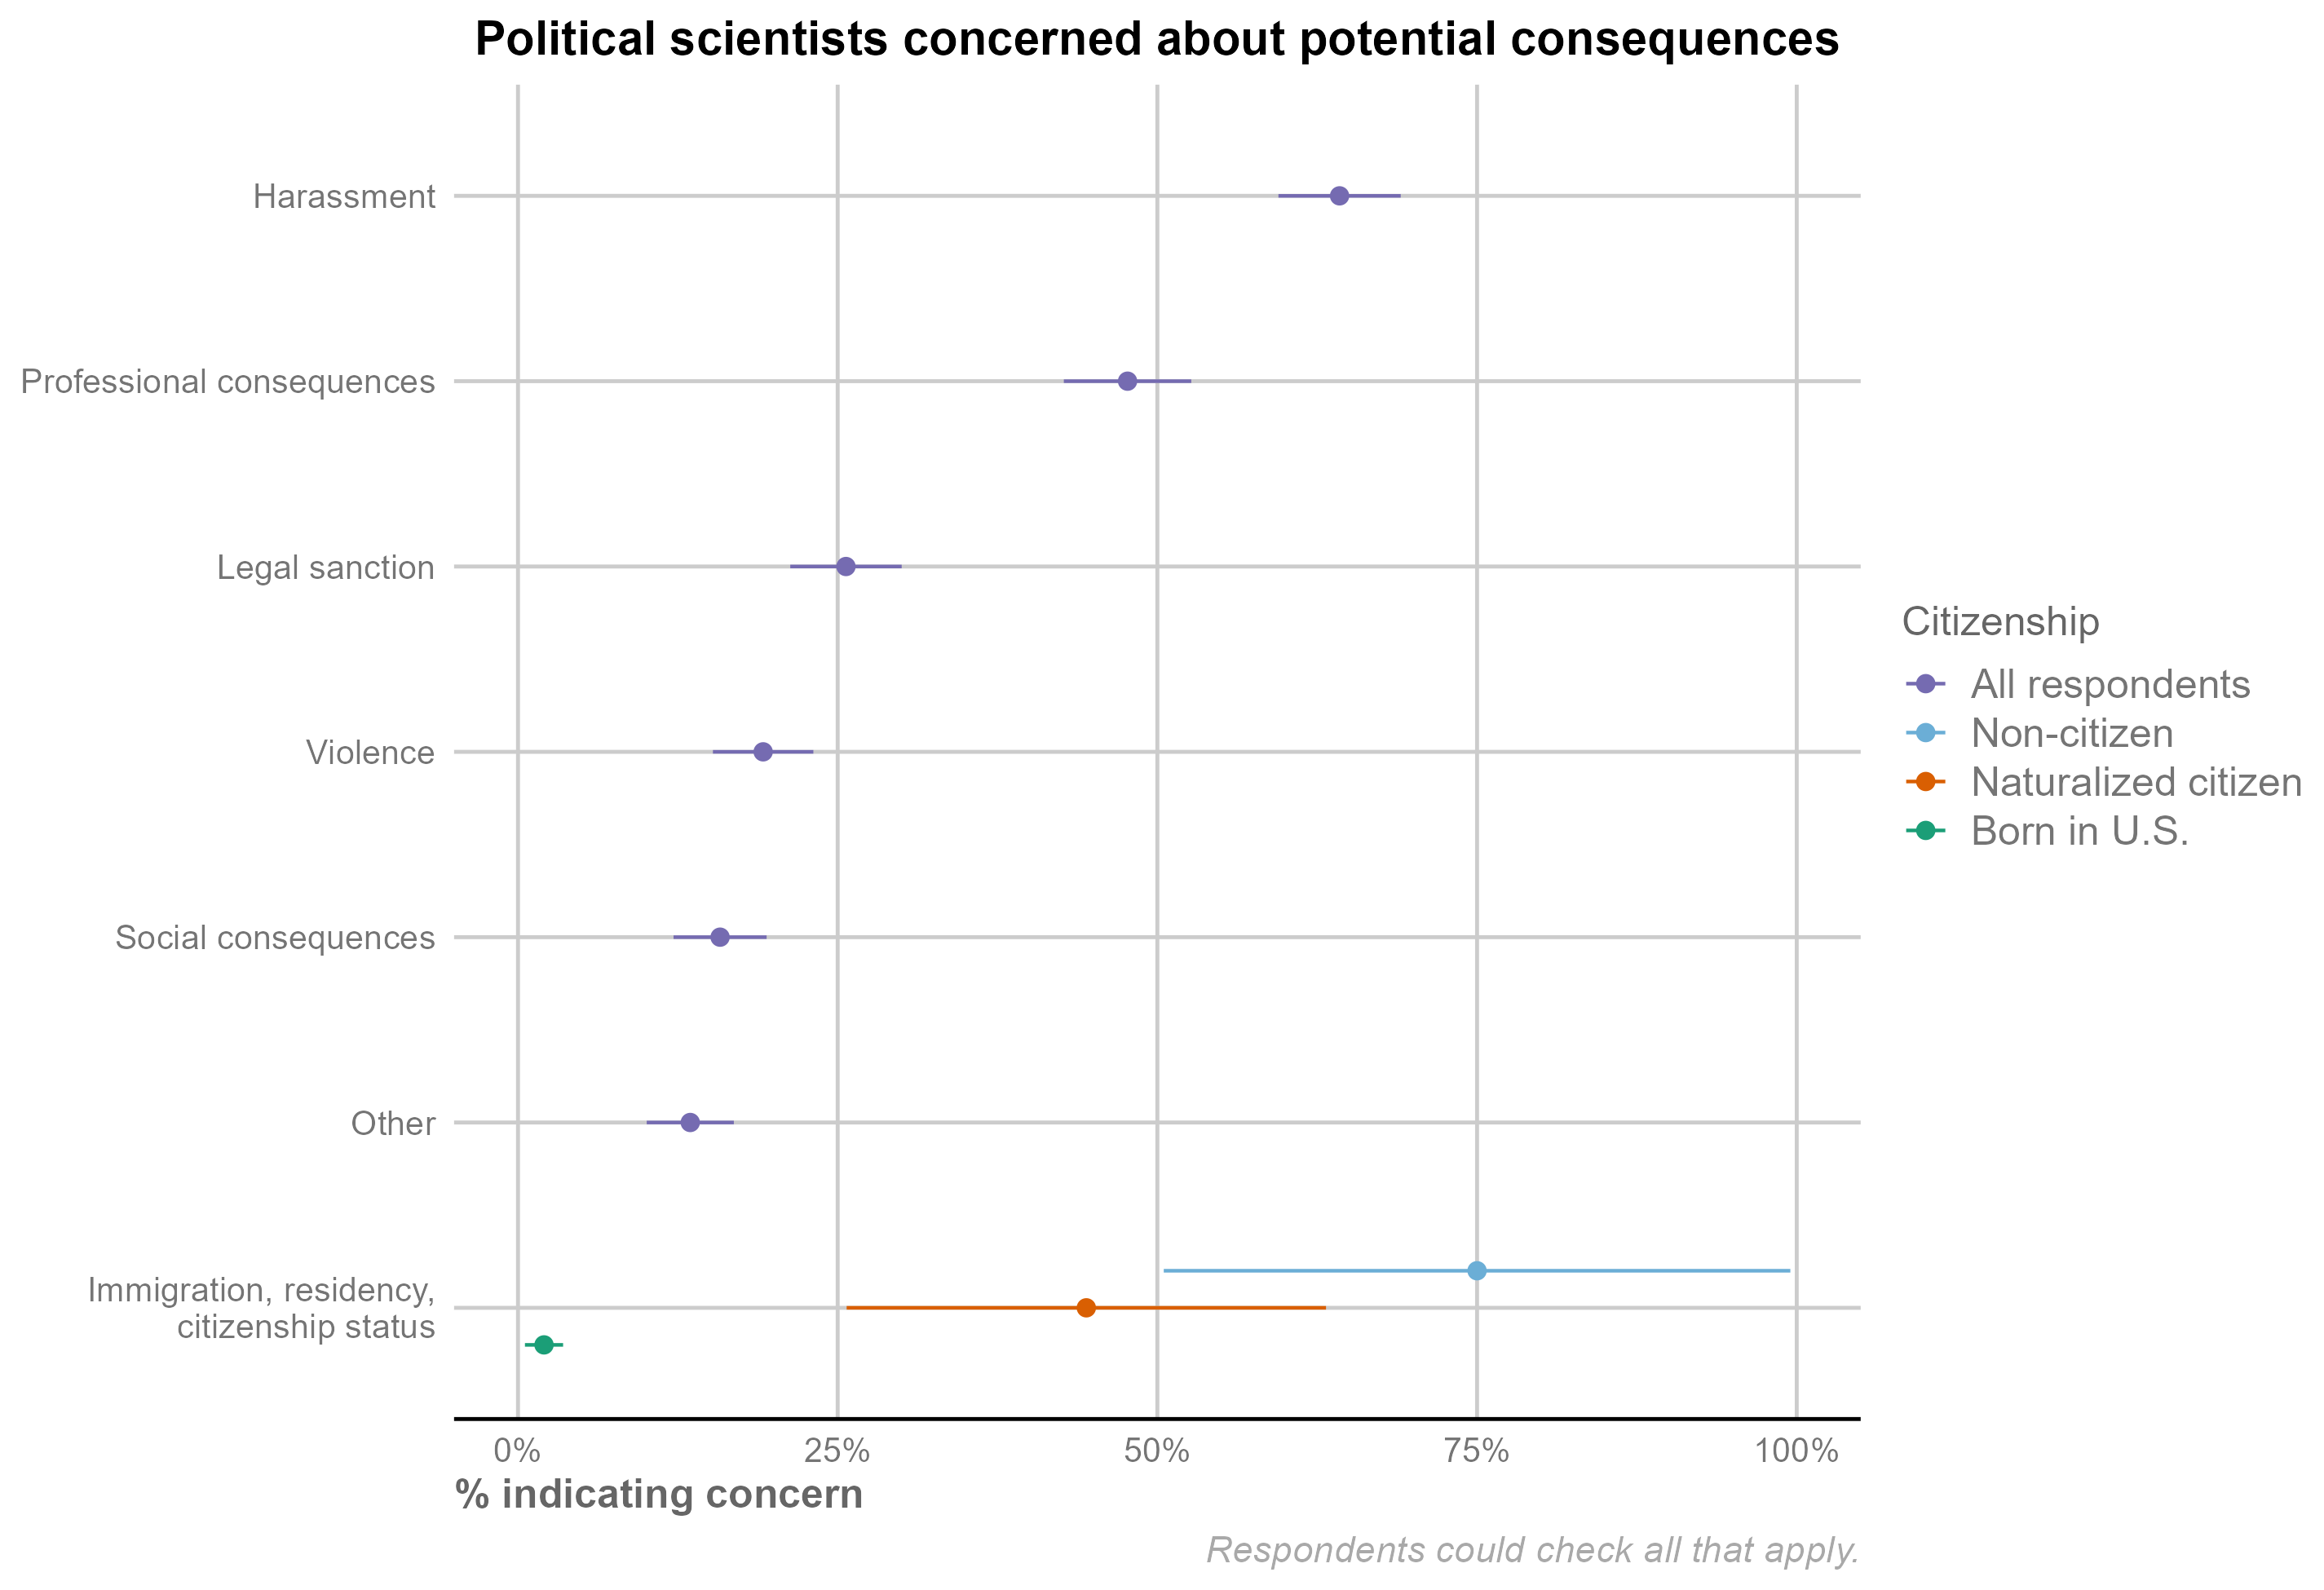
The most common concern, cited by 64% of respondents who self-censor, was harassment (online or in person). Next were professional consequences, which the survey question suggested could include losing a job or a promotion. Forty-eight percent of those who self-censor indicated that fear of professional consequences lead them to refrain from at least some professional communication. About one in four (26%) of those who self-censor fear potential legal sanction – for example, prosecution or a fine. Nineteen percent cited fear of violence – for example, assault – and a slightly smaller share (16%) cited potential social consequences such as exclusion from a social event. Thirteen percent of respondents mentioned (in an open-response survey option) some other factor that causes them to self-censor, including drawing unwanted attention from political entities, consequences for their institutions, and denial of re-entry after international travel.
The bottom row of the figure shows responses on a final response category: “Immigration, residency, citizenship status.” Unlike the other response options, we expected this concern to affect faculty experts differentially according to their citizenship status. We included a question near the end of the survey on citizenship status. Responses on this response category are presented separately for respondents who are citizens born in the United States (92% of those who answered that question), naturalized citizens (6%), or non-citizen residents (2%).
As expected, levels of concern about immigration, residency, and citizenship status vary widely across groups. Among respondents who self-censor, only 2% of birthright citizens said concern about residency status was a motivating factor. Among naturalized citizens, the rate was over twenty times higher, at 45%. Fully three-quarters of non-citizen residents who self-censor (and 64% of non-citizen respondents overall) cited concern about their immigration, residency, and citizenship status.
Recent efforts to deport non-citizens and revoke permanent residency status based on political speech are clearly reducing the willingness of political scientists at American universities to express their views openly. This chilling effect is especially severe for those who were born outside the United States.
University leadership
Harvard University’s defiance of Trump administration demands in an April 15, 2025 letter attracted substantial attention and prompted subsequent efforts to coordinate collective action across universities to resist the administration’s demands. However, leaders at many universities have also come under criticism, often from their own faculty members, for their cautious responses to external pressure, which may reflect the federal government’s immense financial leverage over universities. We surveyed our expert sample to assess how political science faculty rate their university administrations’ effectiveness in protecting academic freedom.
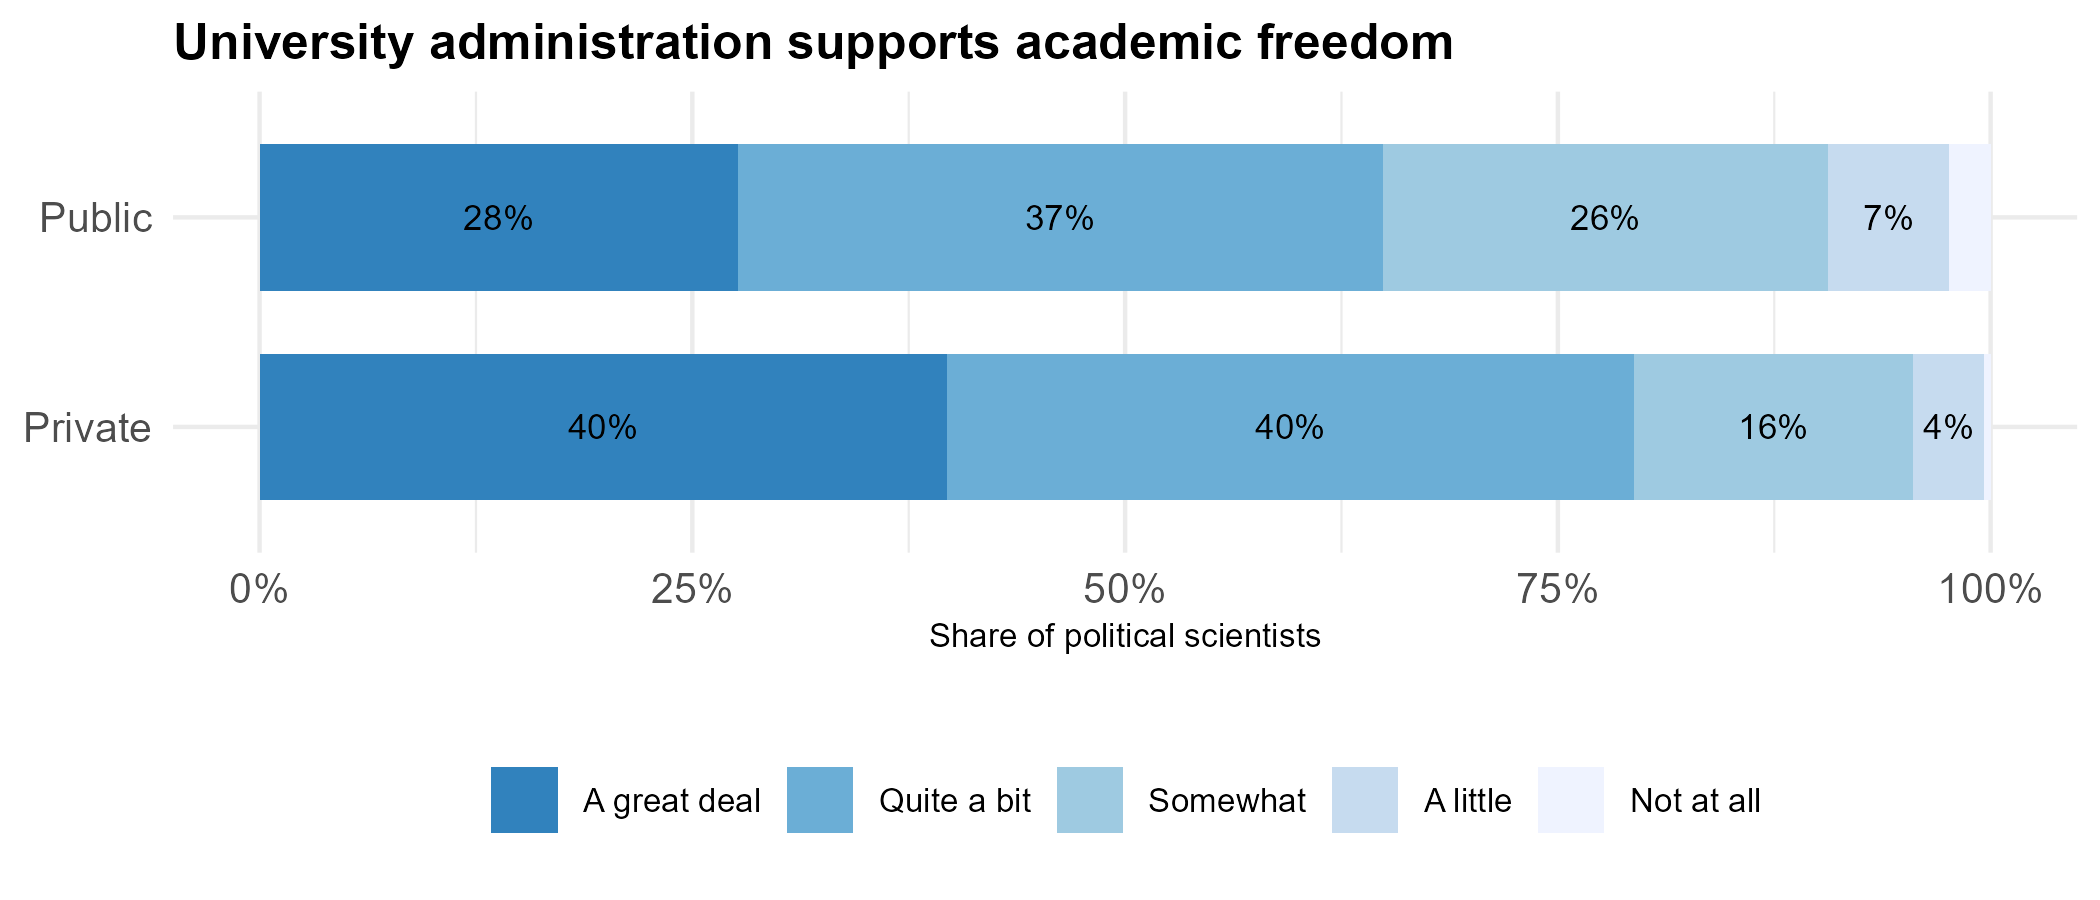
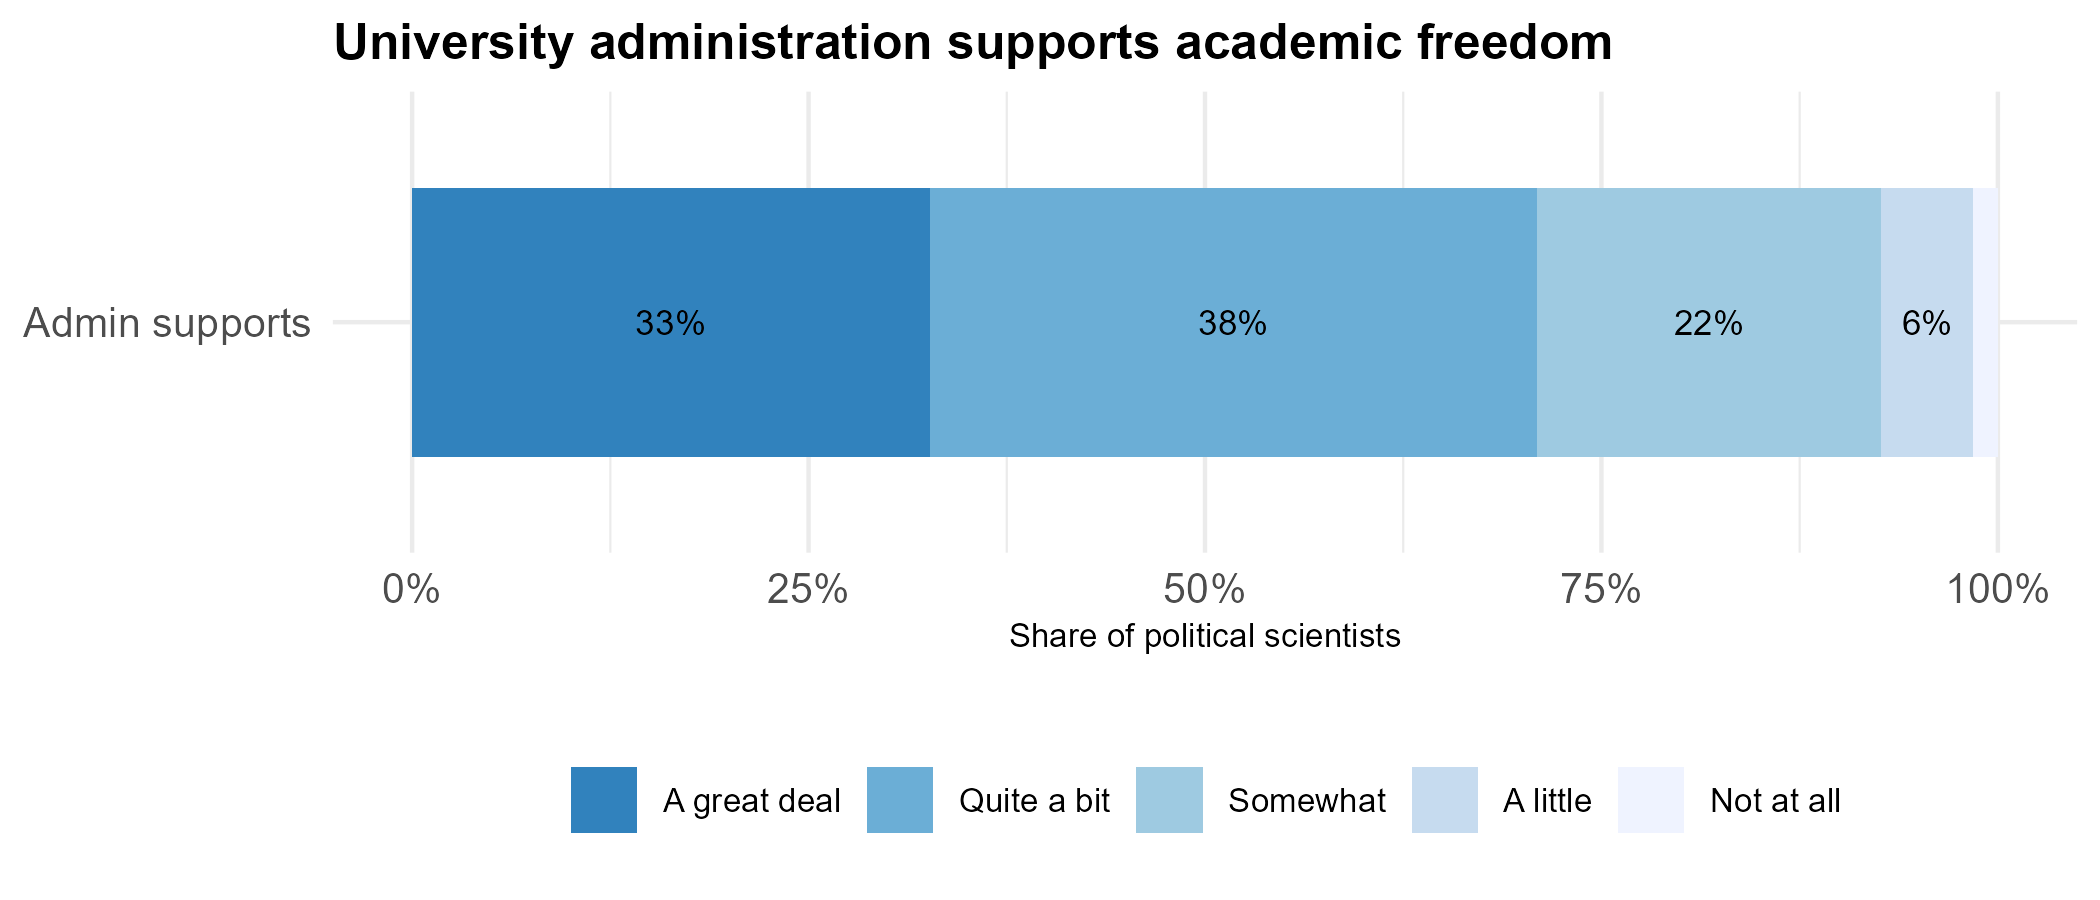
The survey asked the expert sample to assess the statement that “The administration of the university where I teach supports academic freedom.” Overall, the faculty regard their universities’ administrations as supportive of academic freedom. Thirty-three percent said academic freedom is supported “a great deal,” 39% said “quite a bit,” 22% “somewhat.” Only 5% said their administration supports academic freedom “a little” or 1% “not at all.”
The next figure shows how responses to this question vary between faculty at public versus private institutions. Confidence is higher among the private institutions, where 80% of faculty said their administration supports academic freedom “a great deal” or “quite a bit,” compared with 65% of faculty who said the same at public institutions. Conversely, 35% of faculty at public institutions indicated that their administrations support academic freedom only somewhat, a little, or not at all versus 20% at private universities. These differences may reflect the greater leverage that elected officials exercise over the budgets and policies of public institutions.
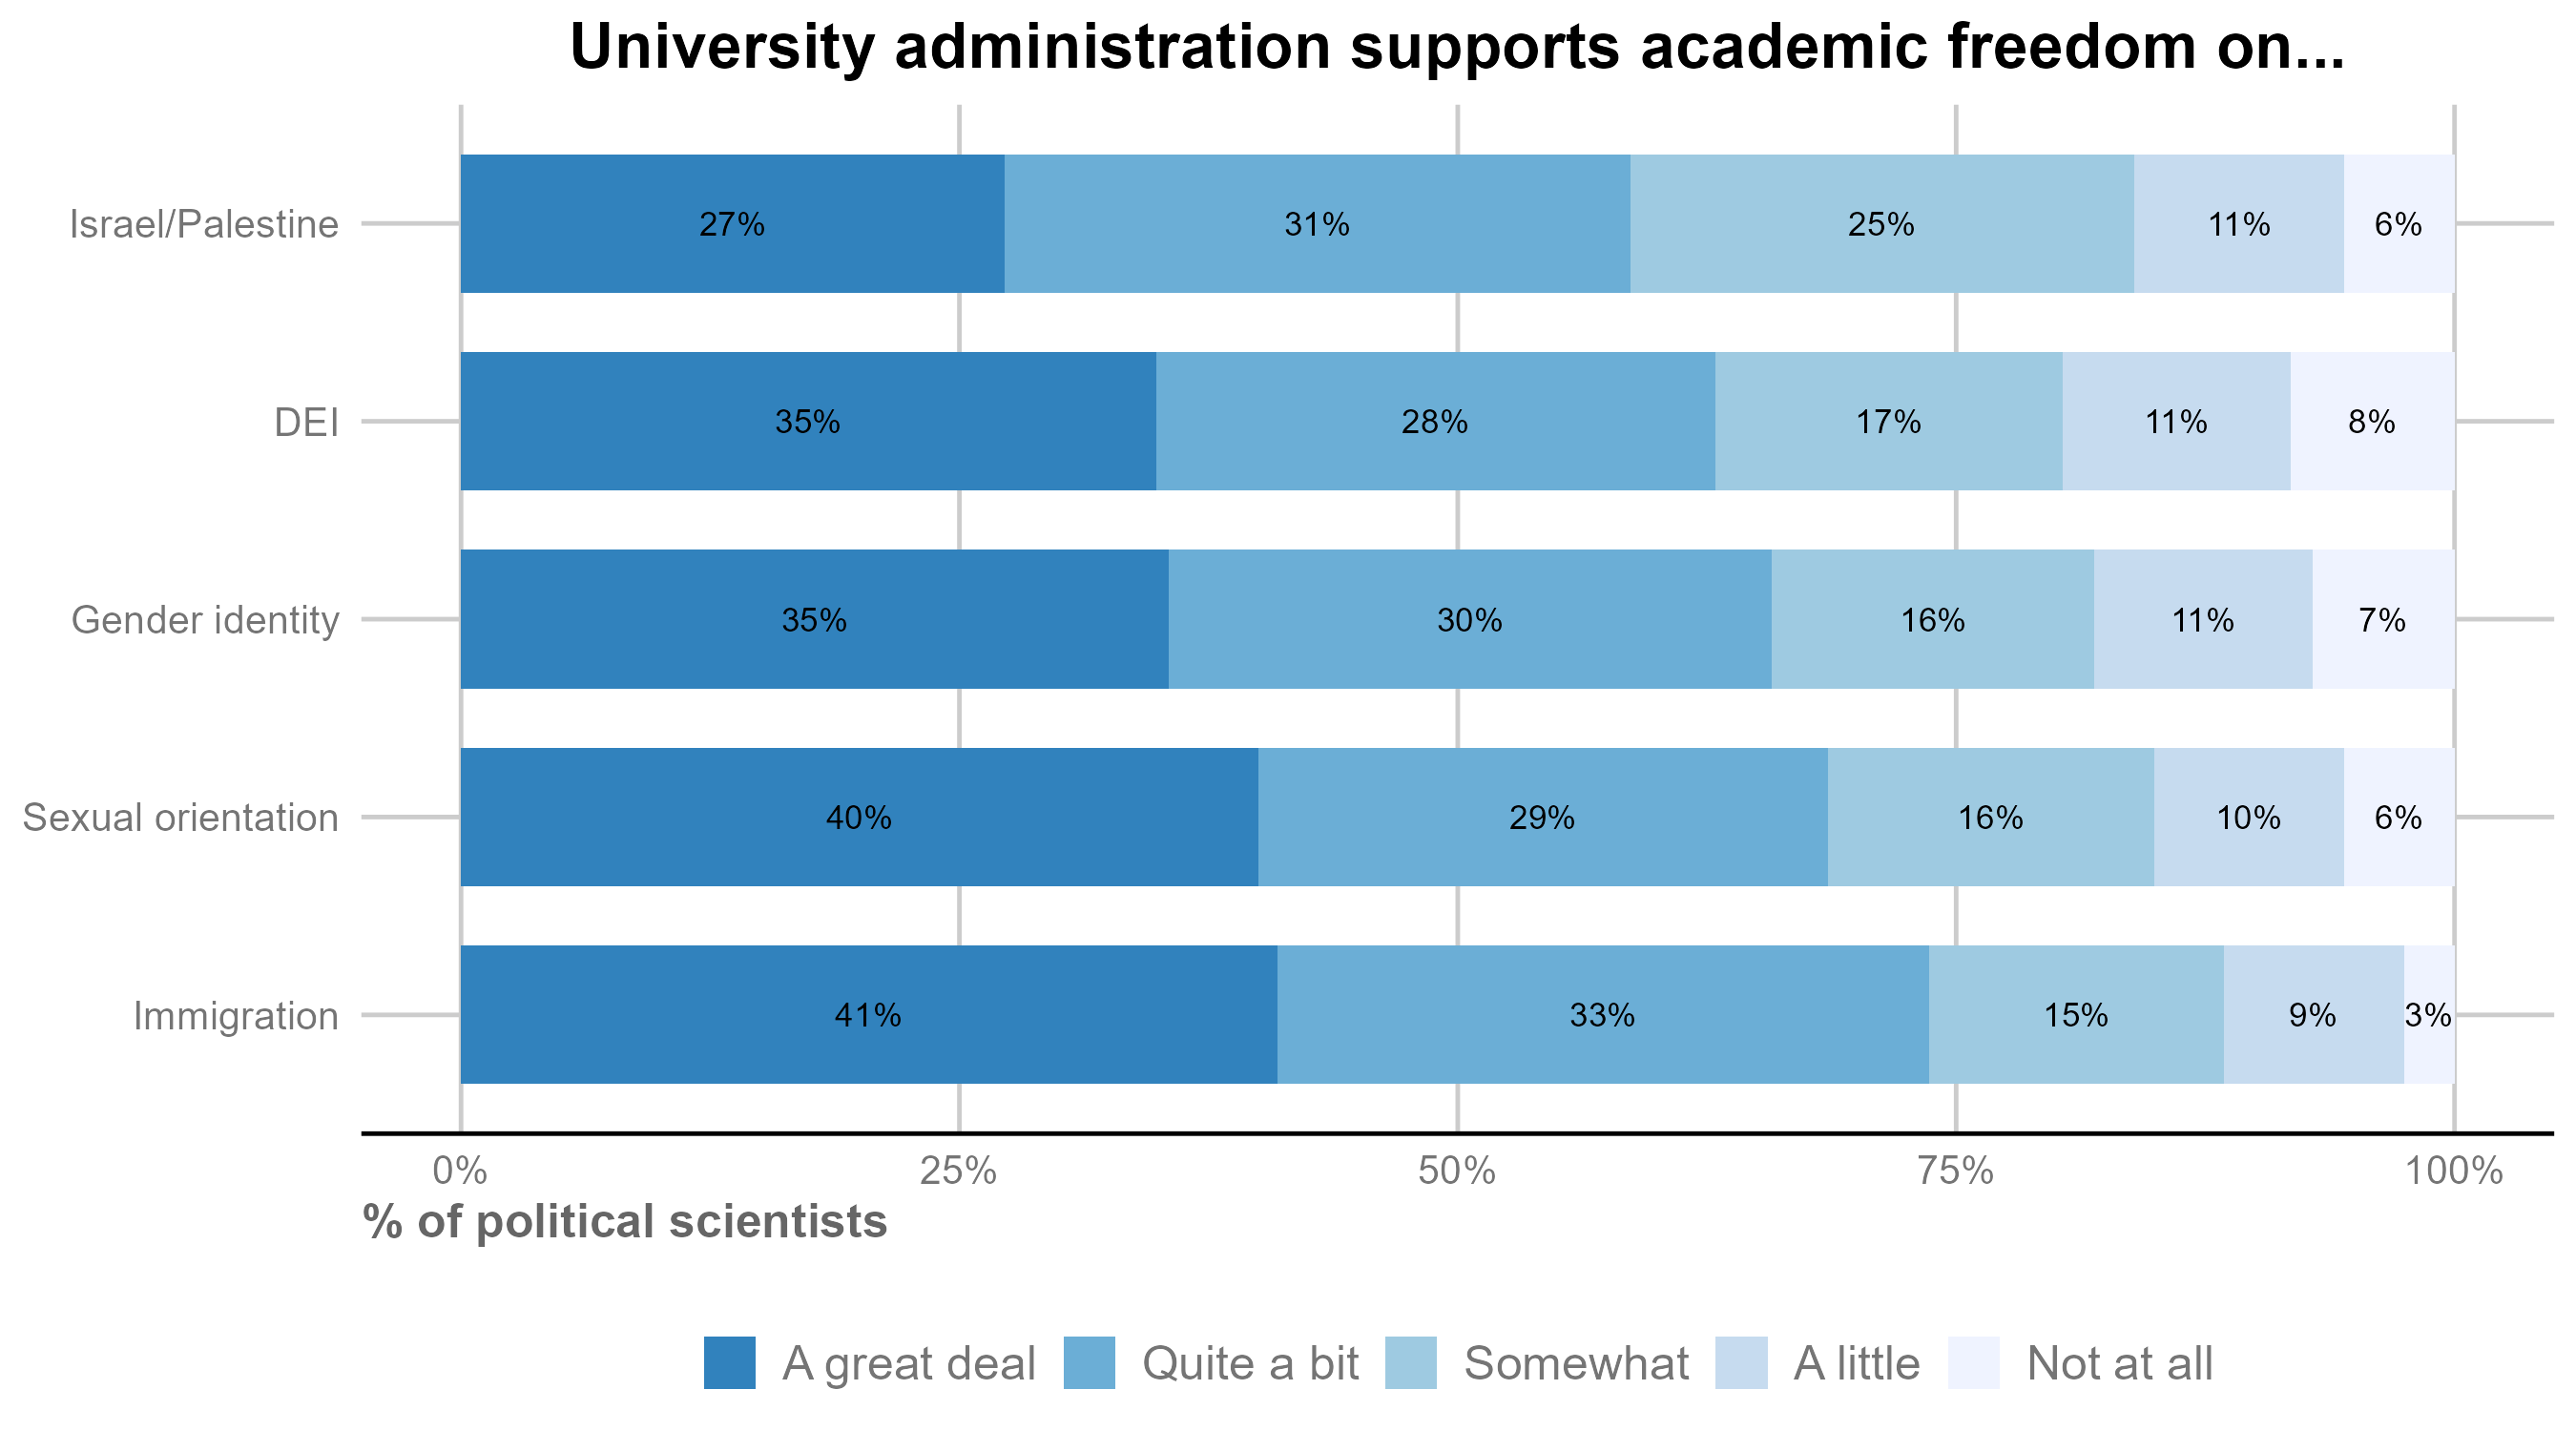
Finally, we returned to a (shortened) list of the controversial topics visited above and asked our faculty respondents to evaluate their university’s protection of academic freedom in those issue areas. For each topic, we asked respondents how much their university’s administration supports academic freedom. The next figure shows the percentages who regard university leaders as supporting academic freedom a great deal or quite a bit (as opposed to somewhat, a little, or not at all) for public versus private institutions.
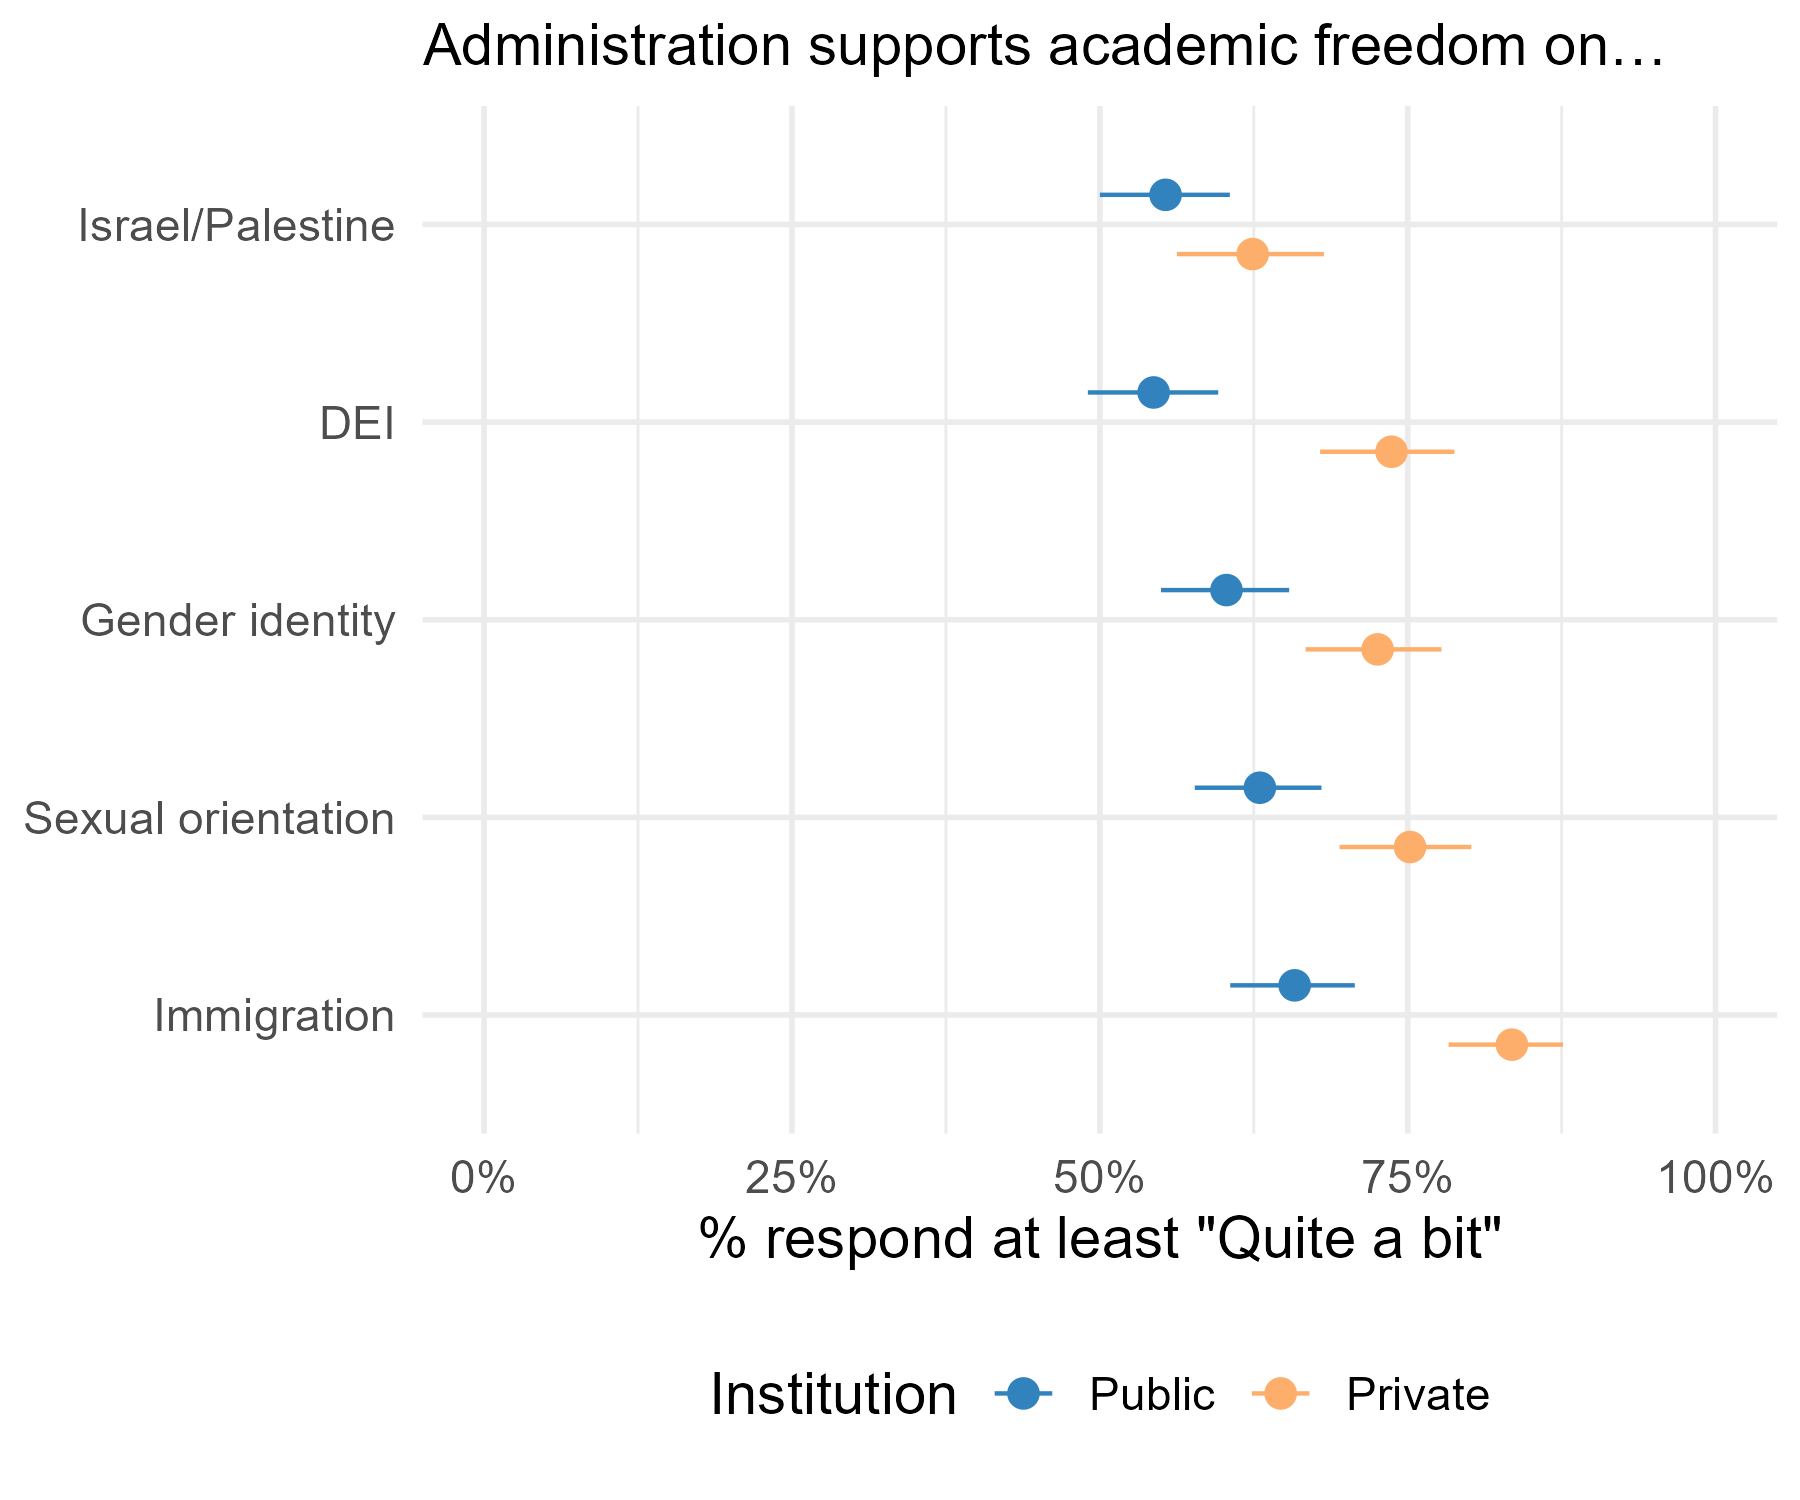
Faculty rate administrative support for academic freedom as similarly low on Israel/Palestine across both public and private universities. Perceived administrative support for academic freedom on DEI is also low at public institutions. More faculty say their administration is supportive of academic freedom on gender identity, sexual orientation, and immigration, especially at private institutions.
Appendix
Bright Line Watch conducted its twenty-fifth survey of academic experts (April 21–28) and its twenty-second survey of the general public (April 21–24). Our public sample consisted of 2,000 participants from the YouGov panel who were selected and weighted to be representative of the U.S. adult population. We also surveyed 760 political science experts across a diverse range of subfields. Our email list was constructed from the faculty list of U.S. institutions represented in the online program of the 2016 American Political Science Association conference and updated by reviewing department websites and job placement records from Ph.D. programs in the period since.
All estimates shown in the report used weights provided by YouGov. Our expert sample is unweighted. Error bars in our graphs represent 95% confidence intervals. Data are available here.
31 democratic principles
- Government officials are legally sanctioned for misconduct
- Government officials do not use public office for private gain
- Government agencies are not used to monitor, attack, or punish political opponents
- All adult citizens enjoy the same legal and political rights
- Government does not interfere with journalists or news organizations
- Government effectively prevents private actors from engaging in politically-motivated violence or intimidation
- Government protects individuals’ right to engage in unpopular speech or expression
- Political competition occurs without criticism of opponents’ loyalty or patriotism
- Elections are free from foreign influence
- Parties and candidates are not barred due to their political beliefs and ideologies
- All adult citizens have equal opportunity to vote
- All votes have equal impact on election outcomes
- Elections are conducted, ballots counted, and winners determined without pervasive fraud or manipulation
- Executive authority cannot be expanded beyond constitutional limits
- The legislature is able to effectively limit executive power
- The judiciary is able to effectively limit executive power
- The elected branches respect judicial independence
- Voter participation in elections is generally high
- Information about the sources of campaign funding is available to the public
- Public policy is not determined by large campaign contributions
- Citizens can make their opinions heard in open debate about policies that are under consideration
- The geographic boundaries of electoral districts do not systematically advantage any particular political party
- Even when there are disagreements about ideology or policy, political leaders generally share a common understanding of relevant facts
- Elected officials seek compromise with political opponents
- Citizens have access to information about candidates that is relevant to how they would govern
- Government protects individuals’ right to engage in peaceful protest
- Law enforcement investigations of public officials or their associates are free from political influence or interference
- Government statistics and data are produced by experts who are not influenced by political considerations
- The law is enforced equally for all persons
- Incumbent politicians who lose elections publicly concede defeat
- Universities, businesses, and professional organizations operate independently of government pressure
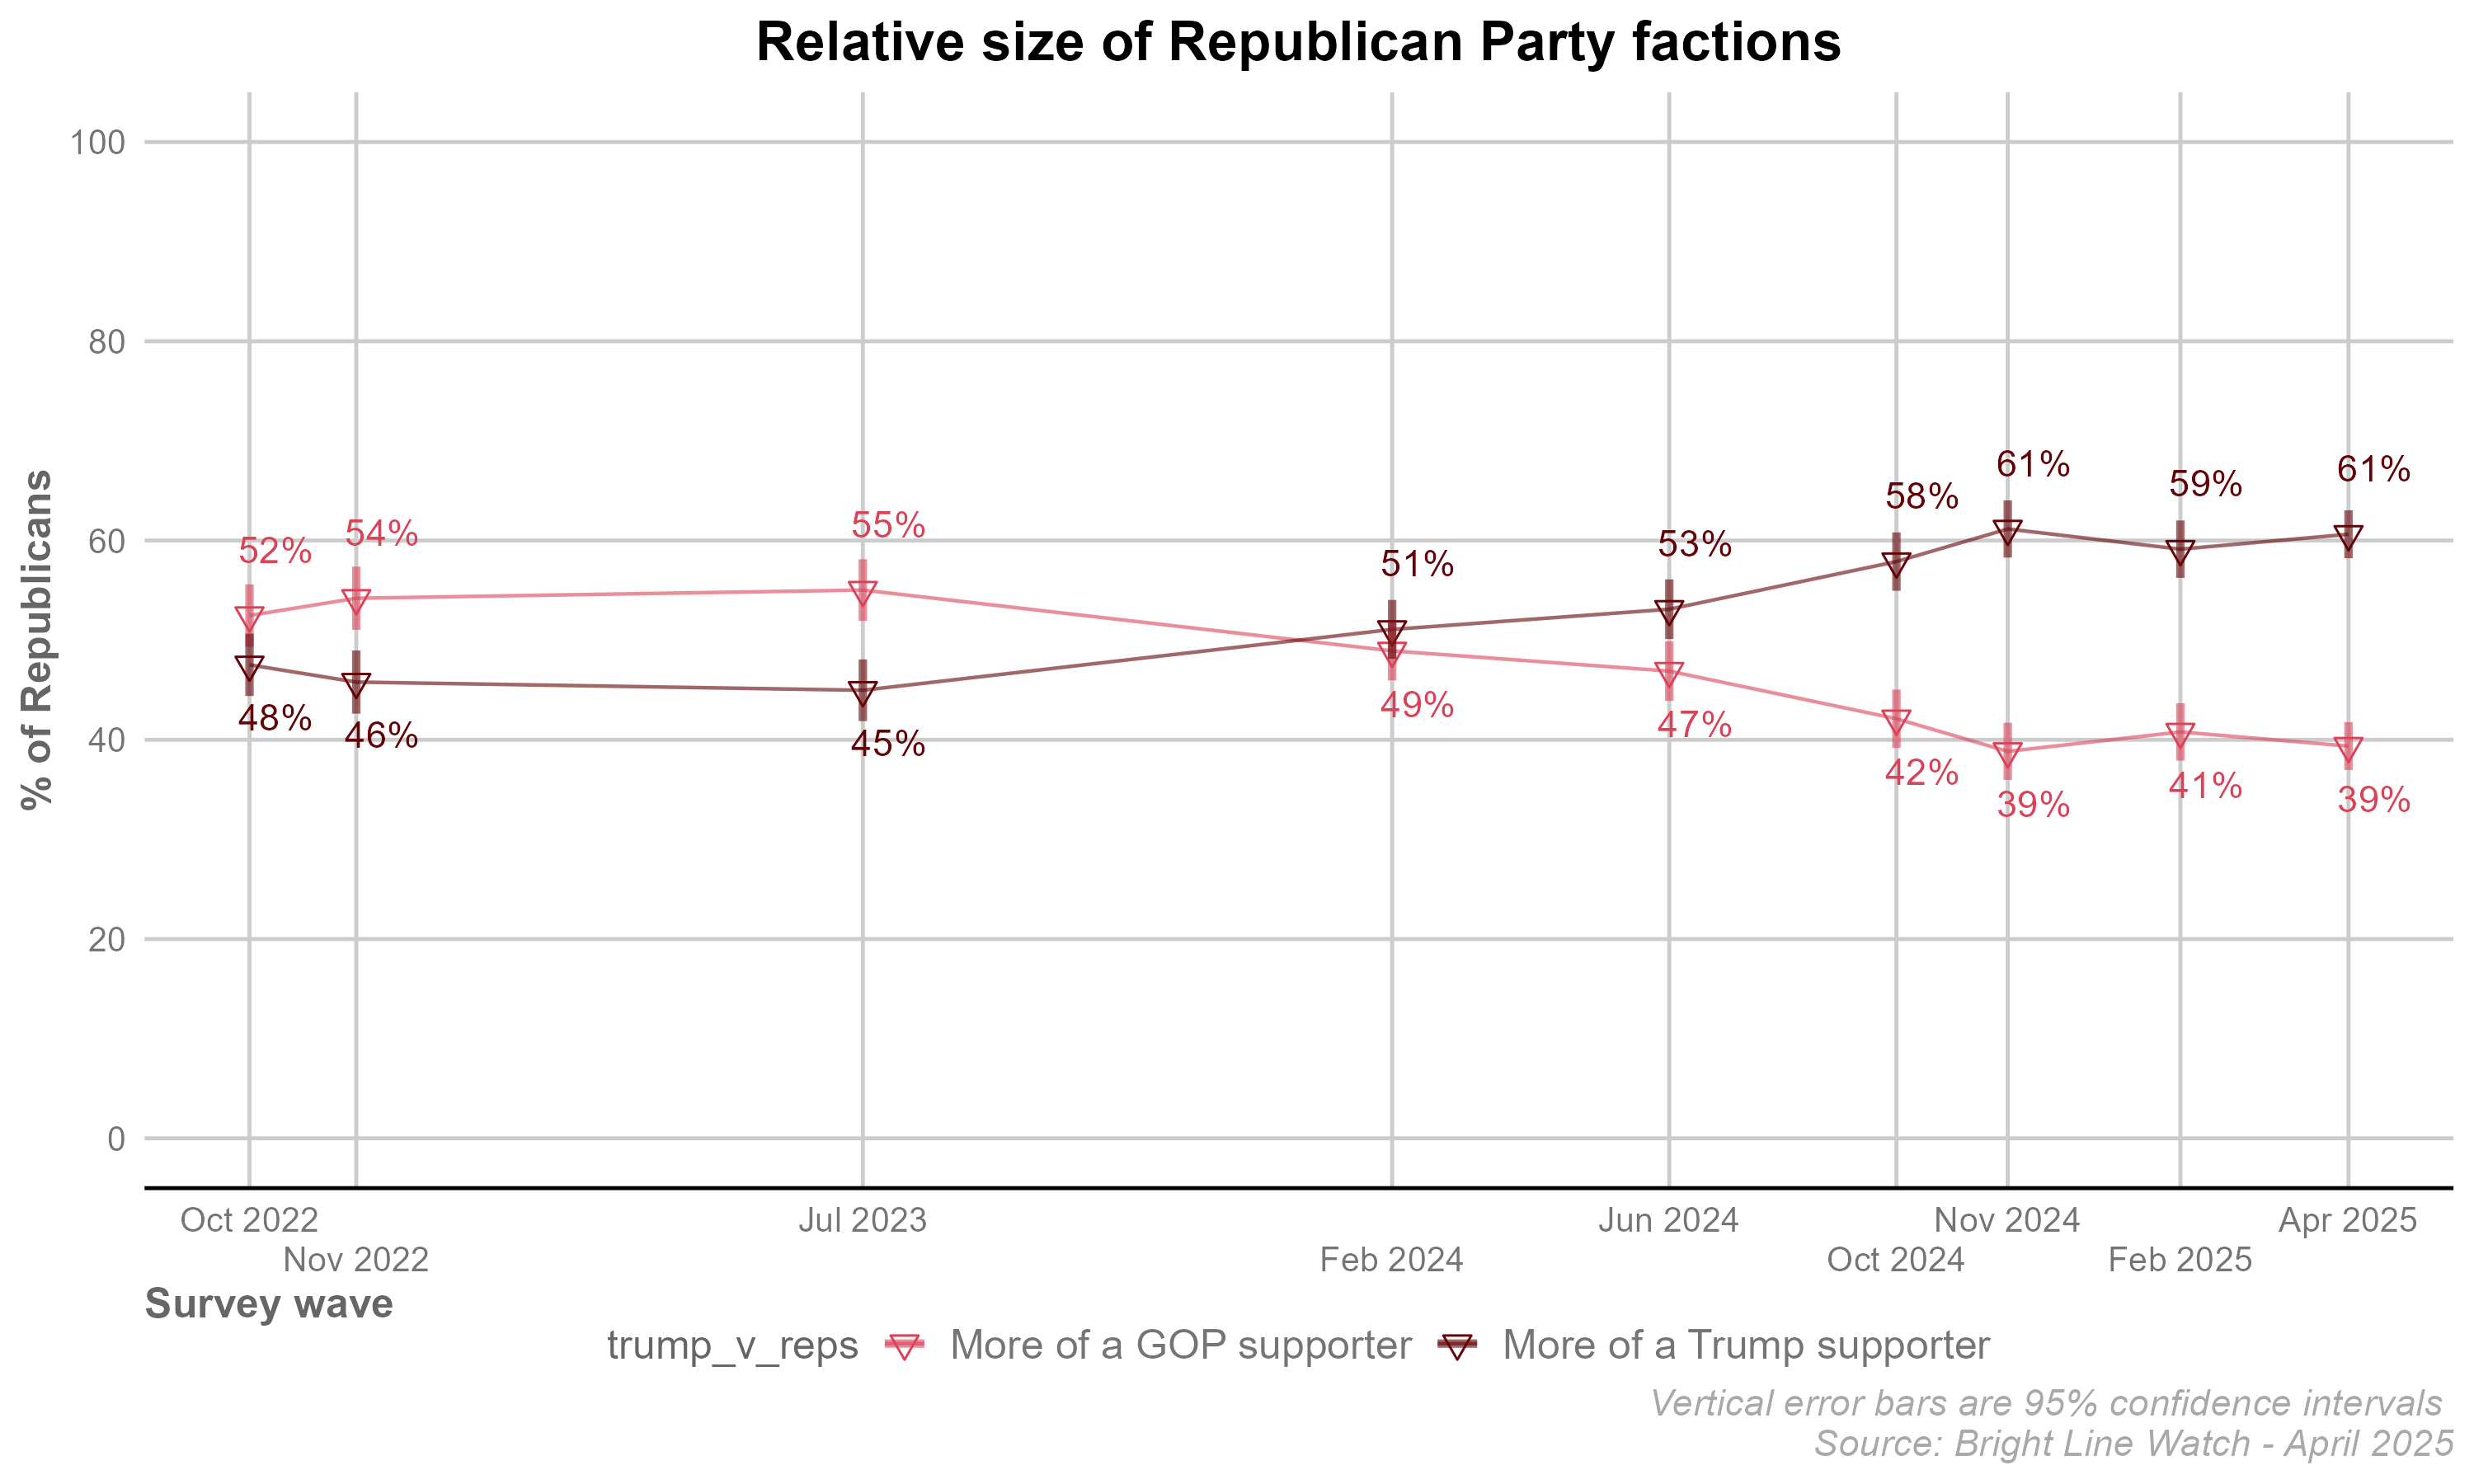
Size of Republican Party factions
Survey experiment on Columbia response to Trump administration pressure
We fielded our survey shortly after Harvard’s response to the Trump administration’s letter demanding changes to internal Harvard policies. We were curious about the potential for a contrast effect in which respondents who assess both university responses might rate Columbia’s acquiescence differently when it was juxtaposed with Harvard’s more defiant response. We therefore randomized our expert participants into two conditions: half assessed only Columbia’s response and half assessed both universities’ responses. The rate at which these groups rated Columbia’s response as a threat to democracy were statistically indistinguishable (82% Columbia only; 83% both schools), but the severity of the perceived threat from Columbia’s acquiescence differed. The figure below contrasts ratings of Columbia’s actions between participants who rated both universities and those who rated only Columbia.
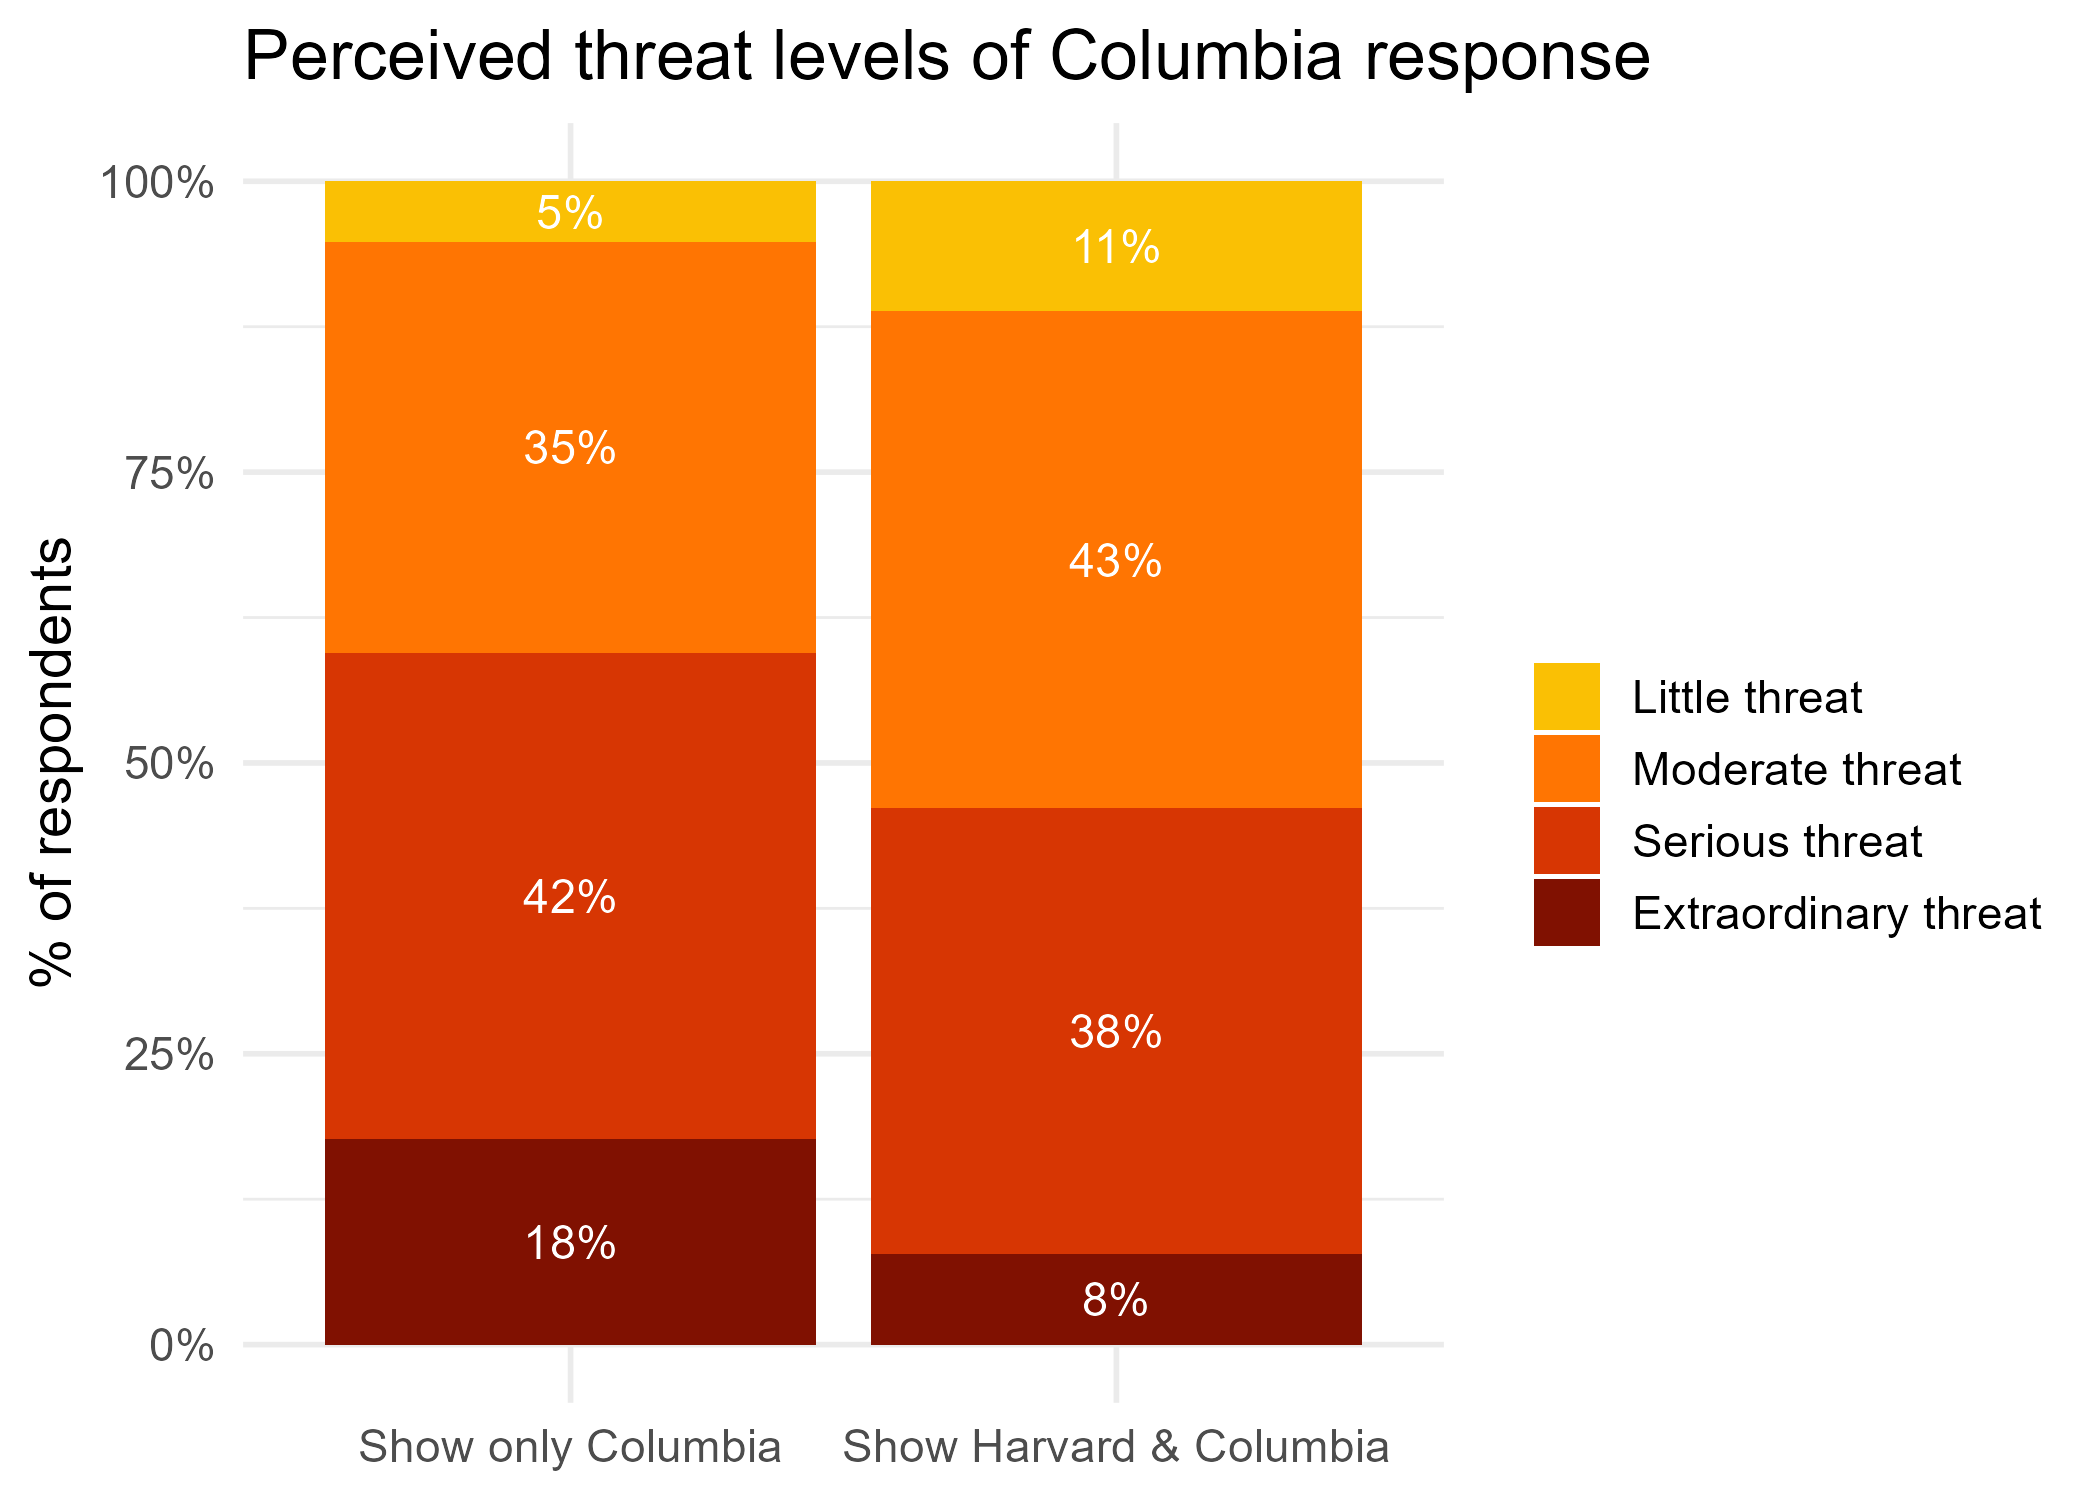
Interestingly, the reminder of Harvard’s defiance did not cause participants to judge Columbia more harshly. Participants who evaluated the responses of both schools to Trump administration pressure instead rated the democratic threat from Columbia’s response as less severe. They may have instead rated the overall threat to democracy as less severe and thus judged Columbia less harshly when reminded that other universities were not acquiescing.
Forecast

Antisemitism and DEI
- The projected rating for 2027 was not included in the public survey due to cost constraints
- Neither Canada nor Russia was rated in the July 2023 survey.
- President Trump’s direction to the Justice Department to investigate ActBlue took place while our survey was in the field. We added this item to the survey on April 25. As a result, we received fewer responses on it (45) than we did for other items.
- Our expert survey initially used arguably inflammatory language from the headline on the Polymarket forecast item (“Will Harvard University cave to Trump’s demands before June?”). A respondent alerted us to the language and we revised the survey. We discarded 4 responses on this item received before the change. We received 386 responses after the item was corrected.
- In addition, 77% would regard Abrego Garcia’s future release as beneficial to democracy, and 88% would see a democratic benefit to the federal judge in the Abrego Garcia case holding Trump administration officials or agencies in contempt for failing to comply with court orders in the case.
- Participants rated Columbia’s response somewhat more favorably when they rated it on its own instead of also rating Harvard’s response. Details are provided in the Appendix.
- BLW coordinates with the online forecasting platform Metaculus, which uses cash prizes and awards to incentivize accurate forecasts, to solicit forecasts to compare with those of our political science experts. The questions above were included as part of the POTUS Predictions tournament, which has a $15,000 prize pool. (The data reported in this report are only for Metaculus forecasts received during the expert survey period; see appendix for the distribution of response times for each item for expert and Metaculus forecasts.)
- Bright Line Watch invites survey participation from all faculty members at departments from which at least one faculty member appears in the program of a recent meeting of the American Political Science Association. “Political science” is the most common name for these departments, although at some institutions the same discipline is called “politics” or “government,” or might include reference to public policy, policy studies, international affairs, international relations, etc.
- A recent internal study from Harvard extensively documents experiences of antisemitism among members of that campus community and recommends preventive policy responses. A separate internal report, released concurrently, documented cases of anti-Muslim, anti-Arab, and anti-Palestinian bias at Harvard and recommends campus policies to address these problems.
- The appendix includes figures that show the full distribution of response options for each question for the respondents overall as well as for salient demographic subgroups.
- The original survey data are, as always, available on our website.
- Graham and Coppock show that, when directly asked to assess how much their attitudes have changed in response to some event, survey respondents tend instead to report their general level of support for the actor who is related to or responsible for the event. Graham and Coppock’s counterfactual question format provides a more reliable estimate of the marginal impact on attitudes of a change in conditions.
- Ideally, we would have used the two-step, counterfactual technique deployed above for estimating changes across each topic area, but due to limitations in survey space we relied on a single, direct question on each topic modeled on the Inside Higher Ed survey.