American democracy at the start of the Biden presidency
Bright Line Watch January-February 2021 surveys
U.S. democracy passed a milestone on January 20, 2021 with the inauguration of Joe Biden and Kamala Harris. Donald Trump’s presidency presented unprecedented challenges to this country’s democratic norms and practices. His role in a violent insurrection, sparking a second impeachment has fueled further debate over how to preserve American democracy and prevent further erosion. In this context, Bright Line Watch conducted its 14th expert survey and 11th public survey.
Bright Line Watch began its surveys in February 2017 during the first weeks of the Trump administration. The current surveys, which were fielded January 28-February 8, 2021, seek to measure the state of American democracy in the first days of the Biden administration. Yet, the country still lives in the shadow of the Trump legacy. As our results indicate, loyalties and antipathy toward Trump — whose Senate impeachment trial began immediately after the surveys were fielded — continue to shape the views of citizens and of government officials.
We asked our public sample about the importance they place on democracy, about the legitimacy of the 2020 election results and their confidence that votes were cast and counted fairly, and about how they regard Donald Trump. We also presented them with a candidate-choice survey experiment designed to measure the effect of candidates’ positions on the 2020 election and of Trump’s impeachment on support for Republican candidates for office. Finally, we asked respondents to contemplate the dissolution of the United States — a prospect that has been broached increasingly frequently in recent months — and measured their commitment to the union.
We asked our experts to evaluate 16 proposed reforms that are intended to improve the quality of American democracy. We also asked them to evaluate a number of events that occurred between November and January in terms of their importance, their (ab)normality, and the potential threat they pose to democracy. As in previous surveys, we asked both experts and the public to assess the quality of U.S. democracy overall and to rate its performance on 30 distinct democratic principles. In this wave, we also asked respondents to rate the importance of each principle to democracy.
We report a number of key findings below from the public and experts we surveyed:
Public
-
Partisan differences on the 2020 election and on legal and political accountability for former President Trump are profound. Democrats trust the election results, support disqualifying Trump from holding office, and believe he should face criminal prosecution. Republicans distrust the election results and favor moving on without consequences for Trump. Independents are split.
-
A candidate choice experiment reveals cross-party consensus on government spending for COVID relief but stark polarization over certification of the presidential election and impeachment, with Republicans punishing Republican candidates for crossing the party line on either issue.
-
When presented with a proposal for their region to secede from the United States, almost one in three Americans (29%) are willing to entertain the prospect. Republicans (33%) support secession more than Democrats (21%), but Democrats are more amenable to secession than Republicans in areas where they tend to hold power.
Experts
-
The experts overwhelmingly favor a set of reform proposals to expand voting participation, tighten campaign finance regulation, and modify how electoral districts are configured and how votes are cast. They also favor abolishing the Senate filibuster and imposing term limits on Supreme Court justices but reject compulsory voting.
-
We find that prior expert forecasts about the election and the presidential transition, which reflected deep skepticism about President Trump’s likely actions, were largely on target.
-
Experts rate the January 6 insurrection and President Trump’s pressure on state-level officials to overturn the election as among the most abnormal and important events of the Trump presidency. Our experts overwhelmingly regard these events and the votes by a majority of Republican lawmakers in Congress not to certify the presidential election results as grave or serious threats to American democracy.
Experts and public
-
Overall estimates of democratic performance rose among experts since October 2020.
-
Ratings of democracy reversed between those who approve of President Trump and those who disapprove of him. Approvers had rated U.S. democracy higher than disapprovers since 2017, but that pattern inverted in January 2021. As a result of these offsetting changes, public ratings of U.S. democracy did not change.
-
Those who approve of Trump have increased the priority they place on judicial independence relative to prior surveys. Those who disapprove of Trump downgraded the importance of protections for free speech, preventing politically motivated punishment by government agencies, and allowing all parties to participate in elections.
Public survey
Election confidence
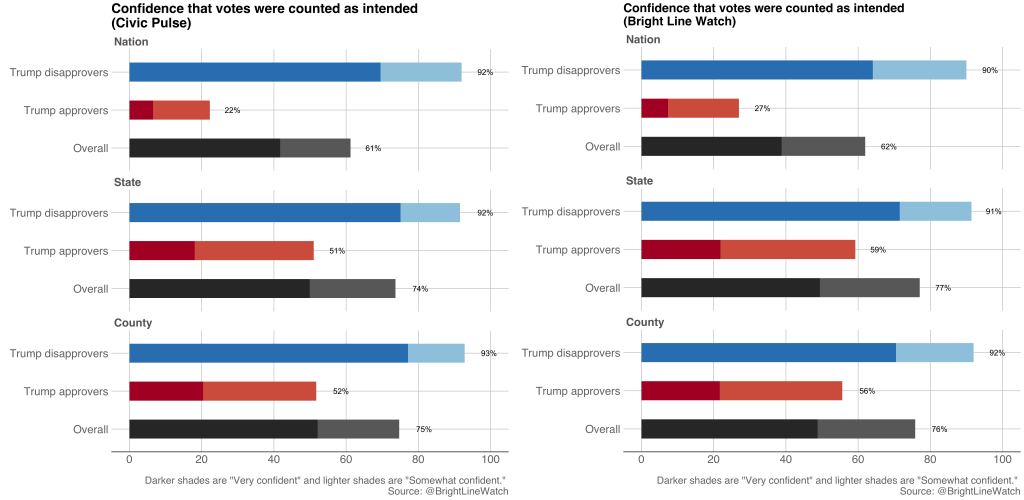
As in our October and November 2020 surveys, we asked public respondents how much confidence they had in the election results. In this survey wave, Bright Line Watch also partnered with CivicPulse to survey 212 local government policymakers from across the country on election confidence. Both the public and local officials were asked “How confident are you that the votes for the 2020 presidential election were counted correctly in [your county, your state, the US overall]?”1 Our goal was to test whether local officials — who played a key role in the 2020 election — would be better informed than the public about the integrity of the electoral system.
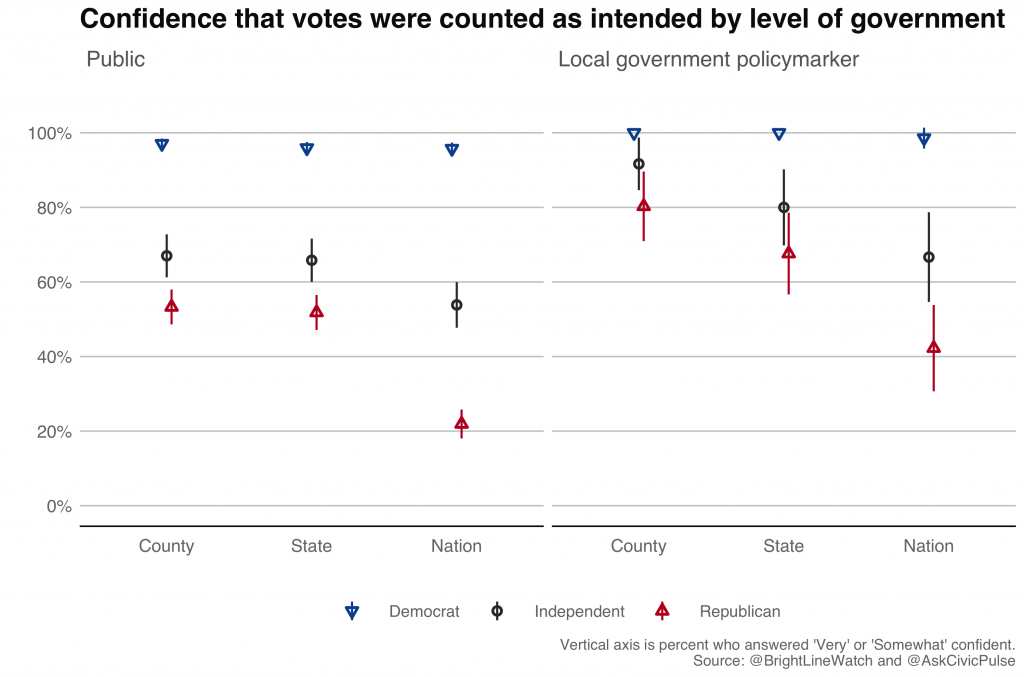
We note several key findings. First, across both the public and the CivicPulse sample of local policymakers,2 Democrats exhibit greater confidence in electoral administration than do Republicans or independents at every level of government (county, state, national). Second, in both samples, confidence in electoral administration is higher at levels of government closer to home. Confidence in county-level and state-level vote counts are far higher than confidence in aggregation at the national level among independents and, particularly, among Republicans.
Local policymakers are also more confident than the public that votes were counted correctly. This is marginally true among Democrats, although confidence is so high among the Democratic public sample that the potential for difference is limited. Among Republicans and independents, we observe substantially greater confidence among the CivicPulse sample of public policymakers than among the public, but this difference is measured versus a baseline of low confidence. For instance, 42% of Republican public policymakers express confidence in the integrity of the national-level results compared to only 22% of Republicans in the public.
Trump’s liability and accountability
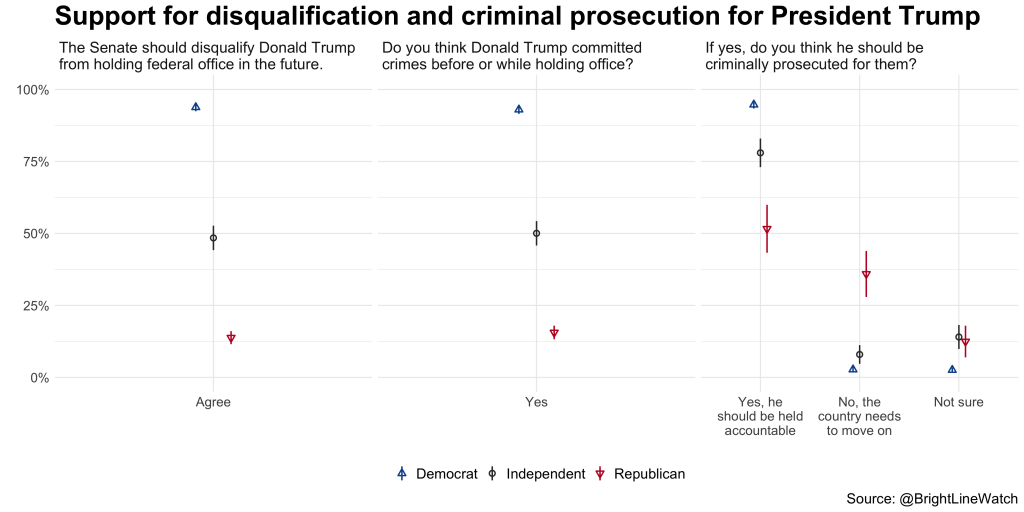
Our public survey also asked if the former President should be disqualified from holding office and whether he committed any crimes before or while holding office. The figure below plots these results, which were collected immediately prior to Trump’s second Senate impeachment trial, by respondent party affiliation. For both disqualification and criminality, responses from Democrats and Republicans are diametrically opposed. Virtually all Democrats support disqualification and think Trump committed crimes before or while in office (94% and 93%, respectively) whereas only 14% and 16% of Republicans, respectively, agreed. Among the 93% of Democrats who believe Trump to be criminally liable, 95% want him prosecuted (thus, 88% of Democrats overall). By contrast, opinion is divided about whether Trump should be criminally prosecuted among the few Republicans who think he committed crimes: 52% (only 8% of Republicans overall) say that he should be held accountable whereas another 36% (or 6% overall) believe the country should move on. Independents — who comprise 21% of our sample — are split between the partisan groups, with 49% favoring Trump’s disqualification and 50% saying Trump committed crimes. Among the latter group, the vast majority (78% — or 39% of all independents) want Trump prosecuted.
Candidate choice experiment
These results reveal profound partisan divides over the election and the forms of accountability that Donald Trump should face. However, they do not reveal the extent to which these considerations factor into the choices voters make among candidates. In particular, they do not indicate whether Republicans who break from the majority of their party will face punishment for upholding the integrity of the election or voting to hold Trump accountable in the impeachment process. It is also important to determine the relative importance of these matters versus other concerns (e.g., COVID).
To better understand these choices, the public survey included a candidate choice experiment in which respondents were asked to choose between a series of paired hypothetical candidates “in an upcoming election.” Each candidate was defined by a profile consisting of a set of personal attributes and stances, including their name (which signaled both gender and race/ethnicity), their partisanship, and their positions on government spending for COVID relief and transportation infrastructure, certification of the 2020 presidential election results, and Trump’s impeachment.
Because Democrats uniformly support certification and impeachment, we only tested support for certification and impeachment among hypothetical Republican candidates who might plausibly take different positions. Thus, a respondent might be asked to choose between a white Republican woman who favored both spending bills, supported certification, and opposed impeachment and a black Republican man with similar positions on the spending bills who opposed both certification and impeachment. Each respondent chose among three pairs of candidates whose attributes (except partisanship) were randomly assigned. The design allows us to estimate the effect of each attribute in the candidates’ profiles — for example, their race, their gender, or their stance on impeachment — on the probability that the respondent would support him or her. The design also allows us to estimate how much the effect of candidate attributes on vote choice differs between different types of respondents. For example, we can estimate the difference in effects of supporting certifying the election results between Democrats and Republicans.
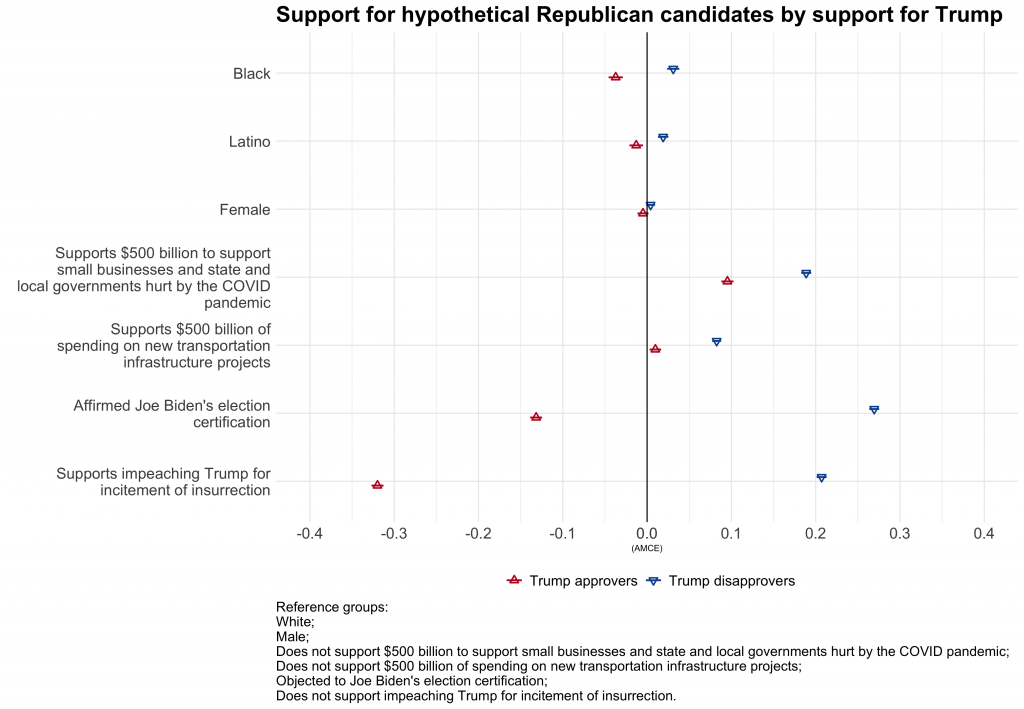
The figure below shows the marginal effect of a candidate’s race/ethnicity (Black, Latino, or white), gender (woman or man), and policy positions (supporting COVID relief, transportation spending, election certification, and impeachment) on the likelihood of preferring one Republican candidate over another for Democrats, Republicans, and independents.3 The estimate for each item, which is known as the Average Marginal Component Effect, can be interpreted as the change in likelihood of voting for that candidate, all else equal, if the candidate moves from the baseline category to the category listed in the figure. Thus, the estimates for Black show the difference in the probability of supporting a candidate who is Black rather than one who is white. Most importantly, the estimates for policy position show the effect of shifting from opposition to support on each item — e.g., from opposing impeachment to supporting it.
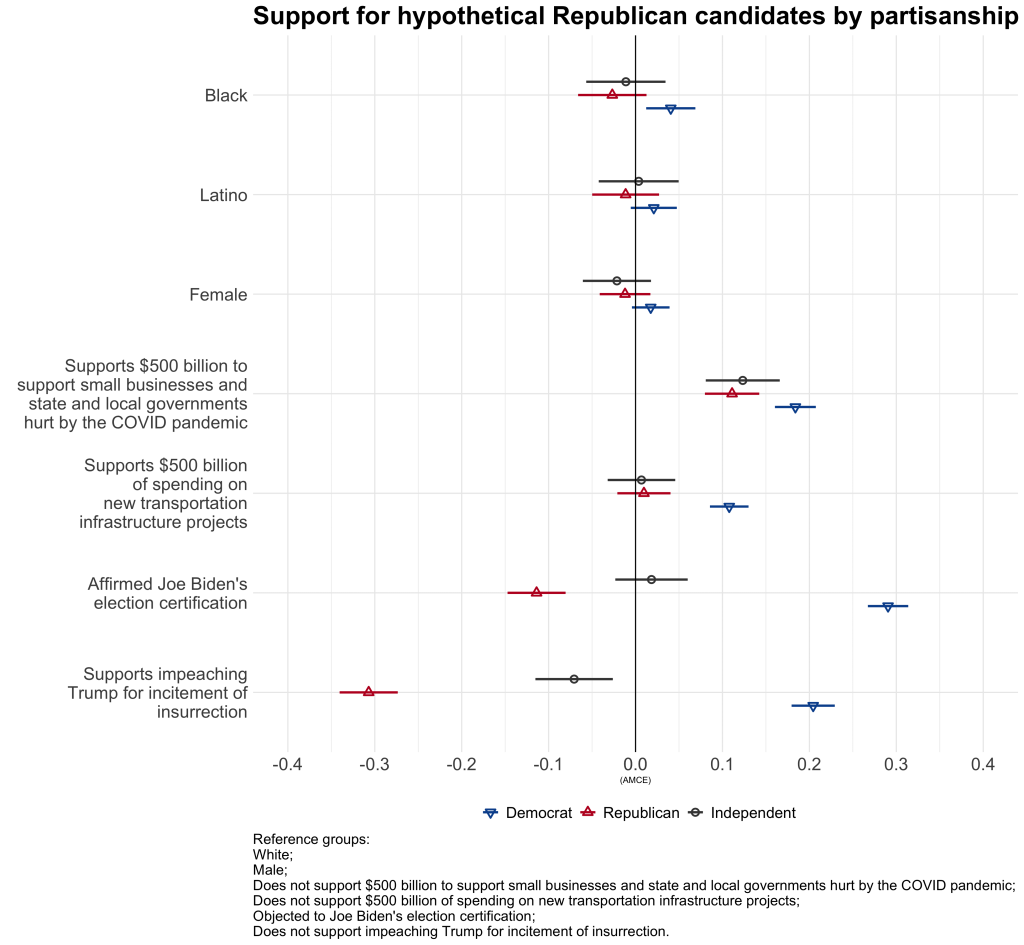
Starting with demographics, we can see that Democrats are about 4 percentage points more likely to favor a Black candidate over a white candidate, other things equal, whereas Republicans are about 3 points less likely to select a Black candidate (we find no measurable effect for independents). The effects are similar for Latinos relative to whites though smaller in magnitude (+2 points for Democrats and ‑1 point for Republicans). On gender, we find Democrats slightly favor female candidates (2 points) while Republicans and independents slightly favor males (-1 and ‑2 points, respectively).
Policy effects dwarf demographic ones. Spending on COVID relief attracts strong bipartisan support. Republicans favor a candidate who supports a $500 billion appropriation over one who opposes it by 11 points, independents by 12 points, and Democrats by 18 points. Infrastructure spending is less consensual but it is not polarized. Democrats favor candidates who support infrastructure spending (11 points). Republicans and independents are indifferent between a candidate who supports infrastructure spending and one who does not.
In sharp contrast to these relatively bipartisan responses, positions on Trump drive huge partisan polarization. Democrats are vastly (29 points) more likely to support candidates who affirm certification than one who opposed it. Republicans, by contrast, favor candidates who oppose certification over those who support it by 11 points. Backing impeachment increases support among Democrats by 20 percentage points, but decreases support among Republicans by 30 points. These penalties underscore the political risks for Republicans in Congress who buck their party base and express opposition to Trump’s challenge to a democratic election.
The responses of independents suggest ambivalence on these crucial items. They lean toward candidates who supported certification (by 2 points, although the effect does not reach statistical significance) but disfavor those who supported impeachment (-7 points). In its intended voting behavior, at least, this pivotal constituency appears not to have embraced the narrative that the election was stolen, but to endorse the idea that the country should move on rather than use impeachment to hold Trump accountable for the January 6 attack on the Capitol.4
Secession
We asked respondents, for the first time, their views about a scenario in which the United States would break up into more than one country. Secession is a genuinely radical proposition. Until recently, we would have regarded it as too marginal to include in a survey. But state legislators in Mississippi and Texas and state GOP leaders in Texas and Wyoming have openly advocated secession in recent months, prompting us to design two survey items to gauge perceptions of this idea.5 We caution that these survey items reflect initial reactions by respondents about an issue that they are very unlikely to have considered carefully.
Our first question is generic and framed in terms of reducing conflict:
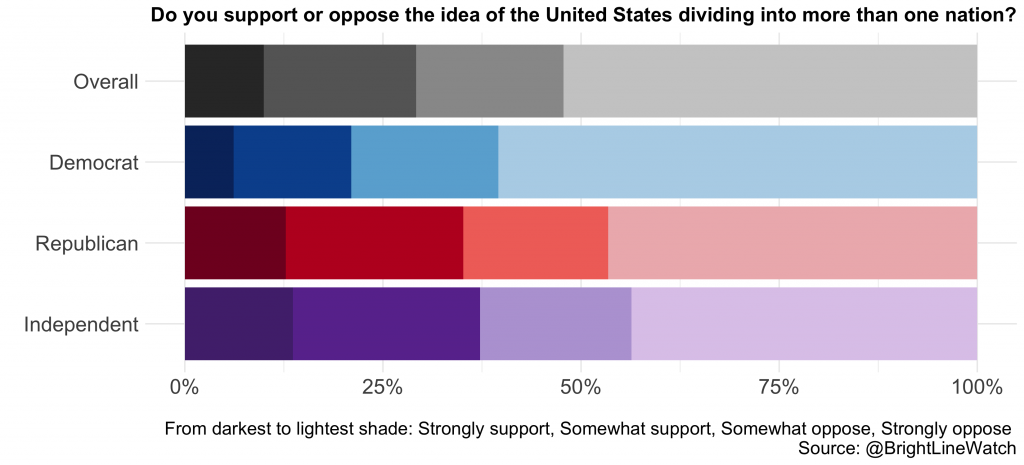
“Some people say the divisions within our country have grown so deep that we would be better off dividing into more like-minded regions that would govern themselves separately. Do you support or oppose the idea of the United States dividing into more than one nation?”
Overall, 29% of respondents supported the dissolution of the country into like-minded regions (10% strongly, 19% somewhat). Support was highest among Republicans (35%) and independents (37%) compared to only 21% among Democrats. Though most Americans reject the prospect of secession, these results at least suggest that a substantial minority of people do not instinctively reject the idea.
The results above may reflect the wording of the question, which frames dissolution as a way to mitigate conflict. We therefore also asked about secession in a more concrete manner that outlined the geographical and political reality respondents would face as a result of secession:
“Would you support or oppose [your state] seceding from the United States to join a new union with [list of states in new union]?”
We constructed five prospective new unions and inserted the relevant states for respondents into the question wording above. For example, a participant from California in our survey would be asked about joining a new union along with Washington, Oregon, Hawaii and Alaska. These sets are provided below:
- Pacific: California, Washington, Oregon, Hawaii, and Alaska
- Mountain: Idaho, Montana, Wyoming, Utah, Colorado, Nevada, Arizona, and New Mexico
- South: Texas, Oklahoma, Arkansas, Louisiana, Mississippi, Alabama, Georgia, Florida, South Carolina, North Carolina, Virginia, Kentucky, and Tennessee
- Heartland: Michigan, Ohio, West Virginia, Illinois, Indiana, Minnesota, Wisconsin, Iowa, Missouri, North Dakota, South Dakota, Kansas, and Nebraska
- Northeast: Maine, New Hampshire, Vermont, Massachusetts, Rhode Island, Connecticut, New York, New Jersey, Pennsylvania, Maryland, Delaware, and the District of Columbia
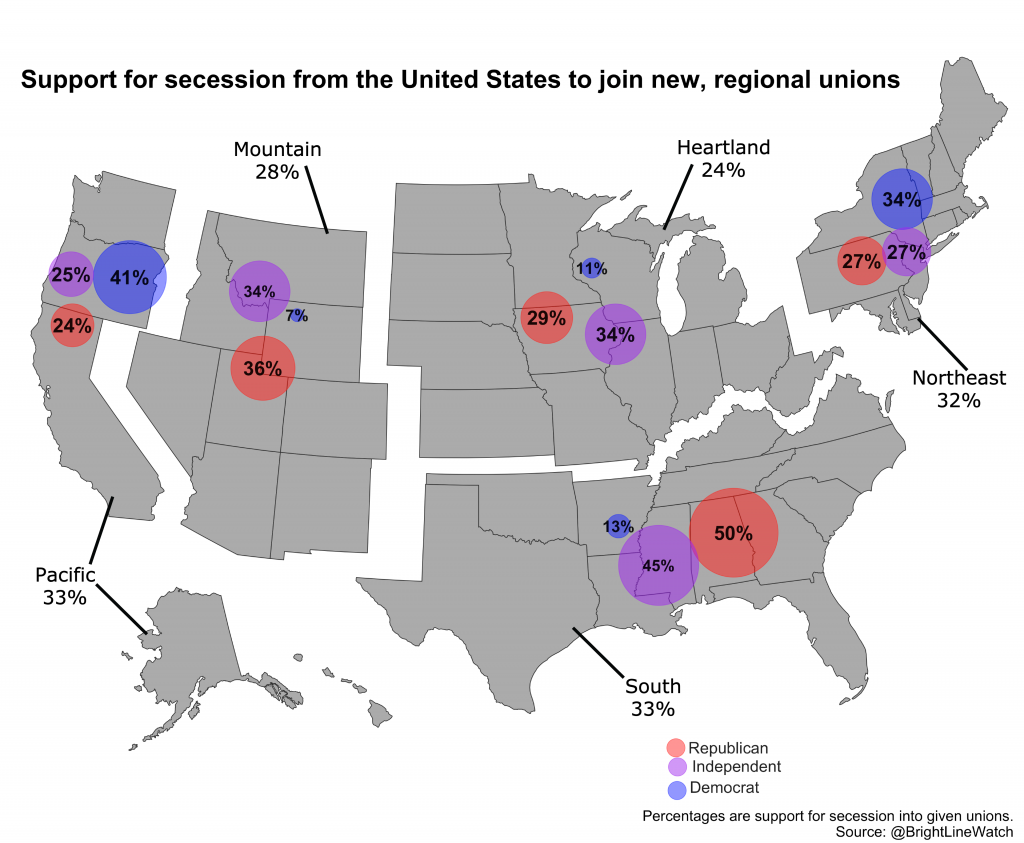
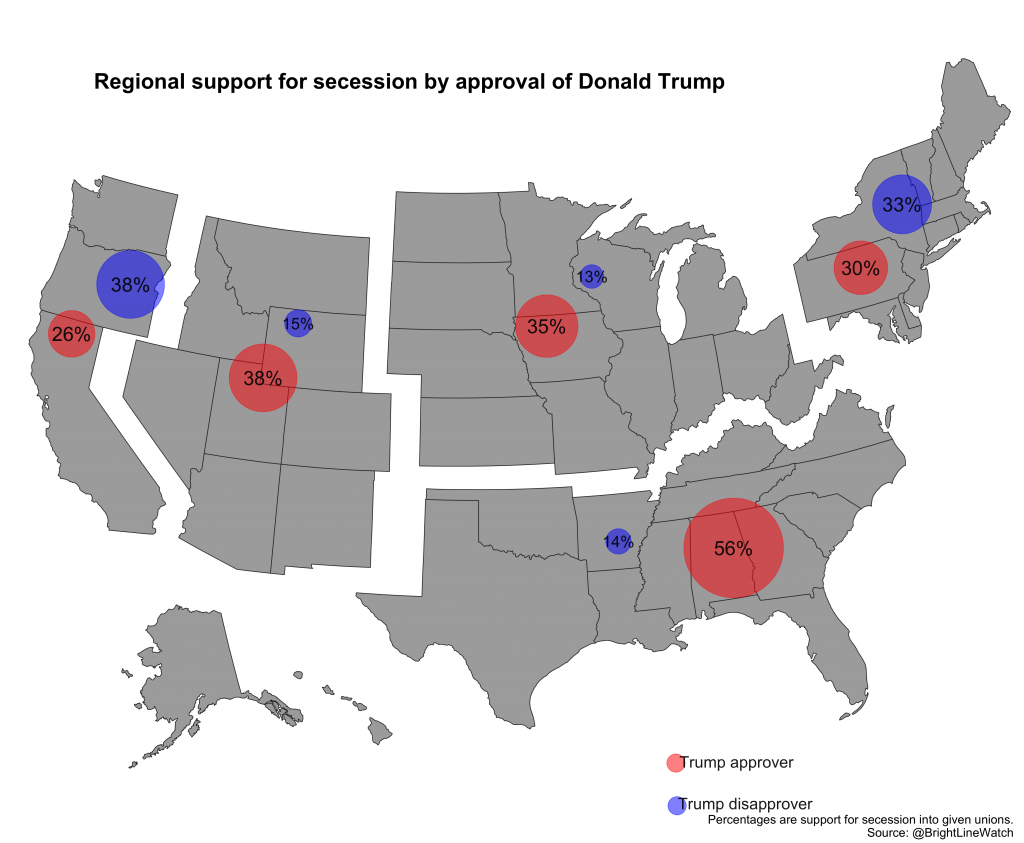
Support for secession under the specific hypothetical unions format is illustrated in the map below.6 The support levels are, again, non-trivial — as high overall as in the like-minded regions question. The three regions with coastlines exhibit the most openness to splitting from the union, with the South and West at 33% overall and the Northeast just behind at 32%. The landlocked Heartland and Mountain regions come in at 24% and 28%, respectively.
Support also corresponds with regional partisan context. In the Pacific and Northeast regions, both of which are deep blue and could be expected to be dominated by the Democratic Party (or its post-secession descendants), Democrats favor secession most, followed by independents and Republicans. In the deep red Mountain and Southern regions, that pattern is reversed with Republicans most amenable to secession. In the Heartland, a collection of mostly red states that also includes purple Michigan, Minnesota, and Wisconsin, independents are the group most inclined toward secession.
The unwillingness of respondents to reject secession outright is widespread and context-dependent. Republicans express greater support for secession overall than Democrats, but Democrats are more amenable to secession than are Republicans in regions they dominate.
Democracy versus alternatives
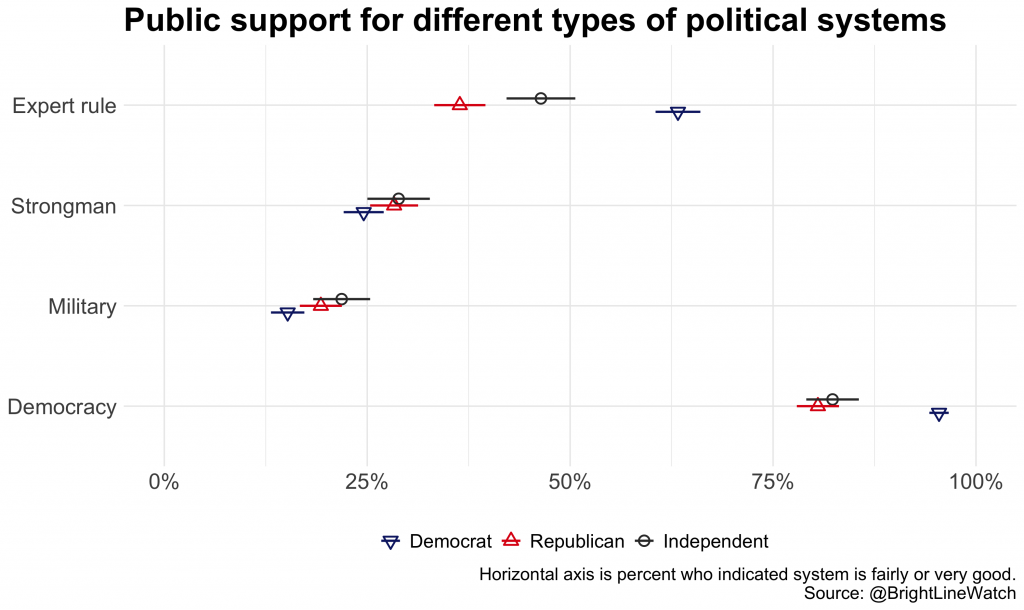
We asked our public sample about their support for four broad types of political rule, which we summarize as:
- expert rule (“Having experts, not the government, make decisions according to what they think is best for the country”),
- strongman (“Having a strong leader who does not have to bother with Congress and elections”),
- military (“Having the army rule”), or
- democracy (“A democratic political system”).
The figure below shows the percentages of each partisan group regarding each regime type as “fairly” or “very good” rather than “fairly” or “very bad.” Among Democrats, Republicans, and independents alike, democracy is the most favored regime, though Republicans and independents demonstrate less uniform support than do Democrats (81% and 82% versus 94%, respectively). Relatively small shares of each group favor strongman rule and even smaller numbers would welcome military rule — and importantly, the differences across partisan groups on these options are statistically insignificant. Strikingly, Democrats (63%) find rule by experts far more palatable than do Republicans (36%), a finding that may reflect past demands by their party to give greater priority to experts in the response to the COVID-19 pandemic. On the whole, although Republicans show slightly less commitment to democracy than Democrats, they show no greater affinity for non-democratic options and less appetite for rule by experts.
Expert survey
Reform proposals
We asked our experts to assess 16 prominent reform proposals that aim to improve the quality of American democracy. Many of the proposals are drawn from the Our Common Purpose project that was coordinated by the American Academy of Arts and Sciences. Each expert participant was asked to rate eight randomly drawn proposals. The full set of statements describing each reform is in the Appendix. The figure below shows expert support and opposition for each proposal.
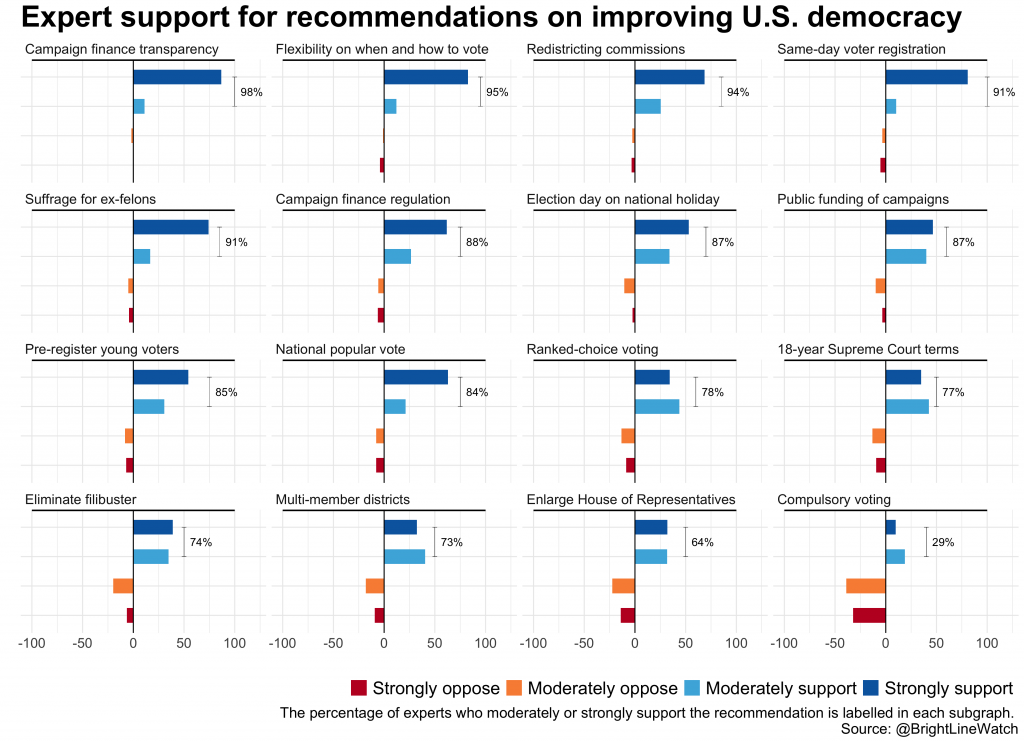
Experts overwhelmingly support the proposed reforms. Of the 16 we tested, majorities of our expert respondents strongly supported 9 and strongly or moderately supported 15. The only proposal that did not garner majority support was compulsory voting.
The proposals fall into distinct categories. The largest group aims to increase voter participation, particularly among traditionally marginalized groups. Increasing flexibility on when and how ballots can be cast (95% support), guaranteeing suffrage rights to ex-felons (91%), same-day registration (91%), moving Election Day to a national holiday (87%), and pre-registering young voters (85%) all attracted support from more than four in five experts. By contrast, compulsory voting was supported by only 29% of experts, perhaps reflecting discomfort with the manner by which it tries to increase participation as well as recent research on the range of unintended consequences it can generate, including disillusionment with democracy itself.
Another group of proposals seeks to reduce the influence of large individual and corporate campaign donors in American elections. These include increased transparency on the source of donations, providing public campaign funding, and amending the Constitution to impose greater restrictions on private spending. All these garner strong support among the experts (98%, 87%, and 88%, respectively).
A third set of proposals focuses on the rules for converting voter support into representation. At the top of this list is requiring states to establish non-partisan redistricting commissions to reduce partisan gerrymandering (95% support). Next, at 84%, is support for switching to a system in which the president is elected by direct popular vote instead of by the Electoral College.7 Also in this category are two electoral reforms, ranked-choice voting (78% support) and eliminating the requirement for Members of Congress to be elected from single-member districts (73%), both of which aim to open paths to electoral success for candidates other than those who can prevail in either Democratic or Republican primary contests.
In turn, enlarging the House of Representatives (64%) would increase the ratio of representatives to citizens, allowing for a more fine-grained mapping of representatives’ characteristics onto constituent preferences.
The last two proposals focus on the conduct of governance rather than elections. The first would limit the period for which federal judges could serve on the Supreme Court to 18 years (77% support), guaranteeing a vacancy on the Court every two years. This proposal seeks to reduce the stakes for high court appointments and thereby cool the attendant politics both during elections and in the day-to-day operation of the Senate. The next would eliminate the 60-vote requirement to suspend debate in the Senate, eliminating the filibuster and effectively returning the chamber to majority rule (74%).
Democratic nightmares (which came true, which did not)
In our November 2020 survey, the experts offered probabilistic forecasts about a set of potential events in the weeks following the election through inauguration. With the new administration in place, we can now assess the accuracy of these forecasts. On the whole, the experts did pretty well. Most of the events they rated as low probability did not take place:
- President Trump would be sworn in for 2nd term (2%);
- A faithless elector (5%) or the House of Representatives (7%) would decide the electoral outcome;
- At some point during the transition period the country would have an acting president under 20th Amendment (10%);
- At least 1 state would abandon the popular vote as its mode of determining electors (10%), would send competing slates of electors to Washington (15%), or would miss the December 14 safe-harbor deadline for determining its slate of electors (25%);
- The Vice-President and Speaker of the House would dispute acceptance of Electoral College votes (20%) or President Trump would resign before January 20 and be pardoned by his successor, President Pence (27%).
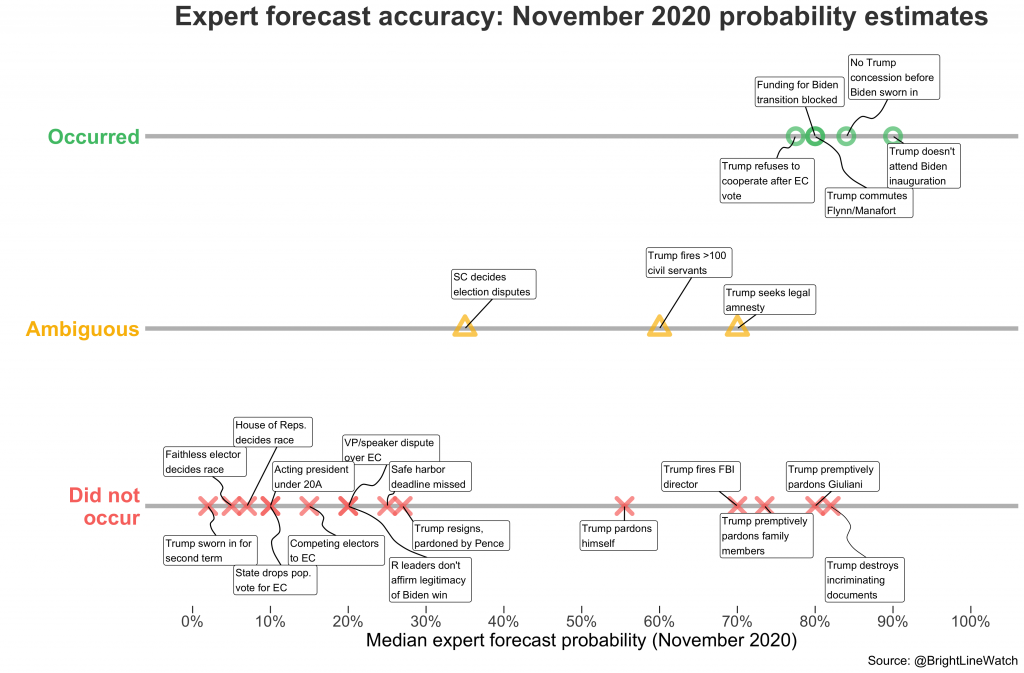
At the other end of the prognostication spectrum, the experts also assigned high likelihood to a number of events that did come to pass. President Trump did not attend Joe Biden’s inauguration (90%) and refused to concede that he had lost the election (84%). Trump also commuted the sentences of his political allies Mike Flynn and Paul Manafort (80%), blocked funding for the Biden transition (80%), and refused to cooperate with the Biden transition team after the Electoral College vote (78%).
But the experts’ predictions were far from perfect. They rated a number of items as likely that did not occur, particularly with regard to President Trump’s use of the pardon authority. The experts expected preemptive pardons for Rudolph Giuliani (80%), close Trump family members (74%), and Trump himself (56%). In the aftermath of the November election, they also expected President Trump to fire the FBI director before he left office (70%) and to destroy incriminating documents (82%). None of these events came to pass (to the best of our knowledge, in the case of document destruction). The reason may be that advisers persuaded Trump that such moves would backfire.
Some forecasts were ambiguous. Thirty-five percent of experts said one or more legal disputes over the election would be decided by the U.S. Supreme Court. In fact, the Court, of course, declined to hear cases brought by Trump with allegations of electoral malfeasance. Though it did not issue a decision, the Court’s (non-)action was critical to the election outcome. Nor did President Trump meet the forecast threshold of firing more than 100 civil servants between the election and his departure from office (60%). But he did act in late October to eliminate job protections for thousands of civil servants and tried to shift thousands of his own political appointees into civil service status, to protect them from being replaced by the Biden administration. Another forecast had to do with whether President Trump would attempt to negotiate legal amnesty for himself and his family after the election (70%). He did not do so publicly, but insider reports indicated that explored this possibility.
We close with discussion of an item that warrants consideration less for its match to expert forecasts than for its existential importance to American democracy — whether Republican Senate leader Mitch McConnell and House Minority Leader Kevin McCarthy would fail to acknowledge Joe Biden as the legitimate winner of the election even after Biden was inaugurated in January 2021. Our experts rated this extreme event as relatively unlikely (20%) and it did not ultimately come to pass. Though McConnell and McCarthy failed to actively oppose efforts to overturn the election results, they ultimately met the deadline, attending President Biden’s inauguration and acknowledging him as the legitimate president since.
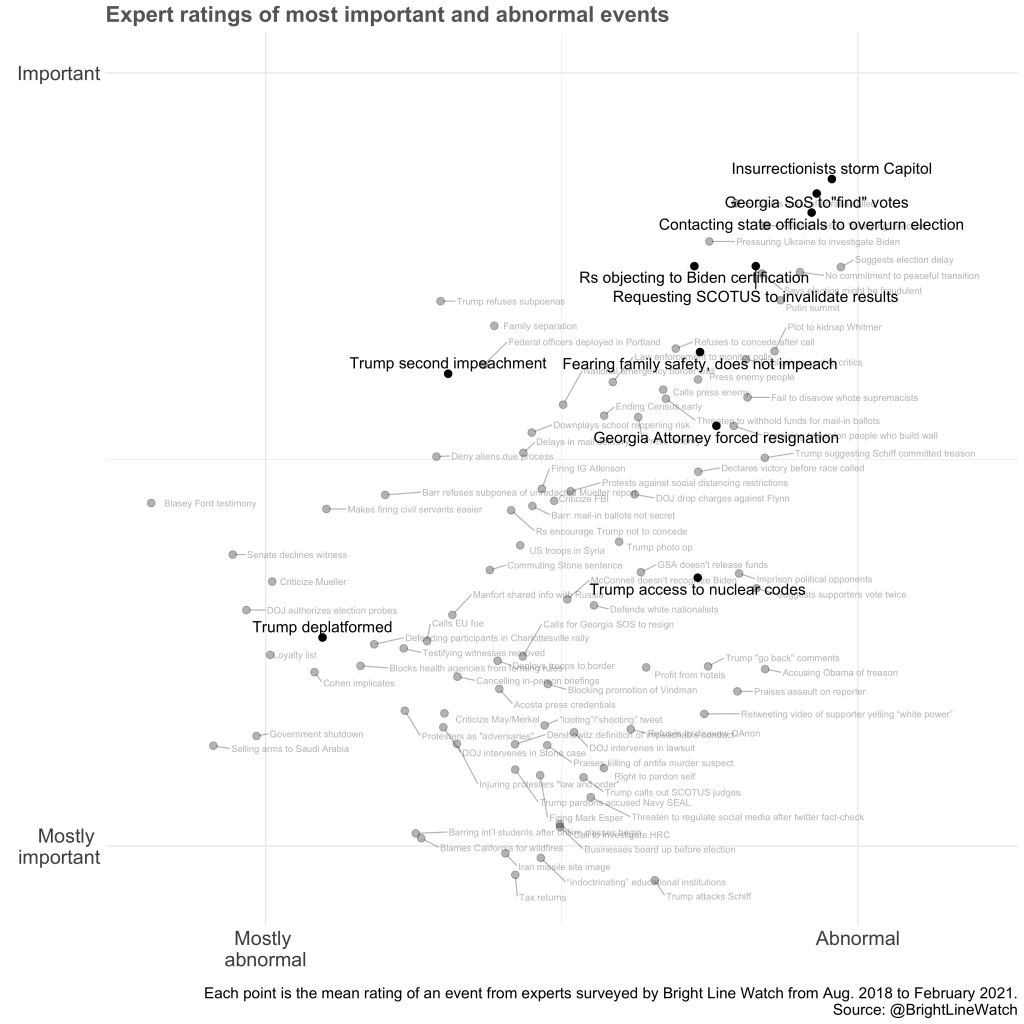
Political events
We then asked experts to rate the importance and abnormality of 21 events that took place since our previous survey in November 2020. The importance of an event was judged on a 5‑point scale from “Unimportant” to “Important” and its normalcy was scored on another 5‑point scale from “Normal” to “Abnormal.” The figure below visualizes the relationship between these variables. Consistent with patterns over the course of Trump’s presidency, many events of the past couple of months occupy the important and abnormal quadrant (top-right corner) of the graph. The two events of Biden’s presidency included in our survey, “Biden signs 17 executive orders immediately after taking office to reverse Trump policies” and “Biden requests waiver allowing recently retired Army general to serve as Defense Secretary,” were judged to be relatively normal occurrences in a presidential administration.
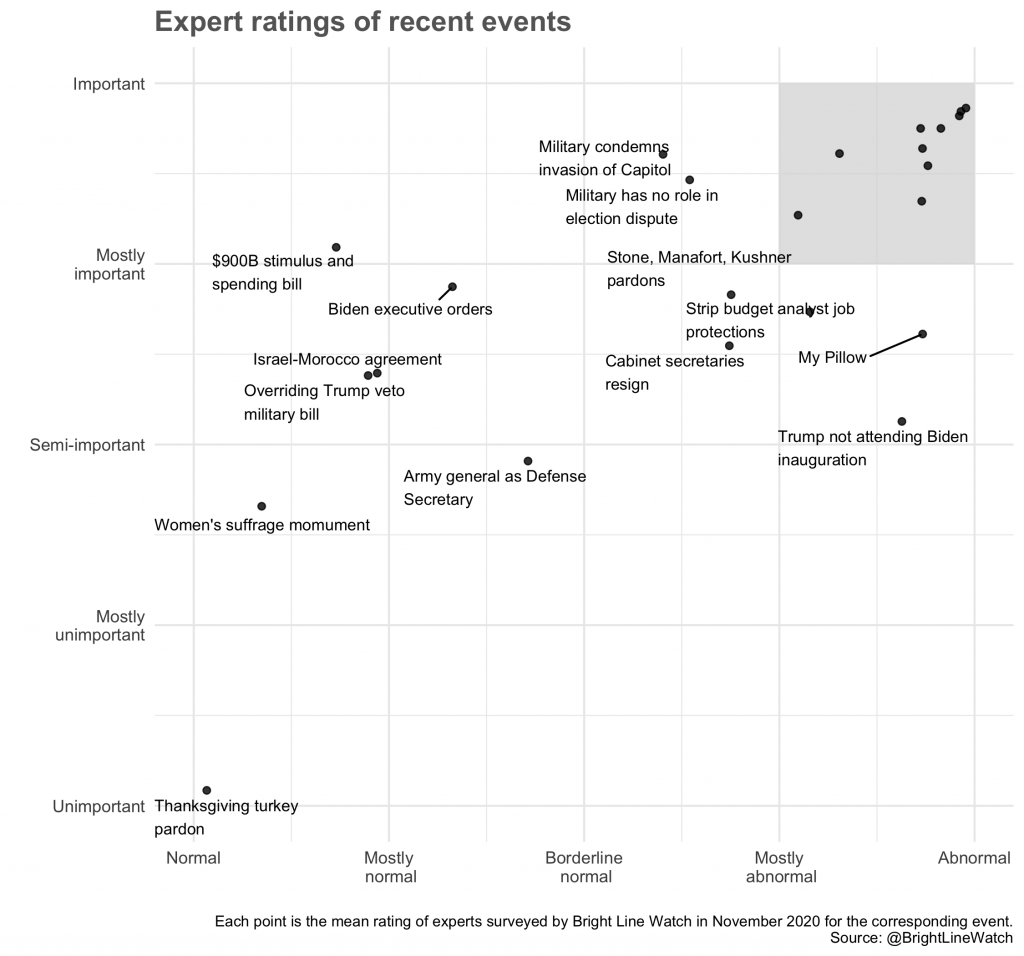
The events that our experts deemed most important and most abnormal are in the grey square in the figure. Of these events, pro-Trump insurrectionists’ invasion of the U.S. Capitol outstripped all others in its perceived abnormality and importance. Not far behind is a cluster of events, all of them related to attempts to overturn the election: Trump pressuring Georgia officials to “find” enough votes to overturn state election results, state attorneys general requesting that the Supreme Court invalidate election results in Pennsylvania, Wisconsin, Michigan, and Georgia, and 147 Republicans in Congress supporting objections to the certification of President Biden’s election.
Threats to democracy
To further unpack the significance of these events, we asked experts to rate the severity of the threat they posed to democracy. Unsurprisingly, more than 90% of experts viewed the items that scored highest across the (ab)normality-and-importance dimensions as either a moderate, serious, or grave threat.
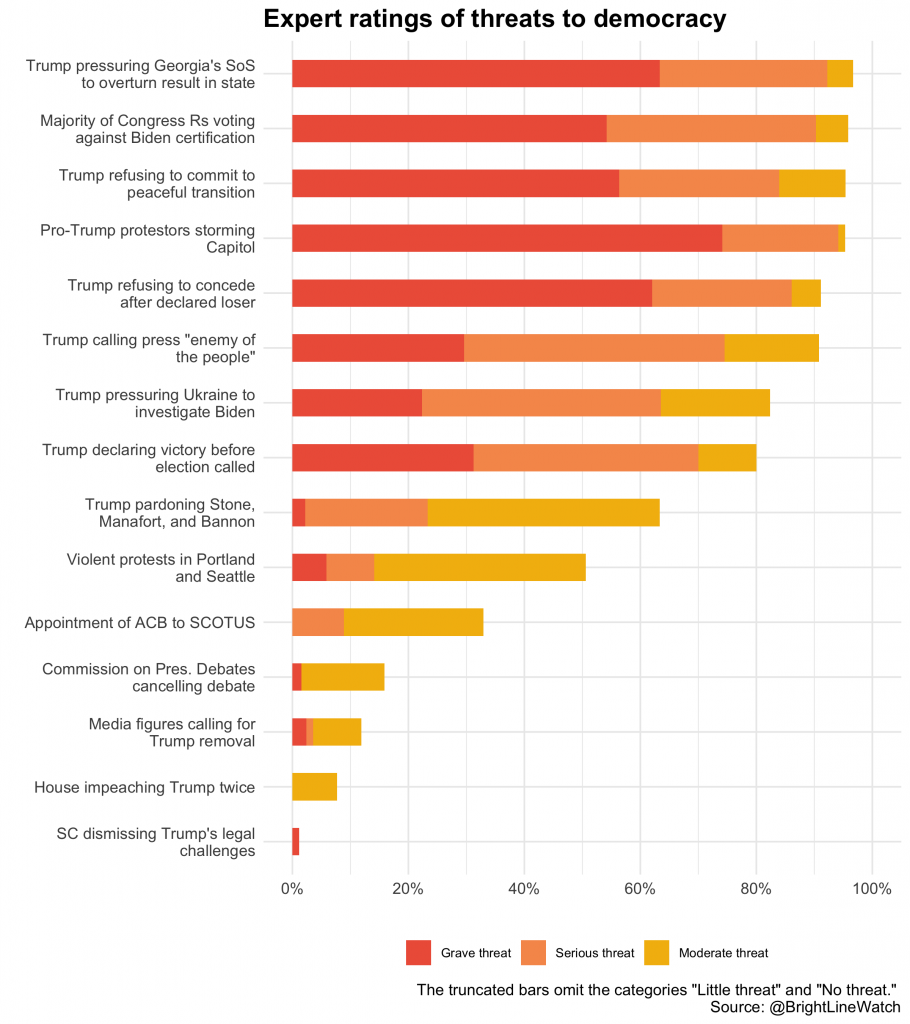
One item that our experts rated as abnormal was also one that few viewed as posing much of a threat to democracy: the House impeaching President Donald Trump for a second time. In total, 93% of our academic experts rated the two impeachments themselves as presenting little or no threat to U.S. democracy (7% sensed a moderate threat; none said it was a serious or grave threat). In the wake of Trump’s second acquittal, some prominent Republicans have voiced a different perspective, predicting that the impeachments would create a spiral of partisan retribution. For instance, Senator Lindsey Graham suggested that Vice-President Kamala Harris could be impeached if Republicans retake the House of Representatives for having expressed support for Black Lives Matter protesters in summer 2020.
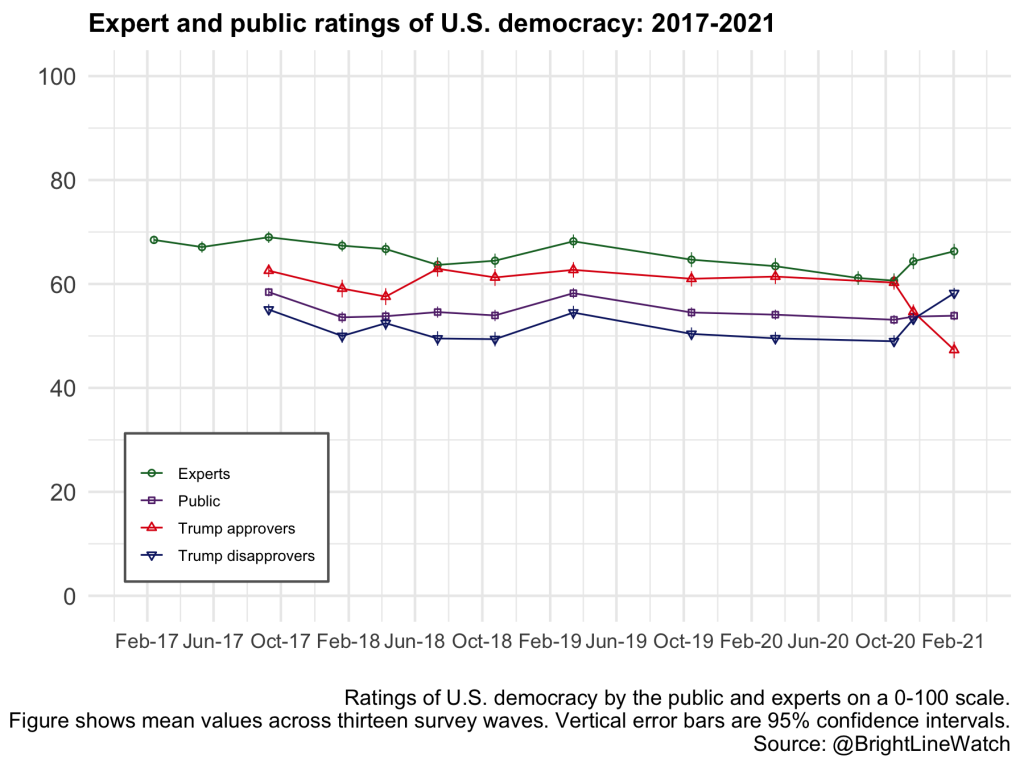
Public and experts on the quality of American democracy
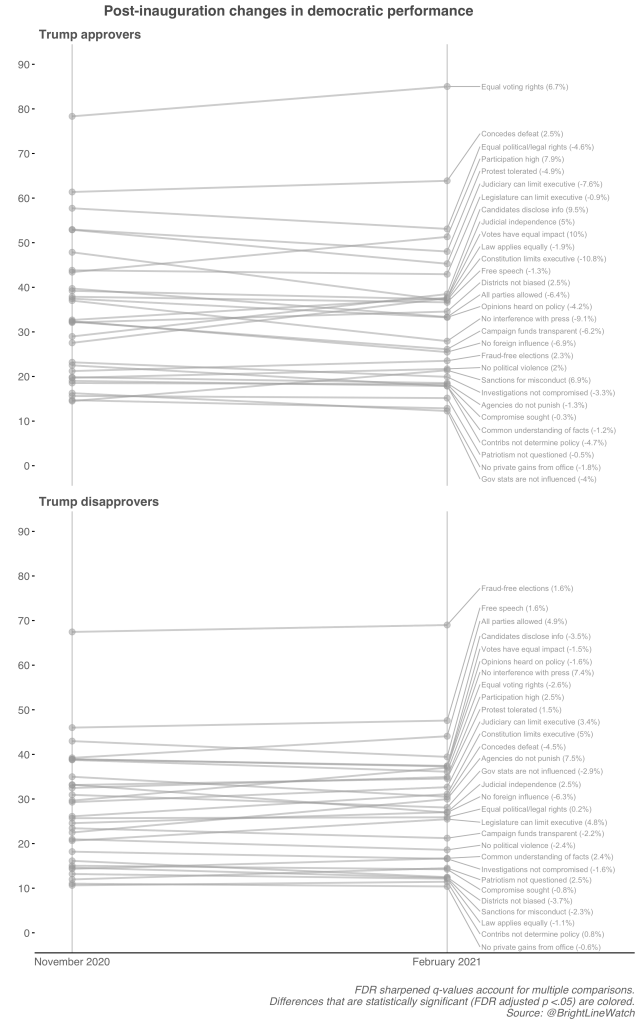
We asked both expert and public respondents to assess the quality of U.S. democracy overall. The figure below shows mean evaluations of U.S. democracy on a 0–100 scale among experts (green line) and the public (purple line). It also separately plots responses among the public from Trump approvers (red line) and disapprovers (blue line). Our October 2020 survey, conducted just before the election, marked a turning point. Across earlier surveys, ratings among our experts had drifted generally downward, from a mean of 69 in our first survey (February 2017) to 61 before the presidential election (October 2020). During that period, Trump approvers in the public rated democratic performance substantially higher (around 60) than did Trump disapprovers (around 50). In our November 2020 and January-February 2021 surveys, ratings of overall democratic quality rose sharply among both our experts (from 61 to 64 and then to 66) and among members of the public who disapprove of Donald Trump (from 49 to 53 and then to 58). By contrast, ratings among Trump approvers dropped (from 60 to 55 and then to 47). These counter-trends among Trump approvers and disapprovers effectively cancel out; the overall rating among the public sample thus remains level at 54.
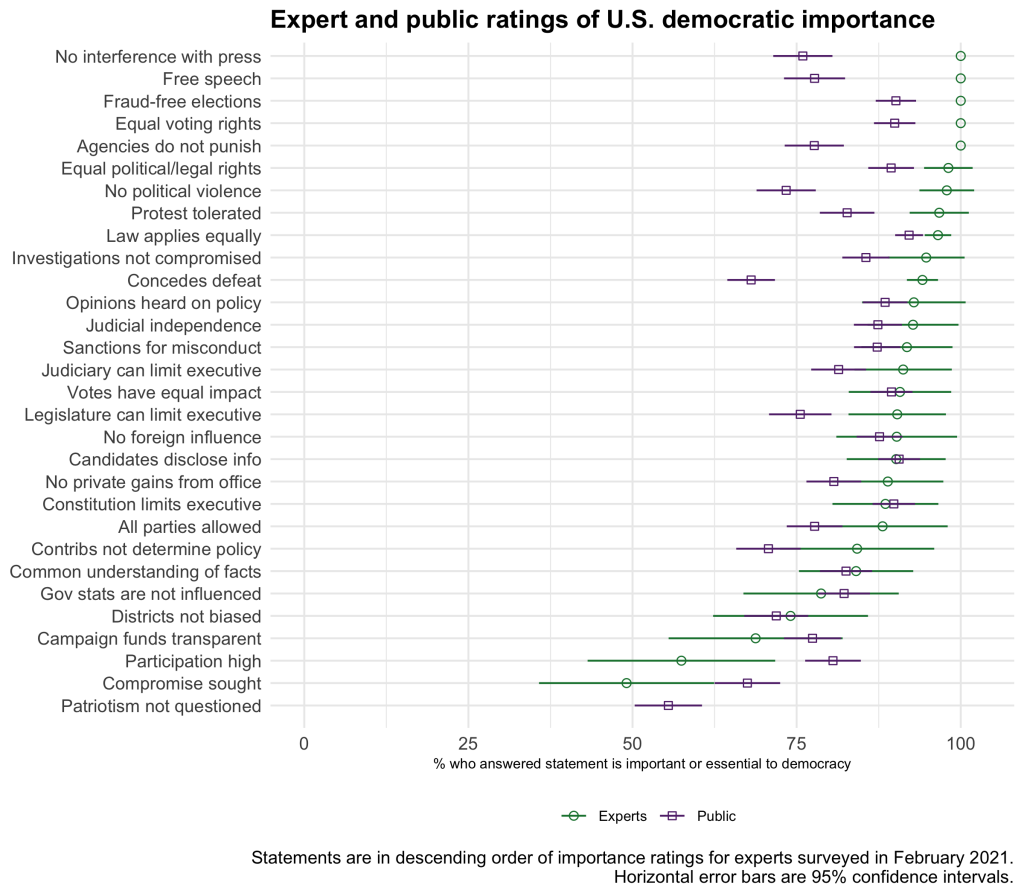
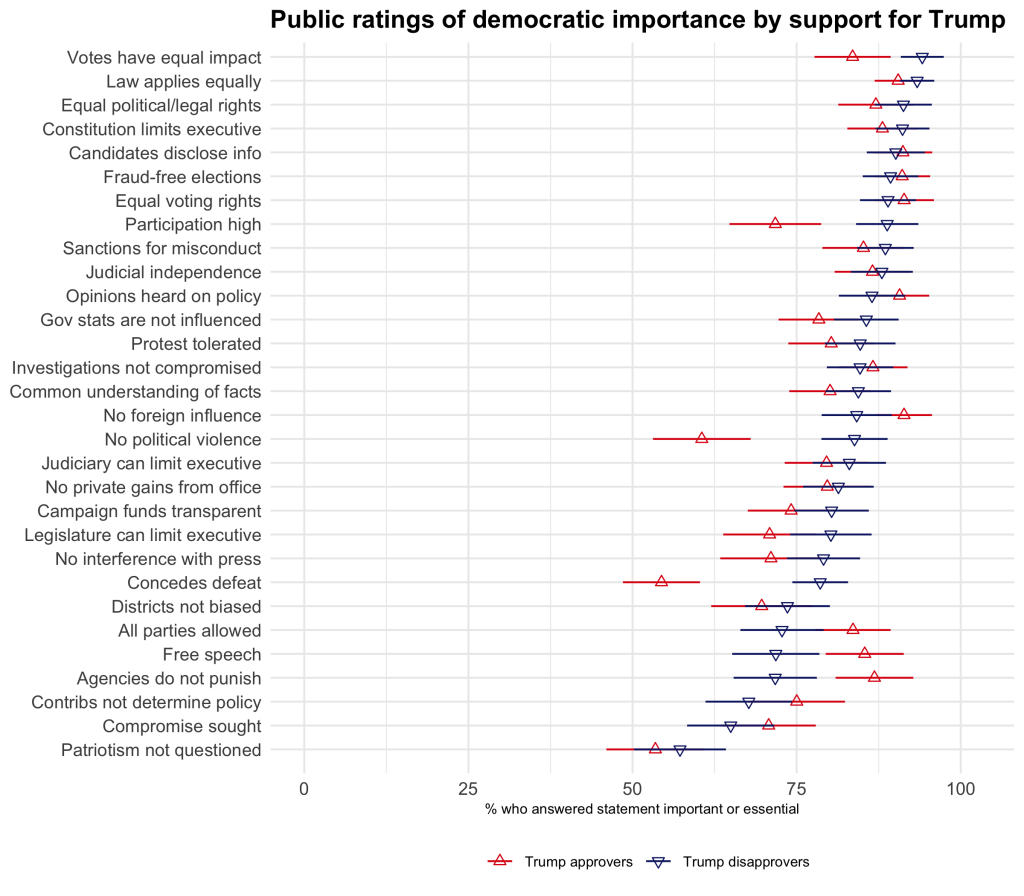
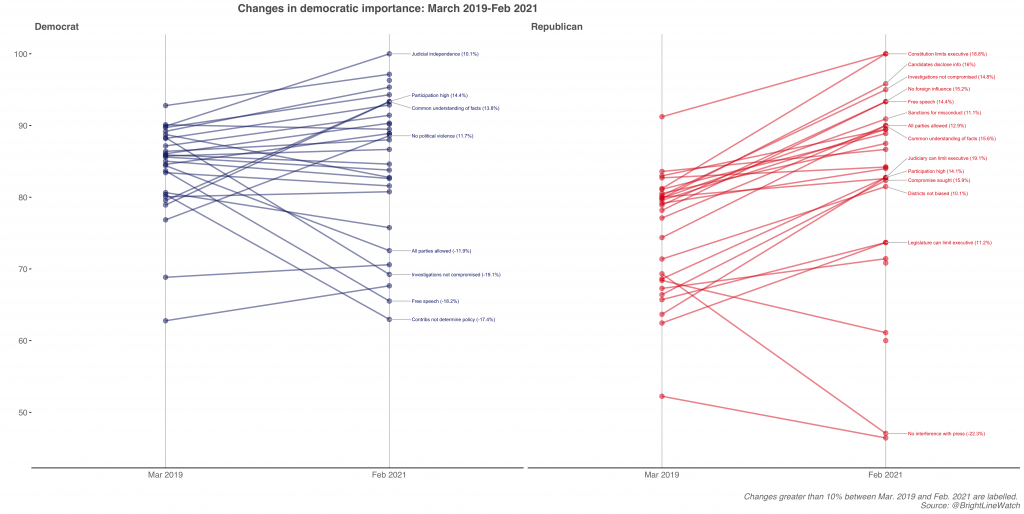
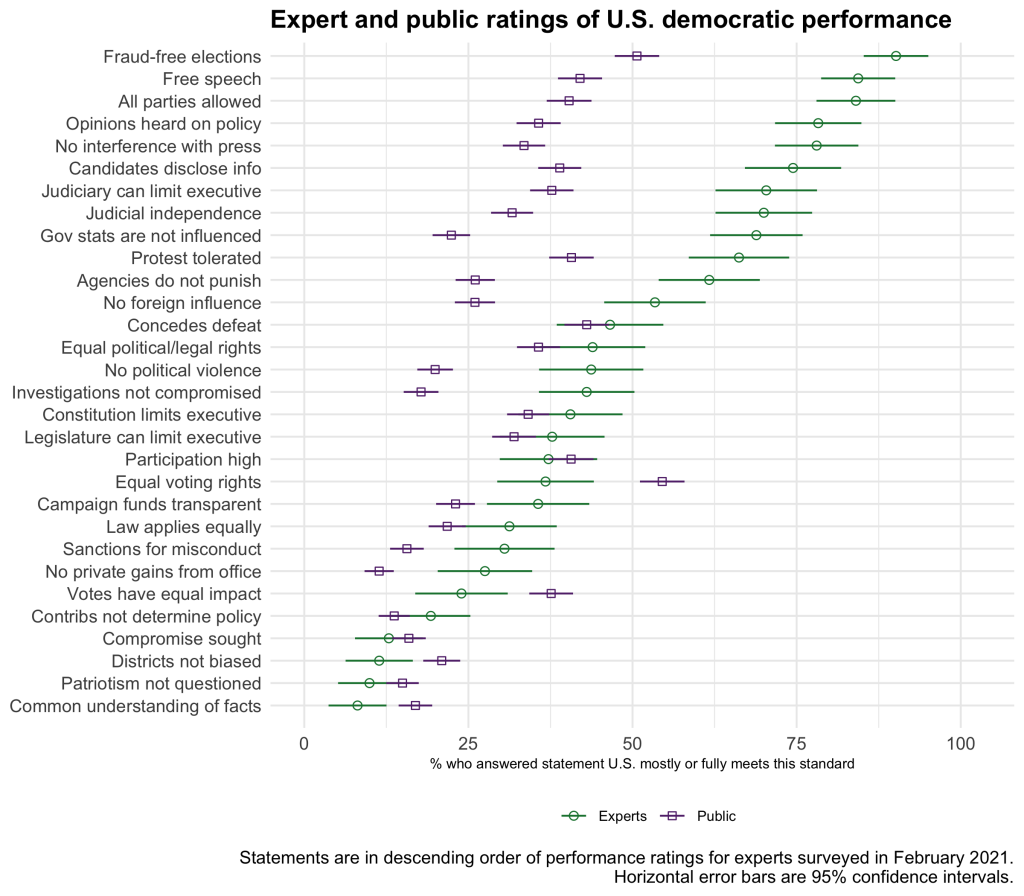
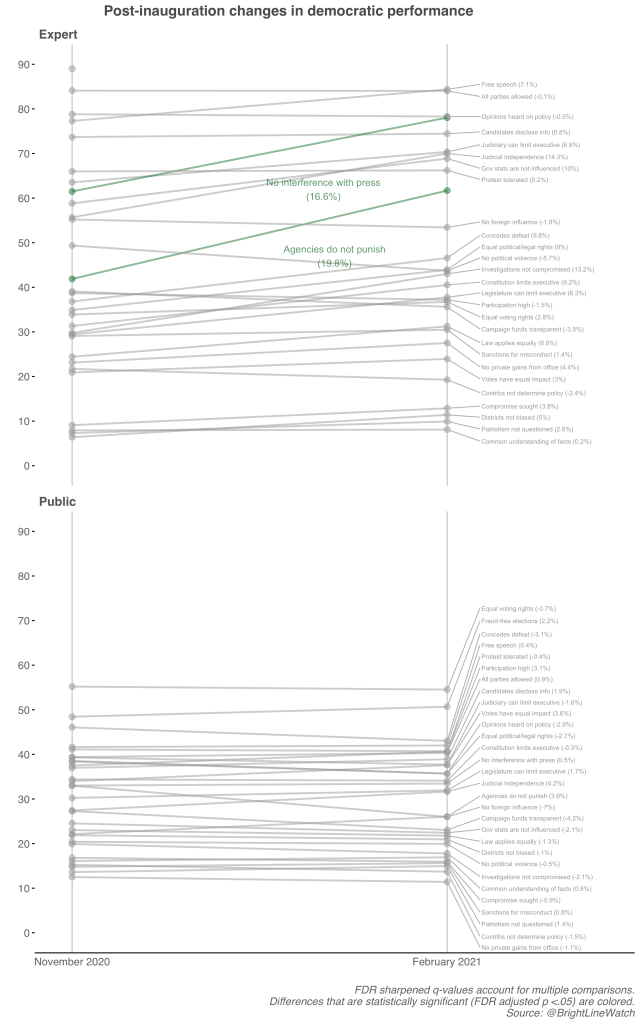
We also asked the experts and the public to evaluate each of thirty distinct democratic principles, on their importance to democracy, and on how well the U.S. was performing on them. The Appendix provides the complete list of 30 principles as well as figures illustrating the assessments among the expert and public samples of the importance of each to democracy and of performance. In those graphs, the public’s ratings are again presented separately for Trump supporters and opponents. Here, we note some items that show substantial changes over time. We last measured each item’s importance to democracy among the public in March 2019. Between the two surveys, overall estimates of importance have remained largely stable. But among Trump approvers, perceptions of the importance of three principles has risen markedly:8
- that elections should be free from foreign influence (+14 points),
- that political candidates disclose information about how they would govern (+11.8 points), and
- that the judiciary can limit executive power (+14.2 points).
Among Trump disapprovers, only one item rose substantially in importance: that participation in elections is high (+12.7 points). Three dimensions experienced a marked decline among Trump disapprovers:
- that all parties are allowed to compete in elections (-11 points),
- that the government protects freedom of speech (-10.2 points), and
- that government agencies are not used to punish political opponents (-11.5 points).
Political scientists have documented that people’s views about the health of the U.S. economy is highly sensitive to their partisanship. In much the same way, the public’s views about democracy appear heavily influenced by whether one’s party wins or loses. Contrary trends among Trump supporters and opponents reflect their reversal of fortunes in the November election and the transfer of executive power that followed. Trump opponents, whose narrow victory depended on record turnout, came to an increased appreciation for electoral participation. But their concern for protections for government opponents ebbed. Trump supporters, by contrast, gained new appreciation for the judiciary’s ability to check the executive and a new suspicion of any foreign influence over U.S. elections.
Appendix
Bright Line Watch surveys on the state of America’s democracy, January-February 2021
From January 28-February 8, 2021, Bright Line Watch conducted its fourteenth survey of academic experts, and eleventh of the general public, on the quality of democracy in the United States. Our public sample consisted of 2,700 survey participants from the YouGov sample who were selected and weighted to be representative of the U.S. adult population. We also surveyed 527 political science experts across a diverse range of subfields (5% of solicited invitations). Our email list was constructed from the faculty list of U.S. institutions represented in the online program of the 2016 American Political Science Association conference and updated by reviewing department websites and job placement records from Ph.D. programs in the period since.
All estimates shown in the report used weights provided by YouGov. Our expert sample is traditionally unweighted because we do not collect demographic data to protect anonymity. Error bars in our graphs represent 95% confidence intervals. Data are available here.
Both the expert and public samples in Wave 14 responded to a battery of questions about democratic performance and importance in the United States. Afterward, they were asked to evaluate the quality of American democracy overall on a 100-point scale. Experts were also asked to evaluate the quality of democracy in their state on the same 0–100 scale. Expert respondents were then asked to respond to three additional batteries: one in which they were presented with a list of political events and asked to rate them on normalcy and importance, another in which they were asked to evaluate proposals to improve the quality of American democracy, and a final set of questions about the degree to which select events posed a threat to democracy.
16 reform proposals
- Enlarge House of Representatives
Substantially enlarge the House of Representatives through federal legislation to make it and the Electoral College more representative of the nation’s population - Ranked-choice voting
Introduce ranked-choice voting in presidential, congressional, and state elections. - Multi-member districts
Repeal the 1967 law that mandates single-member districts for the House so that states have the option to use multi-member districts on the condition that they adopt a non-winner-take-all election model. - Redistricting commissions
Federal legislation requiring fair congressional districts to be determined by state-established independent citizen-redistricting commissions. - Campaign finance regulation
Amend the Constitution to authorize the regulation of election contributions and spending to limit the undue influence of money in our political system. - Campaign finance transparency
Pass strong campaign-finance disclosure laws in all fifty states that require full transparency for campaign donations, including from 501(c)(4) organizations and LLCs. - Public funding of campaigns
Pass “clean election laws” for federal, state, and local elections through mechanisms such as public matching donation systems and democracy vouchers, which amplify the power of small donors. - 18-year Supreme Court terms
Establish, through federal legislation, eighteen-year terms for Supreme Court justices with appointments staggered such that one nomination comes up during each term of Congress. - Flexibility on when and how to vote
Give people more choices about where and when they vote, with state-level legislation in all states that supports the implementation of vote centers and early voting. - Election day on national holiday
Change federal election day to Veterans Day to honor the service of veterans and the sacrifices they have made in defense of our constitutional democracy, and to ensure that voting can occur on a day that many people have off from work. - Same-day voter registration
Establish, through state and federal legislation, same-day registration and universal automatic voter registration. - Pre-register young voters
Establish, through state legislation, the preregistration of sixteen- and seventeen-year-olds and provide educational opportunities for them to practice voting as part of the pre-registration process. - Compulsory voting
Establish, through legislation, voting in federal elections to be a requirement of citizenship. All eligible voters would have to participate or submit a valid reason for nonparticipation. - Suffrage for ex-felons
Restore federal and state voting rights to citizens with felony convictions immediately and automatically upon their release from prison. - National popular vote
Change to a system in which the president is elected by direct popular vote, instead of by the Electoral College. - Eliminate filibuster
Change US Senate rules to eliminate the filibuster, allowing a simple majority of senators to bring any proposal to the floor for a vote.
Events
- Trump pressures Georgia official to “find” enough votes to overturn state election results
- Congress and Senate override Trump veto of military spending bill
- All 10 living former defense secretaries say U.S. military has no role in election dispute
- Pro-Trump insurrectionists storm the Capitol
- 147 Republicans in Congress support objections to the certification of President Biden’s election
- White House forces Georgia U.S. Attorney to resign for not investigating election fraud claims
- Trump issues Thanksgiving turkey pardon
- Trump signs $900 billion stimulus and government spending bill
- Trump pardons Roger Stone, Paul Manafort, Steve Bannon, and Charles Kushner
- Trump contacts 31 GOP officials in battleground states to try to overturn election
- State attorneys general request SCOTUS invalidate election results in PA, WI, MI, and GA
- Biden requests waiver allowing recently retired Army general to serve as Defense Secretary
- Cabinet secretaries for Education, Transportation, DHS resign following riot at Capitol
- Trump does not attend Biden inauguration
- Trump administration brokers deal to normalize relations between Morocco and Israel
- GOP congressmen reports colleagues didn’t vote to impeach Trump out of fear for family safety
- House of Representatives impeaches Trump for the second time
- Trump authorizes construction of women’s suffrage monument in D.C.
- Trump races to strip job protections from budget analysts before transition
- Biden signs 17 executive orders immediately after taking office to reverse Trump policies
- Pelosi talks to Joint Chiefs about blocking Trump from accessing nuclear codes
- Top military leaders condemn violent invasion of the Capitol in joint statement
- My Pillow founder encourages Trump to declare martial law during a White House visit
- Social media companies deplatform President Trump
Threats to democracy
- President Trump declaring that he had won the election before the race had been called.
- President Trump refusing to concede defeat after being declared loser of the election.
- President Trump refusing to commit before the election to a peaceful transition of power.
- President Trump pressuring Ukraine to investigate Joe Biden.
- President Trump calling the press an “enemy of the people.”
- The Commission on Presidential Debates cancelling the October 15 debate.
- The appointment of Amy Coney Barrett to the Supreme Court.
- Pro-Trump protestors storming the U.S. Capitol.
- Trump pressuring Georgia’s Secretary of State to “find” enough votes to overturn the result in that state.
- A majority of Republicans in Congress voting against the certification of Joe Biden’s win in the Electoral College.
- The House of Representatives impeaching President Trump for a second time.
- Violent protests in Portland, Oregon and the creation of the Capitol Hill Autonomous Zone in Seattle, Washington.
- Media figures calling for President Trump’s removal from office.
- The Supreme Court dismissing President Trump’s legal challenges to the election results.
- President Trump pardoning Roger Stone, Paul Manafort, and Steve Bannon.
Democratic principles
The foundation of Bright Line Watch’s surveys is a list of 30 statements expressing a range of democratic principles (the full list is provided below). Democracy is a multidimensional concept. Our goal is to provide a detailed set of measures of democratic values and of the quality of American democracy. We are also interested in the resilience of democracy and the nature of potential threats it faces. Based on the experiences of other countries that have experienced democratic setbacks, we recognize that democratic erosion is not necessarily an across-the-board phenomenon. Some facets of democracy may be undermined first while others remain intact, at least initially. The range of principles that we measure allows us to focus attention on variation in specific institutions and practices that, in combination, shape the overall performance of our democracy.
Bright Line Watch’s Wave 1 survey included 19 statements of democratic principles. Based on feedback from respondents and consultation with colleagues, we expanded that list to 29 statements in Wave 2. We then reduced that set to a set of 27 statements for the Wave 3 through Wave 8 surveys. 17 of those 27 statements were included in Wave 1, and all 27 were included in Wave 2. We added one statement to the list in Wave 9. In Wave 12, we began asking respondents to assess two additional principles:
- The law is enforced equally for all persons
- Politicians who lose free and fair elections will concede defeat
The full set of statements is presented below and grouped thematically for clarity. In the surveys, the principles were not categorized or labeled. Each respondent was shown a randomly selected subset of statements and asked to rate the performance of the United States on those dimensions. For the performance questions, both the public and experts were asked to rate 9 statements. In the importance battery, respondents were asked to rate a random subset of 4 statements, up-weighting the 2 statements that were introduced in Wave 12 so that more respondents could rate the new statements.
Elections
- Elections are conducted, ballots counted, and winners determined without pervasive fraud or manipulation
- Citizens have access to information about candidates that is relevant to how they would govern
- The geographic boundaries of electoral districts do not systematically advantage any particular political party
- Information about the sources of campaign funding is available to the public
- Public policy is not determined by large campaign contributions
- Elections are free from foreign influence
- Politicians who lose free and fair elections will concede defeat
Voting
- All adult citizens have equal opportunity to vote
- All votes have equal impact on election outcomes
- Voter participation in elections is generally high
Rights
- All adult citizens enjoy the same legal and political rights
- Parties and candidates are not barred due to their political beliefs and ideologies
- Government protects individuals’ right to engage in unpopular speech or expression
- Government protects individuals’ right to engage in peaceful protest
- Citizens can make their opinions heard in open debate about policies that are under consideration
- The law is enforced equally for all persons
Protections
- Government does not interfere with journalists or news organizations
- Government effectively prevents private actors from engaging in politically-motivated violence or intimidation
- Government agencies are not used to monitor, attack, or punish political opponents
Accountability
- Government officials are legally sanctioned for misconduct
- Government officials do not use public office for private gain
- Law enforcement investigations of public officials or their associates are free from political influence or interference
- Government statistics and data are produced by experts who are not influenced by political considerations
Institutions
- Executive authority cannot be expanded beyond constitutional limits
- The legislature is able to effectively limit executive power
- The judiciary is able to effectively limit executive power
- The elected branches respect judicial independence
Discourse
- Even when there are disagreements about ideology or policy, political leaders generally share a common understanding of relevant facts
- Elected officials seek compromise with political opponents
- Political competition occurs without criticism of opponents’ loyalty or patriotism
To measure perceived democratic performance, the survey asked, “How well do the following statements describe the United States as of today?” Each respondent was then presented with 9 statements of principle, randomly drawn from the set above, and offered the following response options:
- The U.S. does not meet this standard
- The U.S. partly meets this standard
- The U.S. mostly meets this standard
- The U.S. fully meets this standard
- Not sure
To measure the perceived importance of each principle, the survey asked, “How important are these characteristics for democratic government?” Each respondent was then presented with 4 statements, randomly drawn from the set above, and offered the following response options:
- Not relevant: this has no impact on democracy
- Beneficial: this enhances democracy but not required for democracy
- Important: if this is absent, democracy is compromised
- Essential: A country cannot be considered democratic without this
Additional figures
Election confidence
Note on confidence in vote counts over time. In our October, November, and January/February surveys, Bright Line Watch included asked members of the public sample about their confidence that “… votes [in your county/statewide/nationwide] were cast as voters intended?” In the January/February wave, we also coordinated with CivicPulse to ask a similar question — us to our public sample, CivicPulse to a sample of 212 local and state-level public policymakers — although the wording differed slightly, asking about confidence that (“… votes for the presidential election were counted correctly [in your county/statewide/nationwide]?” Thus, the CivicPulse wording specifically referred to the presidential election, and it stipulated “correctly” rather than “as voters intended.”
In the January/February survey, Bright Line Watch split its sample, asking each variant to half our participants. If response patterns were identical in each variant, it would have been possible to combine the data but, as it happens, the slight differences in wording appear to have affected responses. Among those who approve of President Trump, confidence was lower in the variant that referred to the presidential election. In the main report, we presented results from that variant, which allowed comparison between our public sample and the CivicPulse sample of elected officials. The full distributions among each group are shown in the figure below.
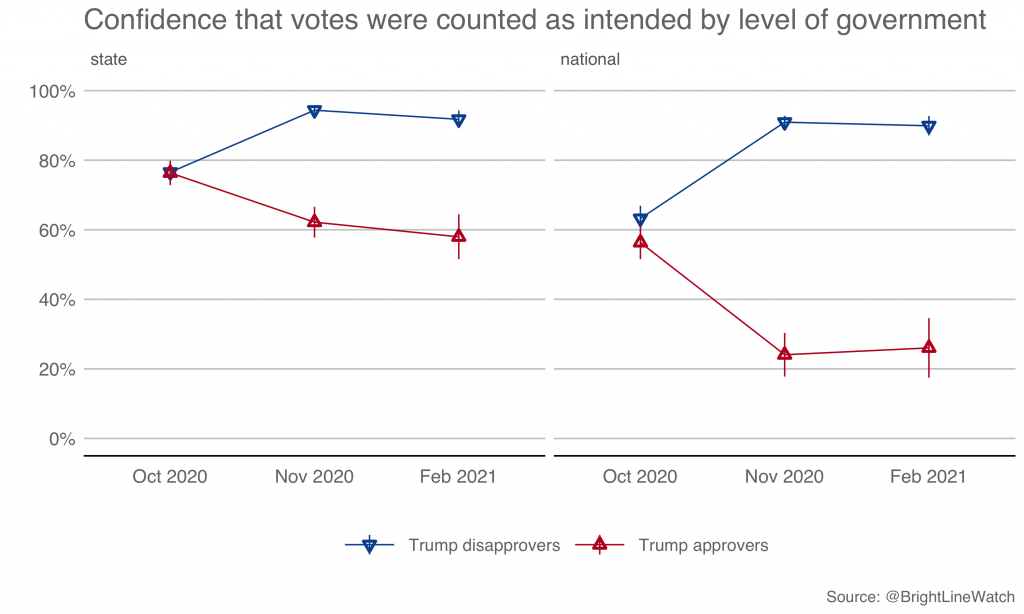
The next figure presents results from the variant that Bright Line Watch used in October, November, and January/February, which allows over-time comparison of responses using consistent wording. The time series shows that, from November, just after the election, to January/February, there was little change, among either Trump approvers or disapprovers, in confidence in the vote counts at the state or national level. Approvers and disapprovers had about identical levels of confidence on the eve of the election in October, then diverged sharply in November, and have remained separated by a wide gulf, particularly regarding confidence in the national level count.
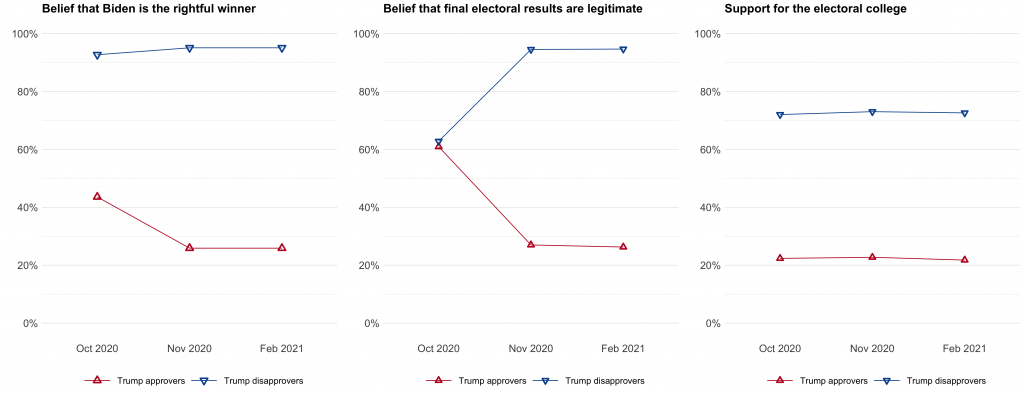
Rightful winner, legitimate results, support for the EC
Conjoint experiment by support for Trump
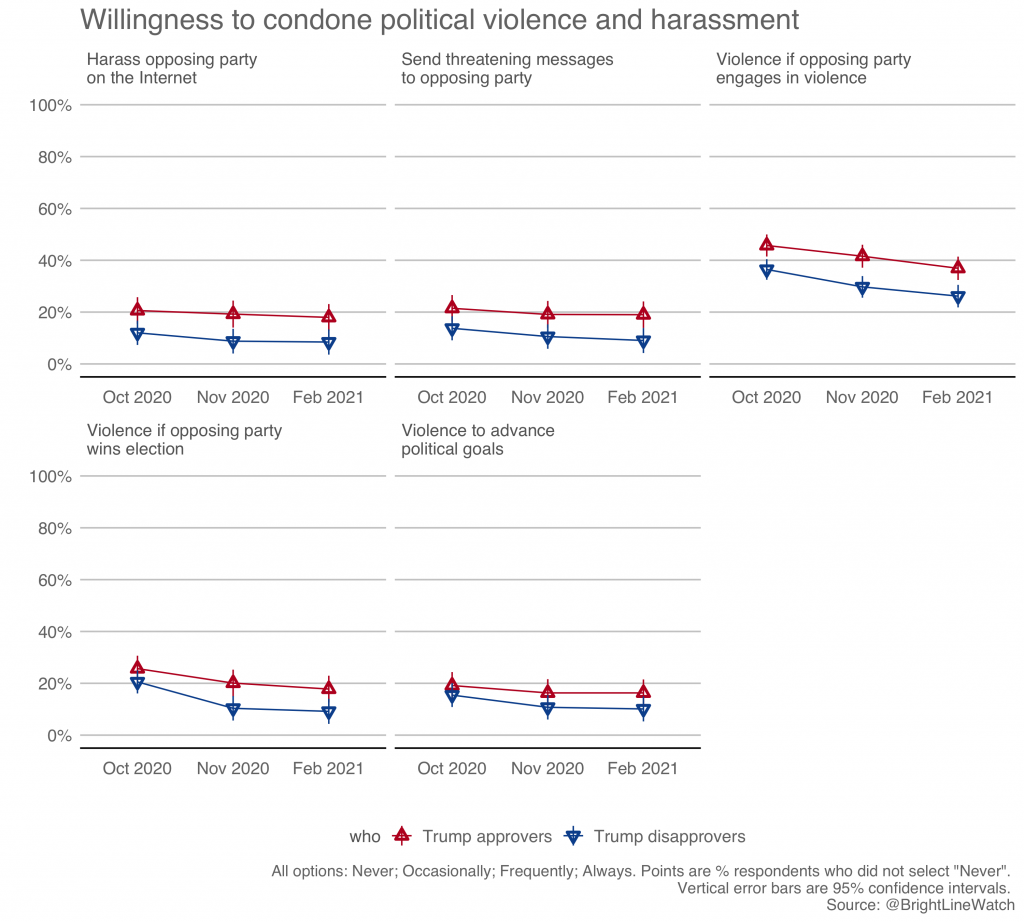
Political violence
Support for secession by Trump approval
Importance battery
Performance battery
Notes
- We instead asked half the participants in our public sample, “How confident are you that votes nationwide were counted as voters intended?” to correspond to the wording used in our October and November surveys. The distributions of responses between people asked this version of the question and those asked specifically about the 2020 presidential election using the wording above were generally similar, but Trump supporters reported less confidence when asked specifically about the recent presidential election. The Appendix provides figures illustrating the differences between versions of the question and time series data for the version we used in our three most recent surveys.
- You can direct questions about the CivicPulse local policymaker sample to Nathan Lee, Managing Director, at nathanlee@civicpulse.org, or visit www.civicpulse.org.
- Due to a coding error, the confidence intervals around the estimates in the figure initially released with this reports, in February 2021, were too small. (The point estimates were accurate.) The confidence intervals, and corresponding interpretations in the text of the report, have been corrected in this current version [July 11, 2021].
- Recall that our survey closed the day before Trump’s second impeachment trial began in the Senate, so our results do not reflect exposure to any information the trial revealed.
- Rush Limbaugh also briefly advocated secession before beating a hasty retreat from the position.
- For both the generic and the concrete secession questions, the response options were: Strongly support, Somewhat support, Somewhat oppose, Strongly oppose. For simplicity, we group responses in the map by support versus opposition. The full data are available here.
- We asked an analogous question to our public sample and found that 80% of Democrats support moving to a national popular vote, but only 23% of Republicans and 36% of independents do.
- We note principles on which the share of respondents rating a principle as “essential” or “important” to democracy (as opposed to “not relevant” or “beneficial”) has changed by more than 10 percentage points.