Party, policy, democracy and candidate choice in U.S. elections
Bright Line Watch
John M. Carey (Dartmouth College)
Katherine P. Clayton (Dartmouth College)
Gretchen Helmke (University of Rochester)
Brendan Nyhan (University of Michigan)
Mitchell Sanders (Meliora Research)
Susan C. Stokes (University of Chicago)
Overview
How committed is the American public to democracy? Are there any democratic principles that, if violated by politicians, would generate resistance from the public? Are citizens of all political stripes equally willing to punish candidates for such violations? Building on cutting-edge research by Graham and Svolik (2018), Bright Line Watch conducted an experiment that asked people to choose between pairs of hypothetical candidates. We use a conjoint design, which allows us to estimate the relative importance of candidate traits, partisanship, policy positions, and support for democratic principles in voters’ decisions. Our experiment yields the following findings:
-
Partisanship outweighs all else for both Democrats and Republicans. Both groups are approximately 19 percentage points more likely to select a candidate from their own party than one from the other party — an effect that exceeds those observed for candidate policy positions and support or opposition to democratic principles. The parties also continue to divide over the issues of tax policy and racial discrimination.
-
Democrats, Republicans, and independents all punish candidates who violate democratic principles related to political control over investigations, judicial independence, and cross-party compromise. These effects are consistently negative across partisan groups and range from four to 13 percentage points.
-
Americans diverge most dramatically by party on the democratic principle of equal voting rights and access. Democrats are less likely to back candidates who endorse legislation requiring voters to show ID at the polls, whereas support for these candidates increases by eight percentage points among independents and 17 percentage points among Republicans.
Encouragingly, these findings indicate that several key democratic principles maintain consensus support. However, the punishment for violating them is often modest (cf. Graham and Svolik 2018). Moreover, the, the high levels of partisanship we document create a context in which such principles can be called into question and politicized. As we show, the deep partisan divide over voter ID laws is now reflected in the choices Americans make when evaluating candidates. The polarized response to these policies illustrates how partisans can become deeply split over which democratic priorities are worth protecting.
Introduction
Proclaiming support for democracy is easy, but will voters follow through on these commitments and punish candidates who violate important democratic principles? In recent years, prominent studies have argued that public commitment to democratic values in the U.S. has declined (Foa and Mounk 2016, 2017, Pew Research Center 2018, Wike and Fetterolf 2018), though these findings are contested (Alexander and Welzel 2017, Norris 2017, Voeten 2017). American voters are also becoming more partisan (Pew Research Center 2017), which is strengthening feelings of in-group loyalty and out-group rivalry (Fishkin and Pozen 2018, Mason 2018). Taken together, this increasing partisan antagonism could potentially threaten the stability of the U.S. political system by eroding master norms of mutual toleration and forbearance (Levitsky and Ziblatt 2018).[1]
A new line of research seeks to measure the consequences of these changes by examining how voters make trade-offs between their commitments to their partisan and policy preferences, and to the values of democracy itself (Graham and Svolik 2018; also see Svolik 2017). In a survey experiment, these scholars pit hypothetical candidates for state legislature with experimentally manipulated characteristics against each other and ask respondents to choose between them. They find that partisan and policy considerations have much stronger effects on vote choice than “undemocratic” platforms related to electoral fairness or checks and balances.
Building on this research, Bright Line Watch conducted our own conjoint survey experiment assessing the relative importance of partisanship, policy preferences, and a subset of democratic values taken from Bright Line Watch’s original 27 principles among voters just before the 2018 midterm elections. Our survey asked respondents to choose between a series of paired hypothetical candidates “in an upcoming election.” Each “candidate” was defined by a profile consisting of a set of personal attributes and stances. For instance, a pair of candidates might include a male Democrat who favored redistributive economic measures and thought that officials should not be constrained by court decisions they saw as partisan, and a female Republican with similar policy positions but who expressed more deference to courts.
Respondents made a series of choices among pairs of candidates whose attributes were randomly assigned. This design allows us to estimate the effect of each individual component in the candidates’ profiles — for example, their race, their party, or their stance on respecting court decisions — on the probability that the respondent would support him or her. (For more on conjoint experiments, see Hainmueller, Hopkins, and Yamamoto 2013.) The design also allows us to see how the effect of candidate attributes on vote choice differs between different types of respondents. For example, we can compare how much Democratic and Republican respondents care about candidates’ views on respecting court decisions.
The candidate choice experiment
The study was conducted from October 24–31, 2018 among 962 online participants. [2] The sample was matched and weighted by the survey company YouGov to approximate a representative sample of the U.S. population. 35% of our respondents identified as Republicans or independents who lean Republican, 43% as Democrats or independents who lean Democratic, and 17% as independents who lean toward neither party. [3] Respondents were presented with ten pairwise choices between candidates in a hypothetical upcoming election. Each candidate was described using eight characteristics: name, partisanship, positions on policies toward taxation and racial discrimination, and four positions reflecting democratic values. Figure 1 provides an illustrative example of what respondents saw:
Figure 1: Sample conjoint table
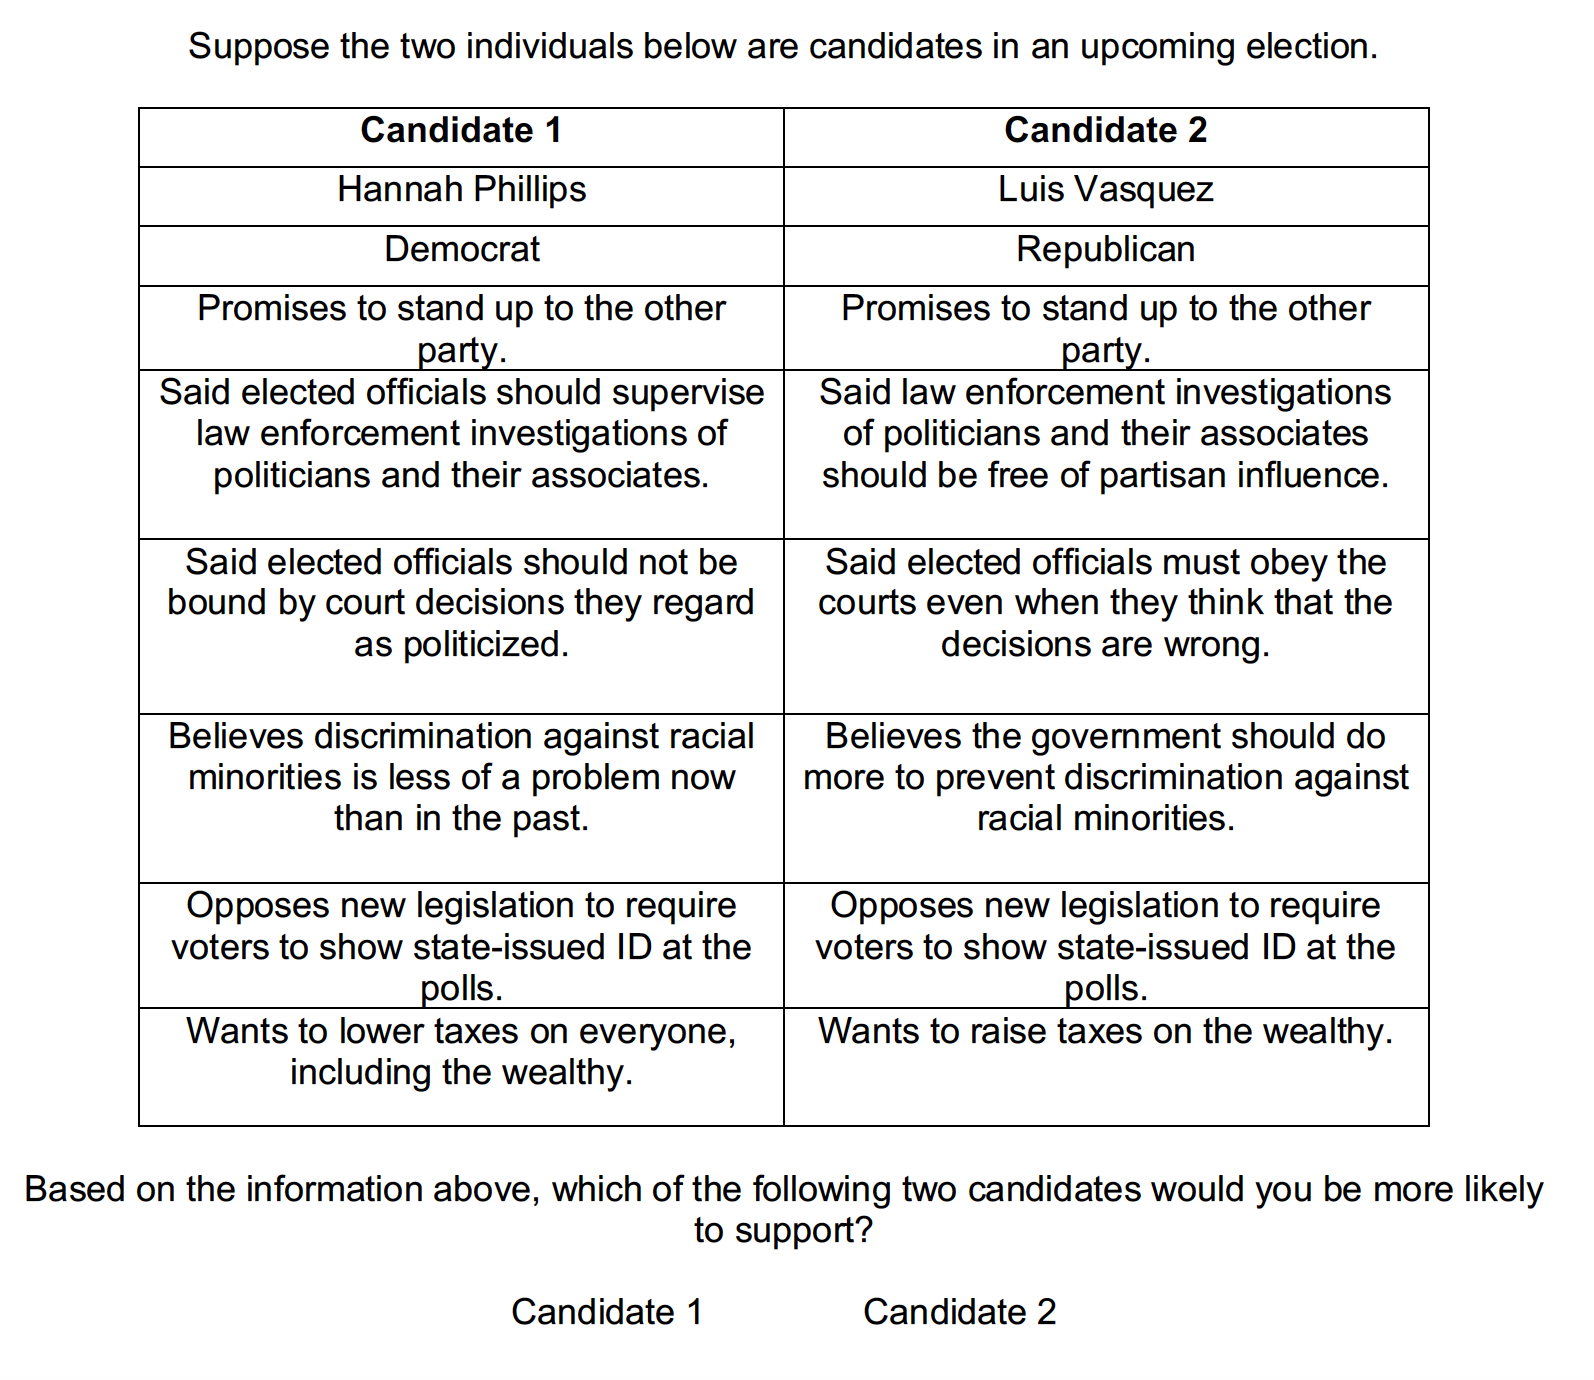
The characteristics of the candidates were randomly generated from the following sets of alternatives:[4]
Name (gender and race/ethnicity): Each candidate was assigned a name from a list of 123 names designed to signal both gender (man or woman) and race/ethnicity (either white, black, or Hispanic). [5] [6]
Partisanship: Democrat or Republican.
Policy positions: The surveys included two attributes reflecting salient party differences over policy — one on racial discrimination, the other on taxation (see Bartels 2018).
Racial discrimination
- Believes the government should do more to prevent discrimination against racial minorities.
- Believes discrimination against racial minorities is less of a problem now than in the past.
Taxation
- Wants to raise taxes on the wealthy.
- Wants to lower taxes on everyone, including the wealthy.
Democratic values: The surveys included four attributes related to core democratic values.
Voting rights/access
- Opposes new legislation to require voters to show state-issued ID at the polls.
- Supports new legislation to require voters to show state-issued ID at the polls.
Investigations/rule of law
- Said law enforcement investigations of politicians and their associates should be free of partisan influence.
- Said elected officials should supervise law enforcement investigations of politicians and their associates.
Judicial deference
- Said elected officials must obey the courts even when they think that the decisions are wrong.
- Said elected officials should not be bound by court decisions they regard as politicized.
Compromise
- Promises to work for compromise across party lines.
- Promises to stand up to the other party.
Democratic principles
The conjoint experiment allows us to see whether the commitments to democratic principles that voters express in the abstract are reflected in the choices they make between candidates. Bright Line Watch’s survey research to date has largely focused on a set of 27 principles, many of which are directly reflected in the candidate choice experiment. Specifically:
Voting rights/access. This attribute reflects two principles related to elections:
- All adult citizens have equal opportunity to vote
- Voter participation in elections is generally high
Advocates of voter ID laws contend that they are necessary to combat voter fraud, but research shows that voter fraud is exceedingly rare (Levitt 2007, Minnite 2010, Cottrell, Herron, and Westwood 2018) and that the disenfranchising effect of such laws disproportionately affects racial and ethnic minorities (Ansolabehere and Hersh 2017, Hajnal, Lavejardi, and Nielson 2017). The disparate effects of voter ID laws undermine the principle that all citizens should have an equal opportunity to vote and that participation in elections should be high (Sargent 2018).
Investigations/rule of law. This attribute reflects three principles related to accountability:
- Government officials are legally sanctioned for misconduct
- Law enforcement investigations of public officials or their associates are free from political influence or interference
- Government agencies are not used to monitor, attack, or punish political opponents
Legal investigations that are impartial and free from partisan influence are an essential element of the rule of law. When politicians or parties are able to “capture the referees” by appointing, intimidating, or controlling legal investigations, those who hold elected office will be free from effective oversight and can potentially target their political opponents with harassment and politically motivated legal sanctions.
Judicial deference. This attribute reflects two principles related to checks on political authority:
- The judiciary is able to effectively limit executive power
- The elected branches respect judicial independence
Institutional checks on executive authority are widely regarded as an essential component of liberal democracy (V‑Dem 2017). Respect for court decisions, even politically unfavorable ones, is essential to the effectiveness of such checks and to the rule of law more generally. Efforts by politicians to intimidate judges — for instance, by portraying them as corrupt or incompetent and questioning the legitimacy of their decisions — frequently signal the early stages of democratic erosion (Mounk 2018; Levitsky and Ziblatt 2018).
Compromise. This attribute reflects a principle related to norms of behavior among public officials:
- Elected officials seek compromise with political opponents
Willingness to compromise is a democratic value. The peaceful resolution of political conflict requires acceptance of policy outcomes that are less than outright victories. Indeed, Levitsky and Ziblatt (2018) contend that mutual toleration among political adversaries and forbearance in exercising power — which, together, describe compromise — are the “master norms” that sustain all other democratic principles, including the rule of law, electoral integrity, and guarantees of individual rights.
In September 2017, we asked a representative sample of Americans to rate each of the eight principles itemized above (along with 19 others) as either “Not relevant,” “Beneficial,” “Important,” or “Essential” to democracy. Majorities valued all eight, but based on the percentage of participants who rated each as either “important” or “essential,” we found substantial variation in priority across items.
The importance of equal voting rights was ranked near the top of the list by the public (89% important or essential) though high levels of electoral participation were somewhat lower (74%). The principles associated with accountability were also rated high by most respondents, who indicated that public office-holders should be sanctioned for misconduct (84%), that investigations should not be compromised by politics (84%), and that government agencies should be politically neutral (80%). Institutional checks on authority came in just behind, with 82% and 77% rating judicial independence and the judiciary’s ability to limit executive authority as important or essential, respectively.
By contrast, only 59% rated the norm of seeking compromise with political opponents to be important or essential. The relatively low priority the public attaches attached to compromise is potentially at odds with the centrality of mutual toleration and forbearance to Levitsky and Ziblatt (2018). If they are correct, then the value that participants place on compromise in this experiment is especially important to measuring the public’s commitment to American democracy.
More generally, as we examine the results of our candidate choice experiment, we focus attention on how participants react to each candidate attribute and to the relative impact of those related to partisanship, to policy positions, and to democratic principles.
Candidate choices: Republicans, Democrats, and independents
Our experiment confirms the overwhelming importance of partisanship in Americans’ political behavior. Figure 2 illustrates the relative effect of each attribute on the likelihood of voters supporting a candidate for Republican respondents (left panel), Democrats (middle panel) and independents (right panel). [7] [8] Each attribute is assigned a “baseline” level, which serves as our point of comparison. [9] Each dot in Figure 2 represents the estimated change, relative to the baseline, in the likelihood of a respondent supporting a candidate with that characteristic (for example, being a Democrat) compared to the baseline value (for partisanship, Republican), if all other candidate characteristics were held equal. Dots to the right of the vertical line in each panel indicate positive effects, and dots to the left of the line negative ones. [10] The horizontal lines extending through these dots are “confidence intervals” indicating statistical uncertainty around those estimated effects. [11]
Figure 2: Candidate preferences among Republicans, Democrats, and independents
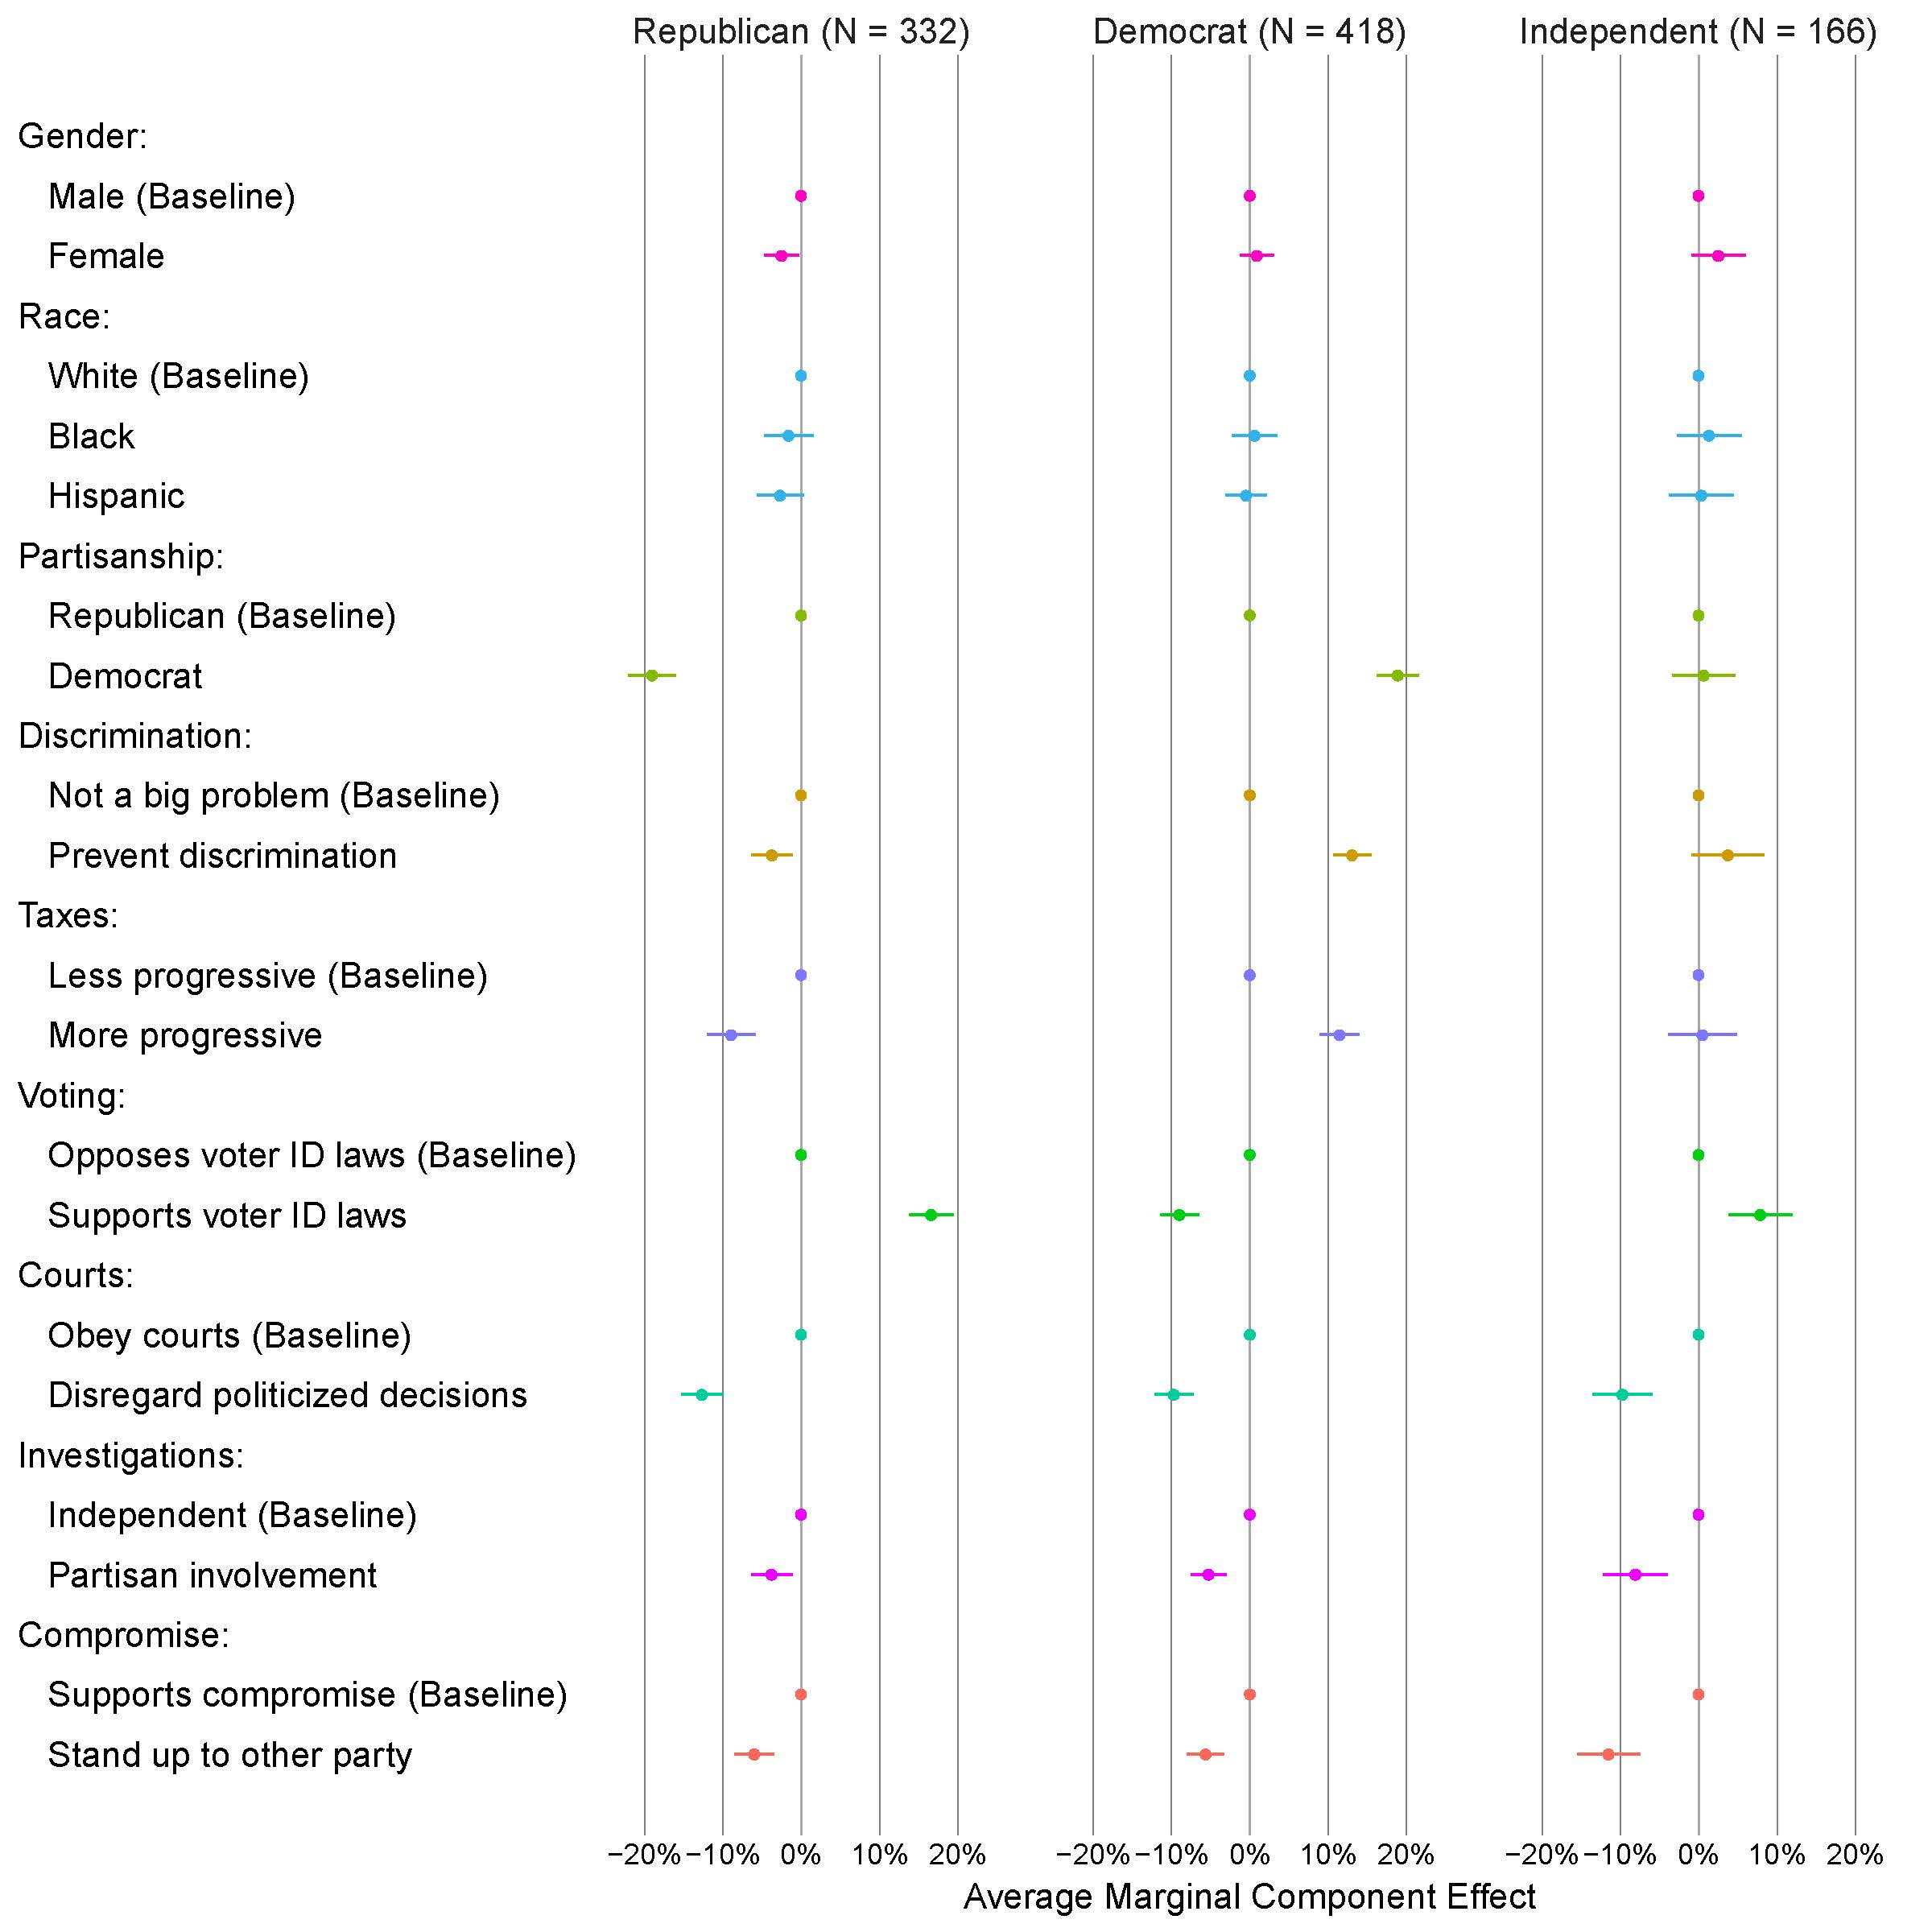
The effects of candidate partisanship are formidable. All else equal, Republicans are 19 percentage points more likely to select a Republican candidate than a Democratic one. Partisanship is symmetrical on the other side of the aisle. Democrats are similarly 19 percentage points more likely to select a fellow Democrat than a Republican. It is worth underscoring that these effects are independent of candidate characteristics, policy positions, or democratic values, all of which varied randomly across the composite candidates from which participants chose. Independents, true to their name, appear indifferent between the two parties — they are no more likely to select a Republican than a Democrat.
Partisanship far outweighs demographic traits in shaping voters’ choices. Race/ethnicity does not significantly shift the choices of either partisan group or of independents. That is, the effects of a candidate having a typically black or Hispanic name rather than a white one are not distinguishable from zero for any partisan group. Among Democrats or independents, there is similarly no measurable effect of candidate gender, whereas Republicans are 2.5 percentage points less likely to select a woman than a man, other things equal (and the effect just reaches statistical significance). On the whole, the effects of race/ethnicity and gender on candidate choice are slight.
Policy positions tend to have a larger effect on respondents’ choices than candidate demographics. Republicans are nearly nine percentage points less likely to select a candidate who wants to increase taxes on the wealthy than one who wants to reduce taxes across the board, whereas Democrats are 11.5 percentage points more likely to select a candidate who wants to increase taxes on the wealthy. Independents are, once again, in the middle; a candidate’s policy position on taxes has no measurable effect on their choices.
Similarly, though the race and gender of candidates themselves has little impact on participants’ choices, candidates’ stances on discrimination and affirmative action do matter. Republicans are 3.8 percentage points less likely to select a candidate who wants the government to do more to protect minorities than one who thinks discrimination is less of a problem now than in the past. Democrats, in sharp contrast, are 13.1 percentage points more likely to select candidate who wants the government to do more to protect minorities. Here, independents appear to lean slightly toward the Democratic position, although the estimate falls short of statistical significance.
In short, these controversial policy issues still divide partisans. The effects of our taxation and racial discrimination policy positions on candidate choices are not as large as the effects of party labels, but they are powerful.
Democratic principles and candidate choice
Notably, candidates’ stances on democratic principles make a difference in voters’ willingness to support them even after accounting for the candidate’s traits, party, and policy positions. In most instances, voters punish candidates who hold positions antithetical to the democratic principles that map onto those from our Bright Line Watch surveys, as described above. We specifically estimate the effect of taking four positions that violate these values: restricting voter access, disregarding unfavorable judicial decisions, politicizing investigations, and seeking confrontation over compromise. On three of these issues, democratic values are supported by all three groups: Republicans, Democrats, and independents. On ballot access, however, preferences diverge by party.
Specifically, we find that a candidate who questions judicial authority rather than deferring to it is 12.7 percentage points less likely to be selected by Republicans, 9.7 percentage points less likely to be selected by Democrats, and 9.7 percentage points less likely to be selected by independents. These estimates are statistically indistinguishable from each other. Likewise, a candidate who favors political control over investigations to neutrality is nearly four percentage points less likely to win the support of Republican voters, 5.3 percentage points less likely among Democratic voters, and 8.1 percentage points less likely among independents. Again, the differences by party are not significant — from a statistical standpoint, Republicans, Democrats, and independents are equally inclined to punish partisan investigations.
In turn, a candidate who promises to stand up to the other party rather than to seek compromise is 6.0 percentage points, 5.6 percentage points, and 11.5 percentage points less likely to be selected by Democrats, Republicans, and independents, respectively. In this case, the differences between Democrats and independents, and between Republicans and independents, are statistically significant. Both Republicans and Democrats value cross-party compromise and reward candidates who promise to seek it, but independents value compromise more.
In sum, there is consensus across parties on the three democratic principles of judicial deference, independent investigations, and compromise. Participants from all groups reward candidates who espouse these principles and punish those who do not.[12]
By contrast, we see sharp partisan polarization on voting rights. Republican participants are 16.6 percentage points more likely to select a candidate who supports voter ID laws than one who opposes them. This effect is larger than for any other attribute except the candidate’s party label itself. (Independents also prefer candidates who support voter ID laws and are more likely to support them by 7.9 percentage points.) Democrats have the opposite preference. If a candidate supports voter ID laws, Democratic participants are 8.9 percentage points less likely to select the candidate, all else equal. Overall, a candidate who supports voter ID laws is more likely to be selected than one who opposes them across our full sample of participants.
What does this tell us about party, policy, and democracy?
The question of how voters make tradeoffs between party, policy, and democratic principle could not be more relevant. In the wake of the 2018 midterm elections, we have seen the integrity of the Mueller investigation come under threat with the forced resignation of Attorney General Jeff Sessions and President Trump’s controversial appointment of an acting replacement who may quash the investigation. In Georgia, where the election is still being contested, Republicans must choose whether to support a gubernatorial candidate who shares their party and policy preferences but faces allegations of voter suppression. Similarly, Florida governor Rick Scott has threatened to use state law enforcement to intervene in the vote count in his race for U.S. Senate, prompting a sharp tradeoff between partisan and democratic loyalties for Republicans.
Our results provide both encouraging and sobering conclusions about the American public’s democratic priorities in this difficult context. Not surprisingly, respondents divide sharply on partisanship and on policy preferences, which reflects the state of contemporary American politics and reassures us that our candidate choice experiment worked as intended.
Consistent with previous BLW studies, we also find that partisans are most likely to find common ground on matters of rule of law and accountability. Participants from both parties (as well as independents) support candidates who promise to respect court decisions and those who prioritize the impartiality of investigations into wrongdoing. They also support candidates who advocate for compromise rather than confrontation across the partisan divide. By contrast, candidates who would politicize investigations, flout court decisions, or who broadcast intransigence toward the other party may be crossing “bright lines;” they are less likely to be selected by voters of both parties as well as by independents. Not all political values, then, are polarized in our current context.
We urge caution, however, in interpreting these seemingly encouraging findings. Democrats and Republicans both prefer candidates who favor politically impartial investigations, but conceptions of impartiality might well differ across parties. Democrats tend to regard Robert Mueller’s investigation as politically unbiased but Republicans view it quite differently. Previous Bright Line Watch research has found consensus, for example, between supporters and opponents of President Trump that public officials should be punished for malfeasance, but those groups might well have different officials or types of wrongdoing in mind.
We also find troubling levels of partisan polarization on the key democratic value of equal voting rights, reflecting a fundamental division over who should be included in, and excluded from, the political community. Democrats and Republicans respond divergently to candidates who support voter ID laws that would restrict participation in elections and whose burdens could disenfranchise racial minorities at far higher rates than whites.
It is likely that both sides would claim that they are supportive of free and fair elections, Republicans by combating voter fraud, Democrats by offering equal access to the polls. These positions echo those of party leaders. The evidence demonstrates, however, that voter fraud is exceedingly rare (Levitt 2007, Minnite 2010, Cottrell, Herron, and Westwood 2018). Moreover, strict voter ID laws are most frequently — though not exclusively — found in Southern states with a history of racially discriminatory forms of election administration.
What strategies do our results suggest for those concerned about democratic erosion or backsliding in the U.S.? Cross-party agreement that partisanship should not play a part in investigations may partly reflect weariness with politically motivated inquiries (as in the Clinton impeachment). With Democrats poised to take over the House of Representatives, this dynamic is likely continue. In some settings, legislative arms races are brought to a halt through a kind of agreed-upon mutual restraint, as both sides tire of conflict that does not offer a lasting advantage to either side. We are nowhere near such a “cease-fire” in the U.S. today. But our survey provides evidence that the public (and particularly independents) might be open to one.
By contrast, such an accord seems still further away on ballot access, an issue where one major party benefits at the expense of the other. Is there no room for a shift away from this anti-democratic practice? Looking beyond the polarization evident in our experiment, we see some potentially encouraging signs. First, strict voter ID laws have not consistently diminished turnout among minorities in practice (Citrin, Green, and Levy 2014, Valentino and Neuner 2016, Grimmer et al. 2018, Aytaç and Stokes 2018; but see Hajnal, Lavejardi, and Nielson 2017). Just as these efforts make it harder for voters to cast ballots, they also can motivate mobilization and voter turnout. Such backlash effects could make tactics that restrict access to the franchise somewhat less appealing, especially if they produce lasting change in partisanship or turnout in the communities that are disproportionately affected (most notably, Hispanics).
Finally, we note the outcome last week of the referendum on Florida’s Amendment 4, which reinstates voting rights for ex-felons who have completed their sentences. The measure won 61% of votes among Florida’s evenly divided electorate, which indicates that substantial numbers of Republicans supported it. For instance, prominent evangelicals argued in its favor as consistent with the Christian ideal of redemption. So although voter ID provisions divide the parties, it may yet be possible for the principle of inclusive suffrage and broad voting participation to gain purchase across partisan lines.
Appendix
Polarization, and consensus, across other groups
Our data allow us to compare survey participants by not only their partisanship, but across other salient demographic and attitudinal divides. We can, for example, break out our participants by their age, education level, level of political knowledge, or level of interest in politics to evaluate other differences in democratic preferences.
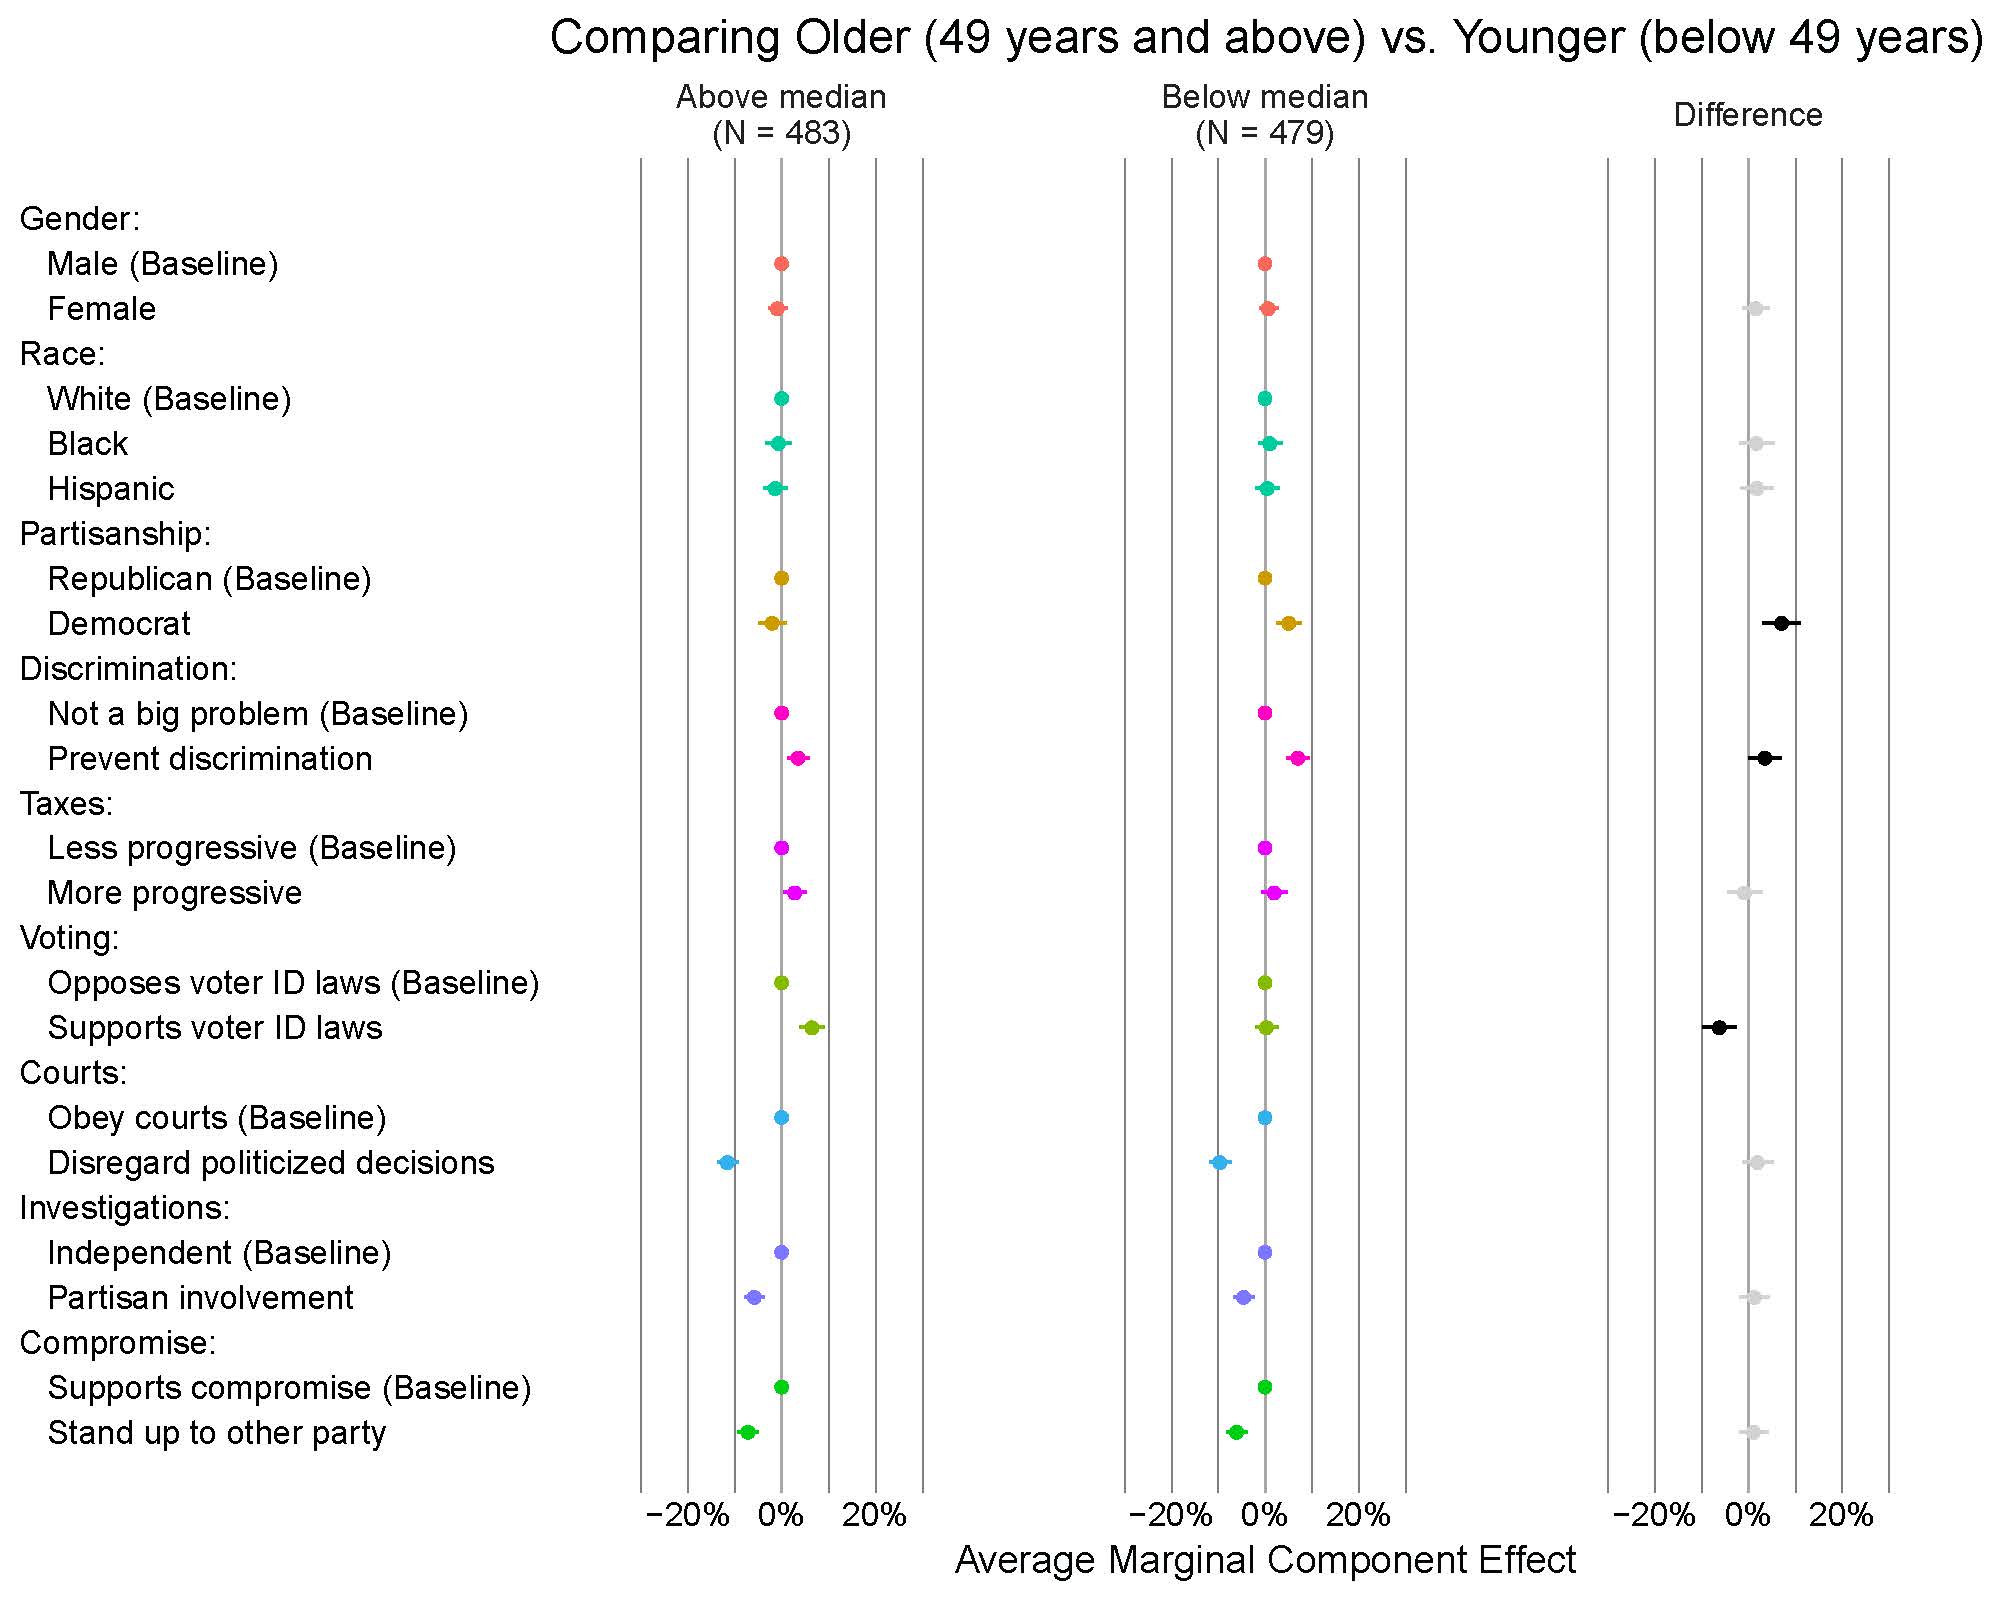
We begin by considering differences by age. Some scholars have argued that younger generations of Americans are increasingly cynical about democracy (Foa and Mounk 2016, Drutman, Diamond, and Goldman 2018a, 2018b), while others hold that older adults have less faith in democratic institutions (Voeten 2017). However, we find little evidence for either hypothesis when we compare participants who are 49 years old and above (the median age in our sample) to those who are younger — the effects of supporting democratic values on judicial deference, investigations, and compromise do not measurably differ between older and younger participants. We do, however, find that positions on voter ID laws have no measurable effect on candidate support among younger voters, while older participants are 6.5 percentage points more likely to select a candidate who supports them. (The difference between the groups is statistically significant.)
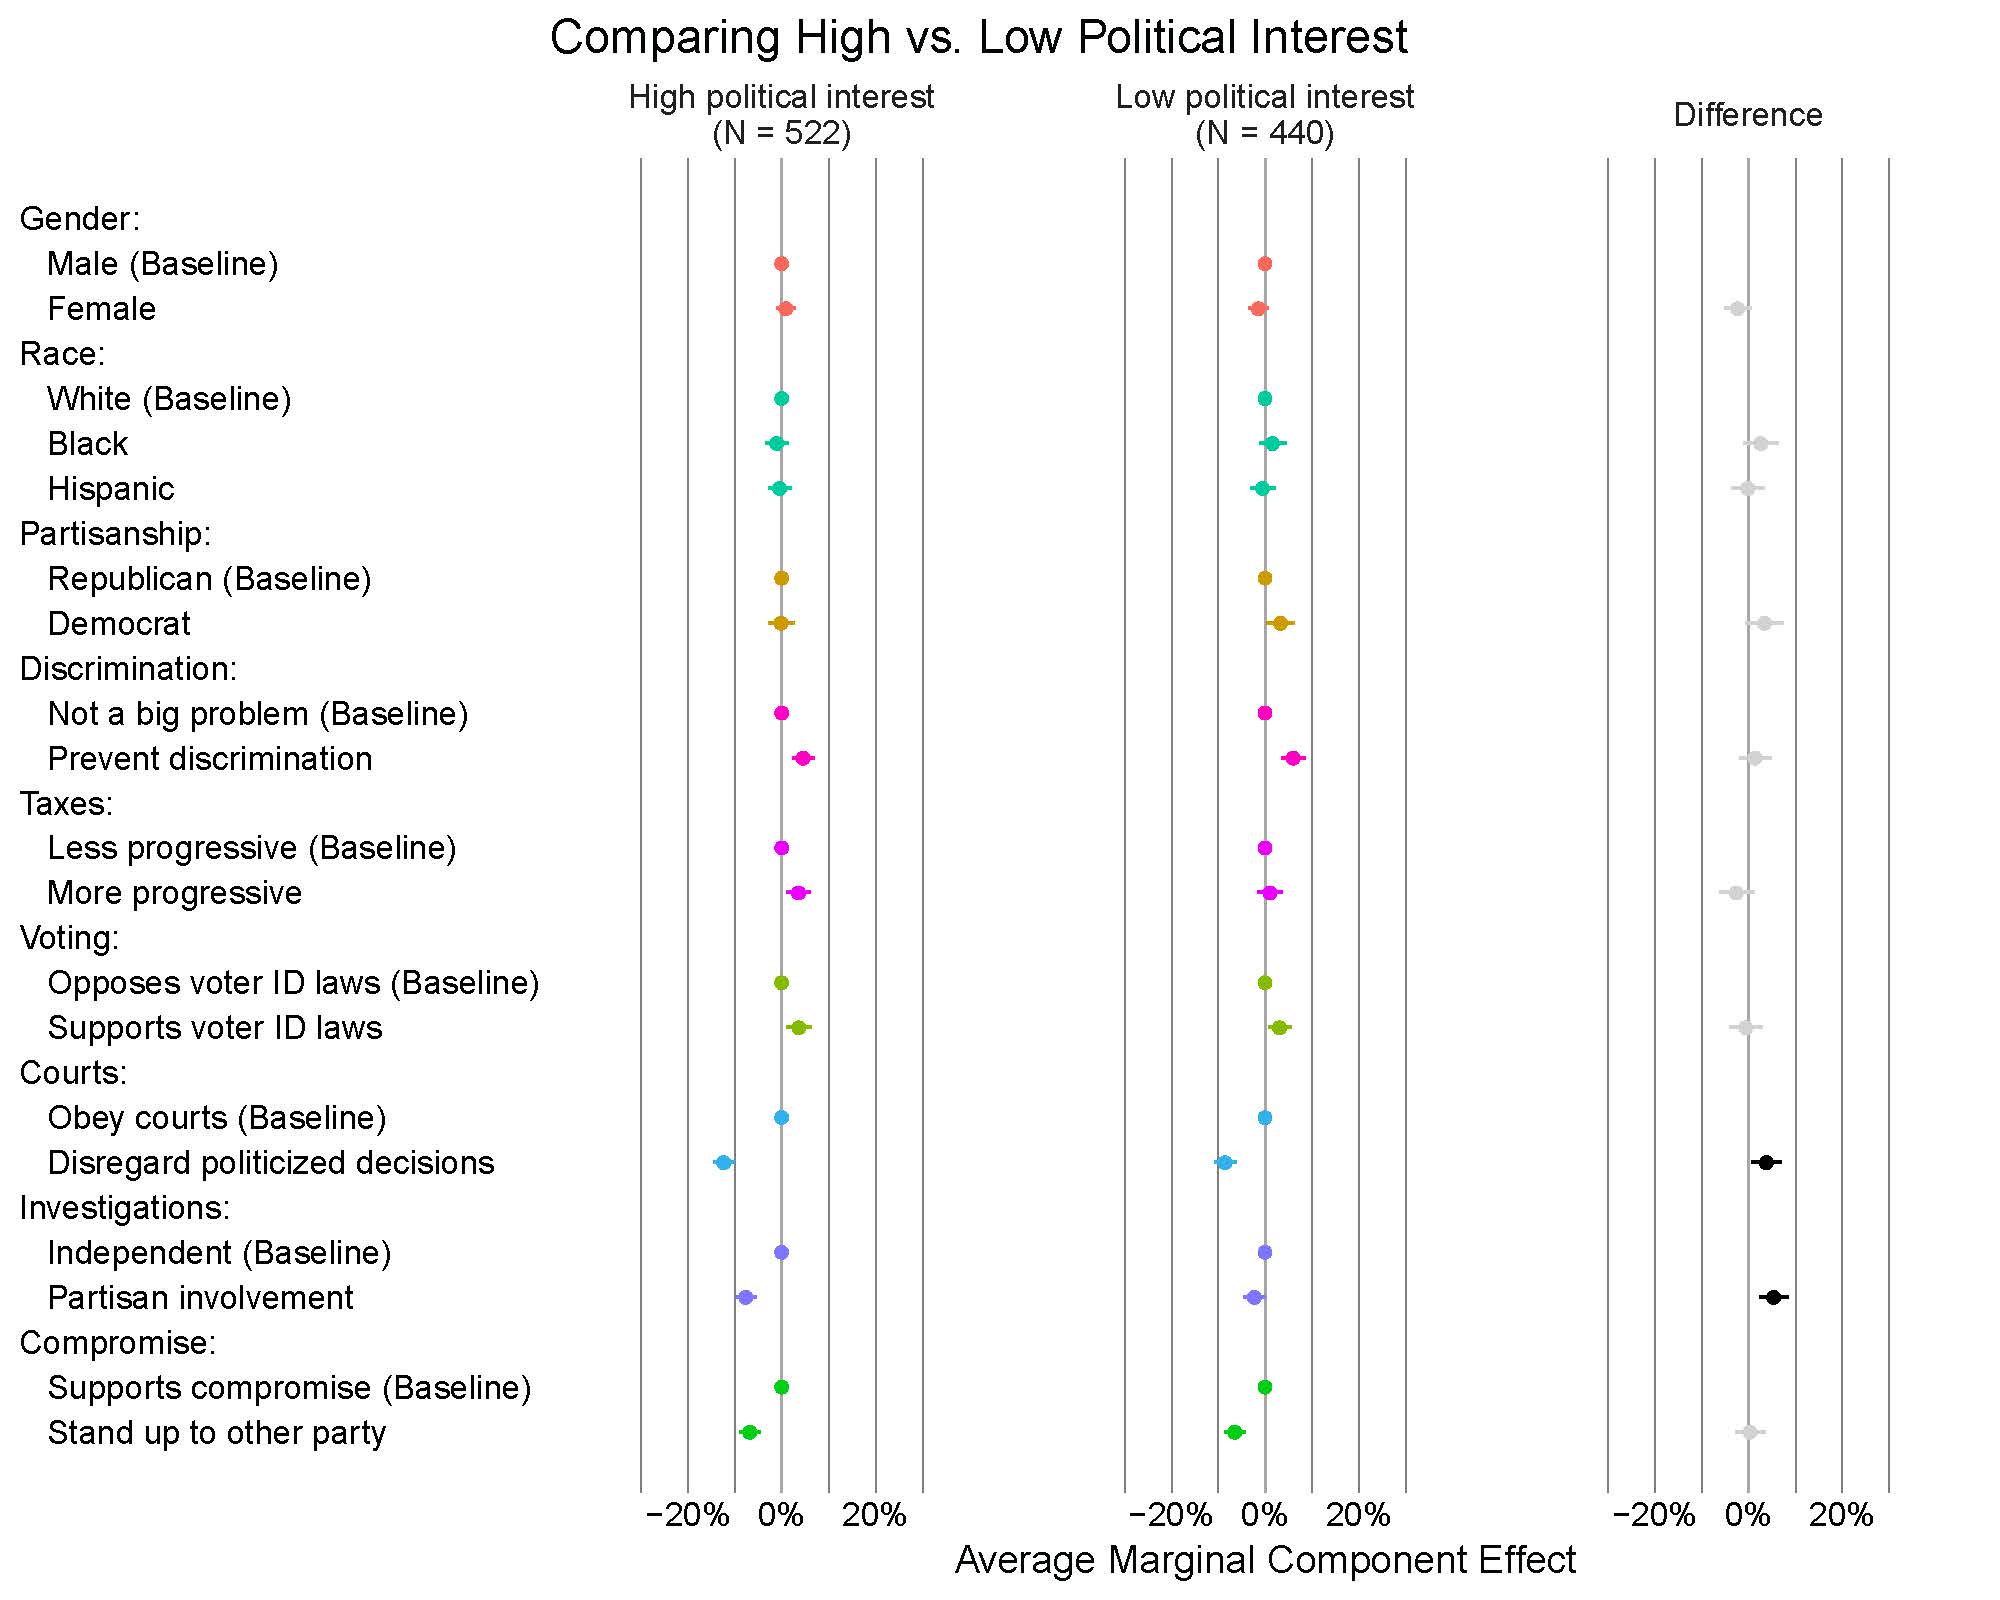
Turning to education level, political knowledge, and political interest, we asked participants in our survey to report their education level, to answer a series of five questions on politics (Carpini and Keeter 1993), and to report their level of interest in politics. For education level, we divided respondents into groups based on whether they hold a bachelor’s degree, while for political knowledge, we used the number of correct responses they provided to classify them as having high or low knowledge of politics (using a median split). Finally, we classified participants who are “extremely interested” or “very interested” in politics as having high political interest and those who are “somewhat,” “not very,” or “not at all” interested in politics as low in political interest.
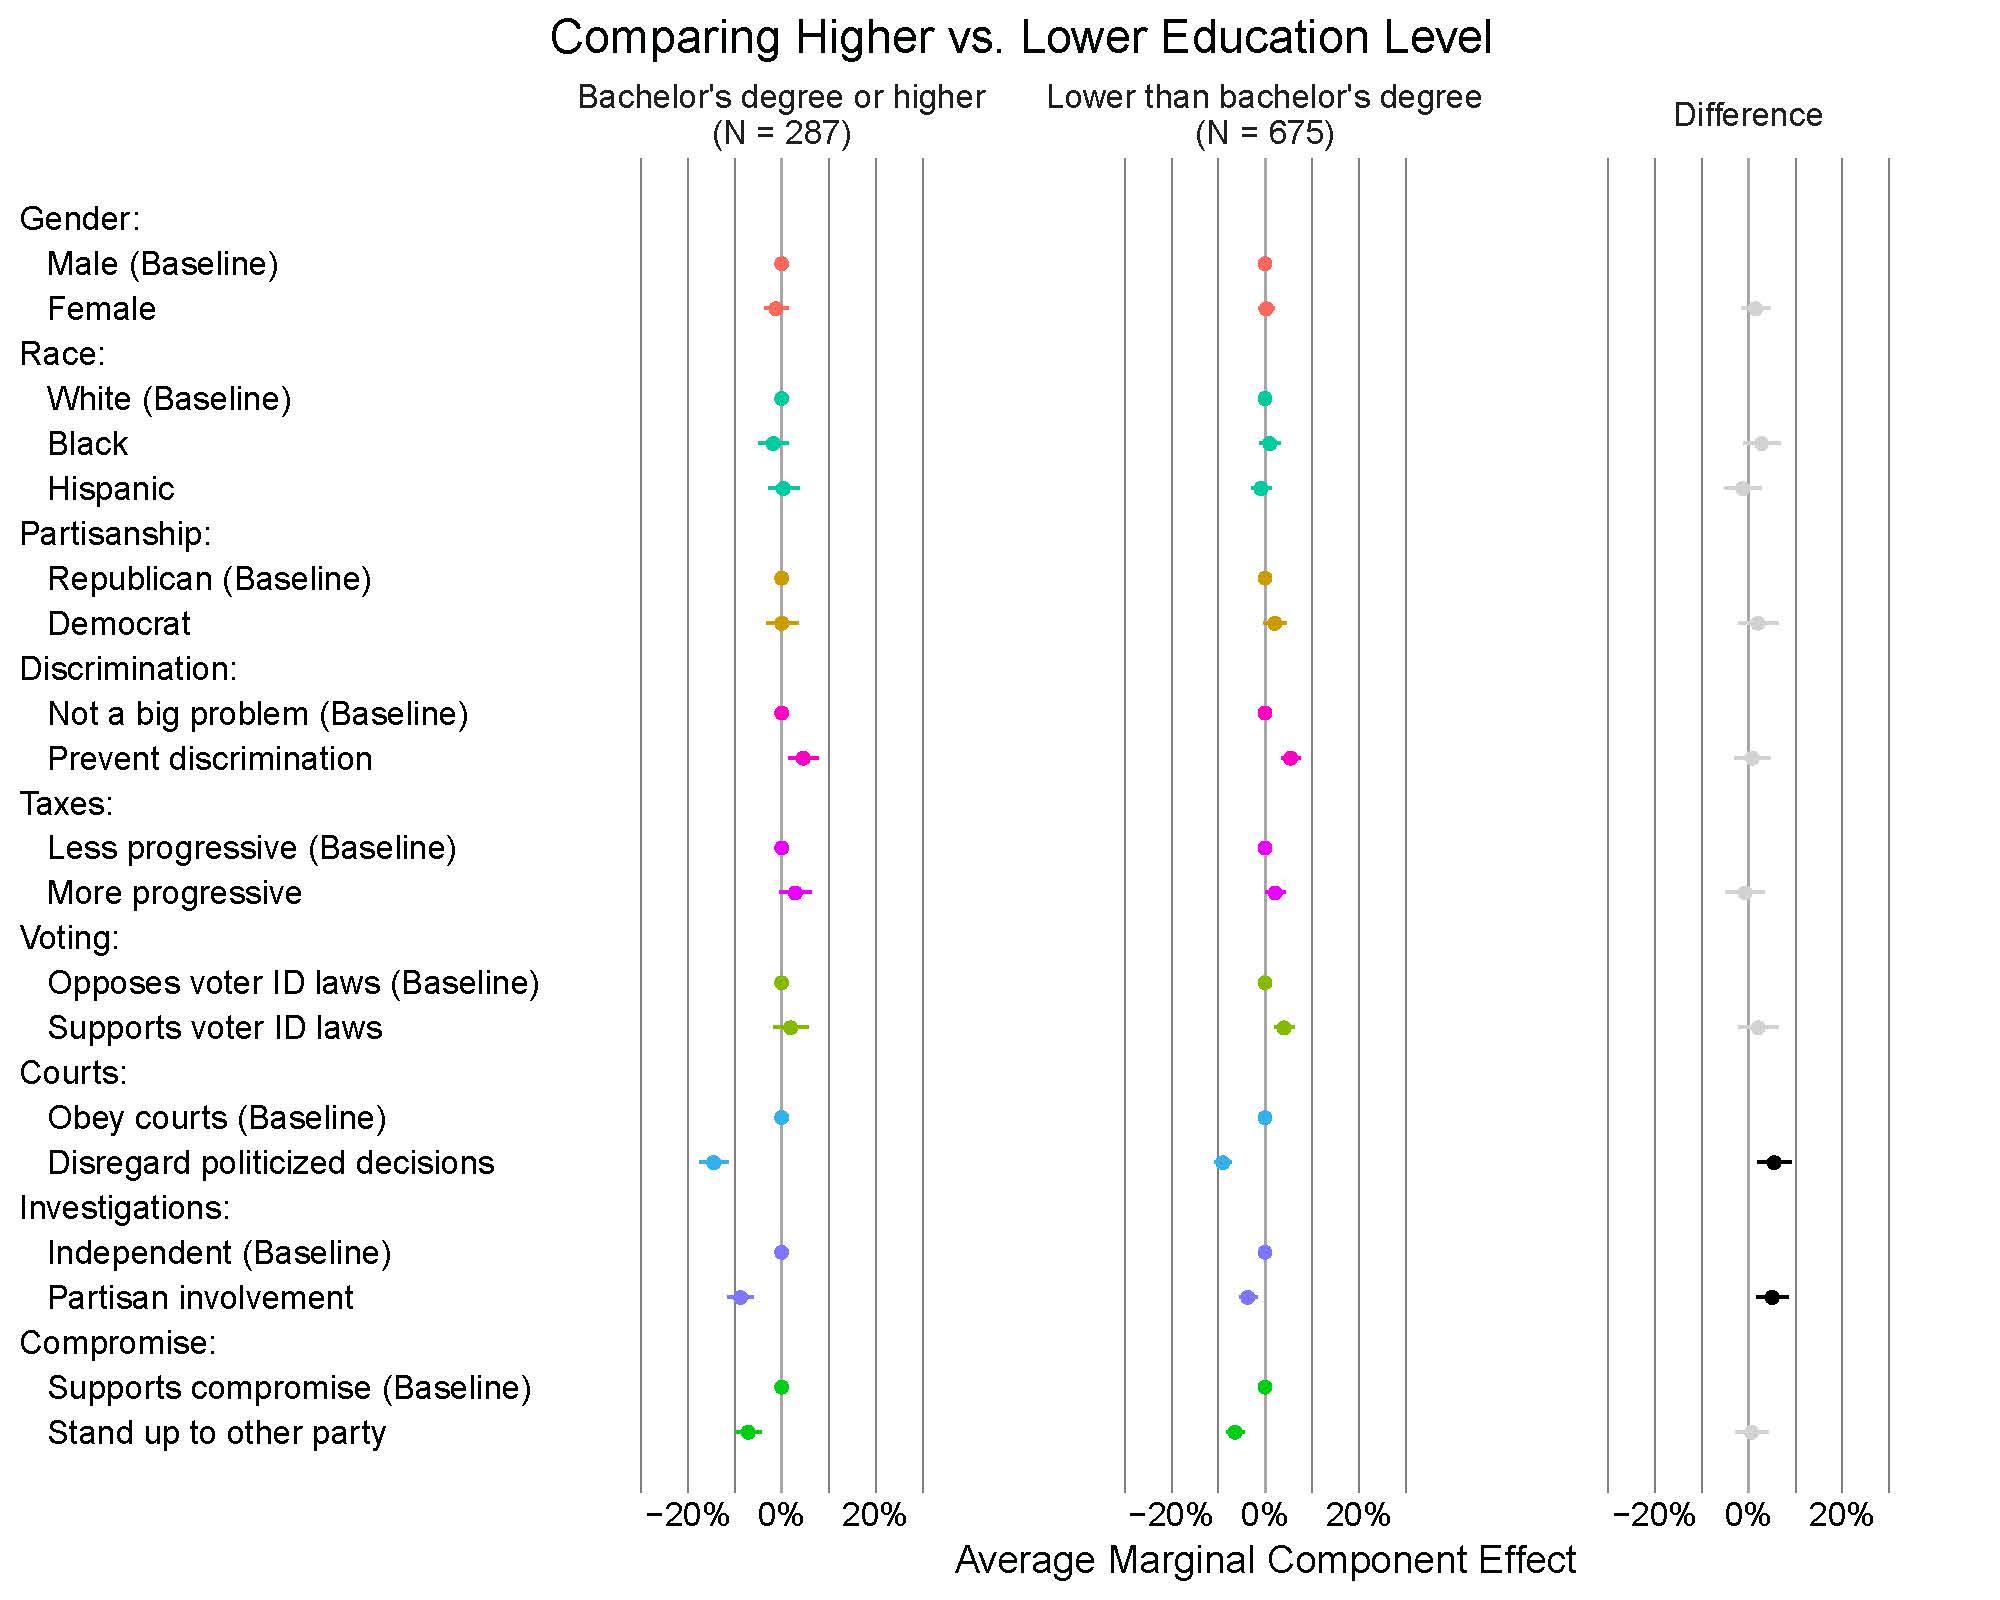
Research suggests that support for democracy is weakest among the least educated and the least interested in politics (Drutman, Diamond, and Goldman 2018a, 2018b). To an extent, our results corroborate this account. Participants with a bachelor’s degree or higher are 8.8 percentage points less likely to select a candidate who says elected officials should supervise investigations than one who says investigations should be free from partisan influence, while those with less than a bachelor’s degree are 3.7 percentage points less likely to select the candidate. More educated participants are also 14.5 percentage points less likely to support a candidate who says elected officials should not be bound by politicized decisions than one who says politicians should obey the courts; the estimate for less educated participants is 9.0 percentage points. For both attributes, the differences between more and less educated participants are significant at the 95% confidence level. These results replicate when we compare participants by their level of political knowledge (7.8 percentage points versus 1.3 percentage points for investigations, and 13.5 percentage points versus 6.2 percentage points for courts) or political interest (7.7 percentage points vs 2.3 percentage points for investigations, and 12.4 percentage points versus 8.5 percentage points for courts). For the attributes on voter ID laws and compromise, we find no significant differences by education level, political knowledge, or political interest, with all groups slightly favoring candidates who support voter ID laws and who promise to work for compromise across party lines. [13]
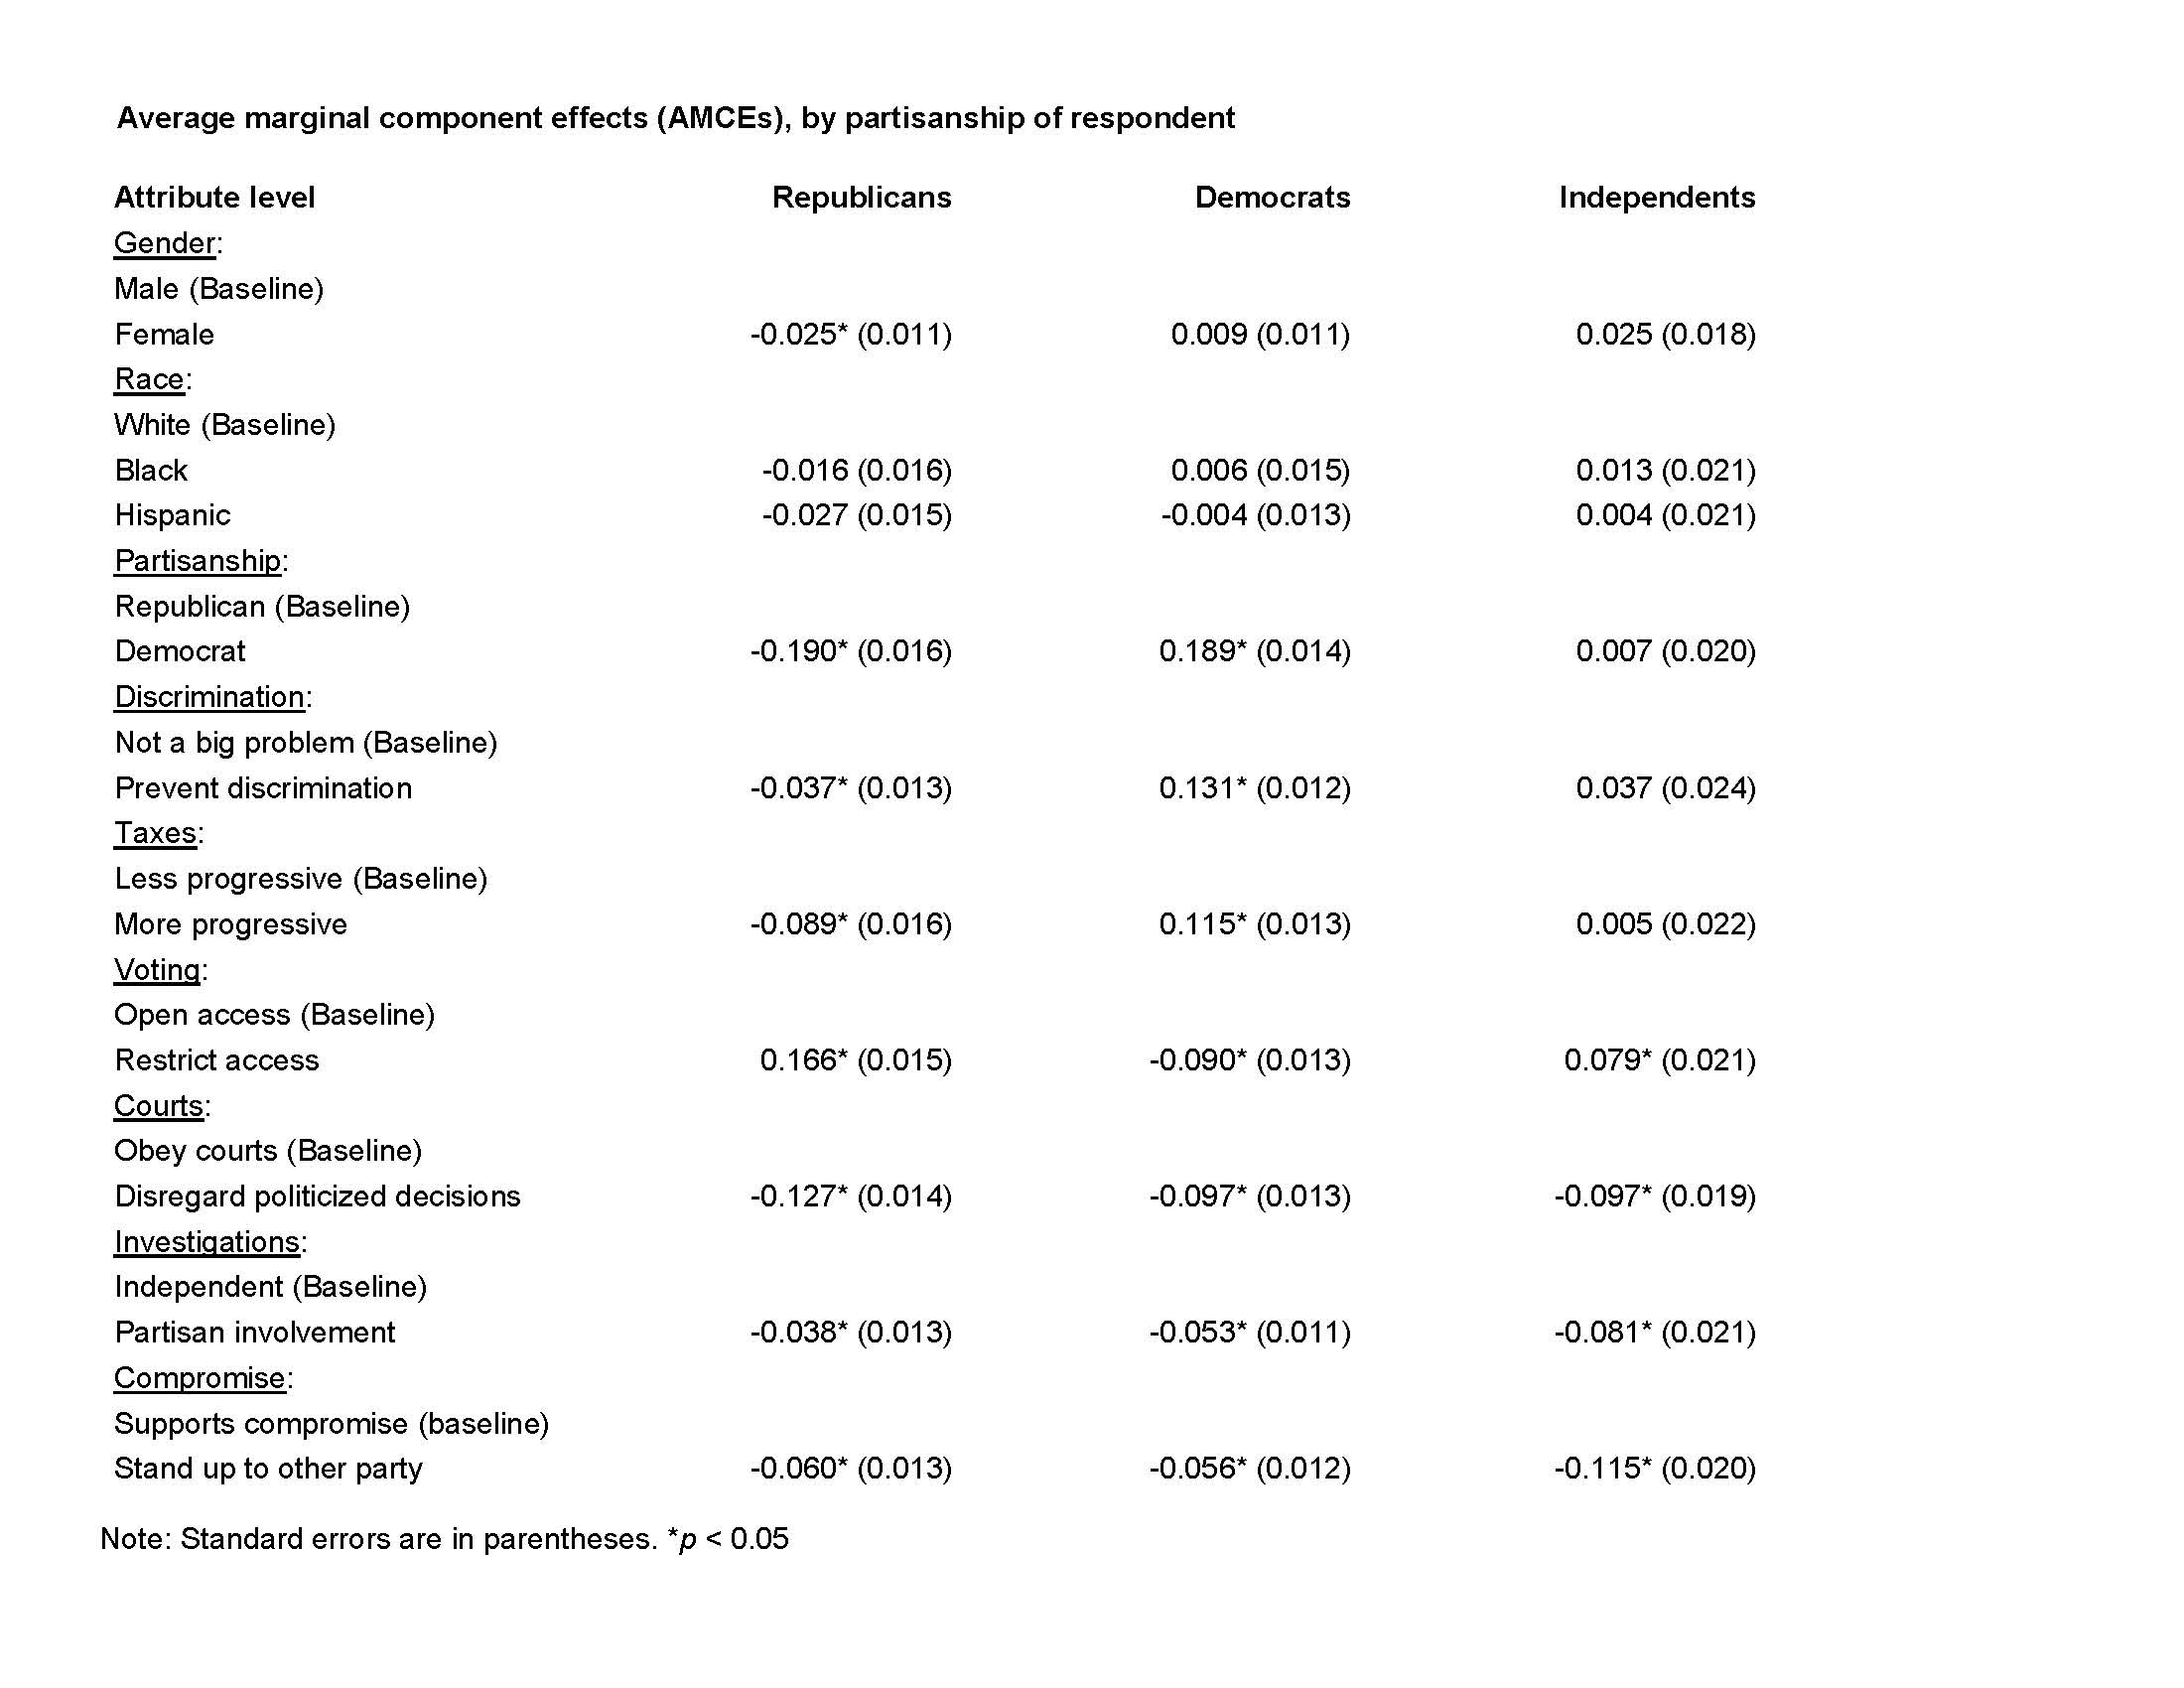
Average marginal component effects among Republicans, Democrats, and independents
The chart below shows the point estimates for each attribute-level, relative to a baseline, as depicted in Figure 2.
Notes
[1] In their candidate choice experiment, Graham and Svolik (2018) also find that partisan and policy considerations have much stronger effects on vote choice than “undemocratic” platforms related to electoral fairness or checks and balances.
[2] Concurrent with our survey experiment, we also conducted our seventh expert survey, and fifth public survey, to investigate how Americans rate the performance of their democracy on 27 distinct democratic principles. Our expert survey also included assessments of the importance of 27 notable recent political events and evaluations of how (ab)normal they are. See our Bright Line Watch report on these findings and the raw data for more information.
[3] This distribution approximates that from a March 2018 Pew poll that found 43%, 46%, and 11%, for Democrats, Republicans, and independents, respectively. The slight discrepancies we find may be partially attributable to wording differences between the partisanship question on the surveys.
[4] Each participant in the experiment saw ten pairs of candidates. Candidate names always appeared at the top followed by partisanship. This format approximates how information about candidates is often supplied to voters, for example in voter guides or in newspapers. Beyond name and partisanship, we randomized the order of the policy and democracy attributes across participants so that, on the whole, their placement (lower or higher in the tables) would not affect their relative salience.
[5] Our list of candidate names come from Butler’s (2014) audit study on racial discrimination among legislators, which used information from previous studies of racial discrimination (Fryer and Levitt 2004, Word et al. n.d.) and from the U.S. Census to compile a list of 123 common putatively white, black, and Hispanic first and last names. The full list is included in Butler and Homola (2017). We used candidate names to signal gender and race/ethnicity for a number of reasons. First, using names increases realism. Second, using a name to signal both gender and race/ethnicity is economical in terms of space in the survey instrument. Finally, using names reduces concerns about social desirability bias in survey responses while still allowing us to estimate how gender and race/ethnicity affect preferences between candidates (for example, Bertrand and Mullainathan 2004, Broockman 2013, DeSante 2013, White, Faller and Nathan 2015, Doherty, Dowling, and Miller 2018).
[6] Candidate gender was randomized with probability 0.5. Candidate race/ethnicity was randomized to be white, black, or Hispanic with probabilities 0.6, 0.2, and 0.2, respectively, to better approximate race/ethnicity in the general population and among candidates for public office in contemporary campaigns (Bialik and Krogstad 2017, U.S. Census Bureau 2017, Reflective Democracy Campaign 2018).
[7] We follow the convention of grouping independents who “lean” toward one party or the other with self-identified partisans (Petrocik 2009, Hawkins and Nosek 2012). Our survey included a question designed to screen out respondents who do not provide sincere responses to surveys. 3.8% of our respondents were removed from the sample on the basis of their response to that item.
[8] All the estimates, and standard errors, presented in the figure are also presented in a table format in the appendix.
[9] Any level, or value, may serve as the baseline. Most of our attributes take only two levels, though race/ethnicity can take three (white, black, or Hispanic). In that case, we use white as the baseline because it is the most commonly observed among elected officials (Reflective Democracy Campaign 2018).
[10] The dots for the baseline level of each attribute are, by definition, located on the vertical line at zero.
[11] If the confidence interval touches or crosses the vertical line, then we cannot say with more than 95% confidence whether the estimated effect is different from zero. By contrast, if the interval does not overlap the vertical line, the result is statistically distinguishable from zero at the 95% confidence level.
[12]Graham and Svolik (2018) also find that commitments to democratic principles related to checks and balances and to electoral fairness are roughly symmetric across the partisan divide.
[13] For participants with a bachelor’s degree or higher, there is no significant difference in likelihood of support for candidates who support versus oppose voter ID laws.
References
Alexander, Amy C. and Christian Welzel. 2017. “The Myth of Deconsolidation: Rising Liberalism and the Populist Reaction.” Journal of Democracy. Downloaded November 9, 2018 from https://www.journalofdemocracy.org/online-exchange-“democratic-deconsolidation”.
Ansolabehere, Stephen, and Eitan D. Hersh. 2017. “ADGN: An Algorithm for Record Linkage Using Address, Date of Birth, Gender, and Name.” Statistics and Public Policy 4 (1). Taylor & Francis: 1–10.
Arnesen, Sveinung, Dominik Duell, and Mikael Poul Johannesson. 2019. “Do Citizens Make Inferences from Political Candidate Characteristics When Aiming for Substantive Representation?” Forthcoming, Electoral Studies.
Aytaç, S. Erdem, and Susan C. Stokes. 2018. Why Bother? Rethinking Participation Elections and Protests. Cambridge, U.K.: Cambridge University Press
Azari, Julia. 2016. “Weak Parties and Strong Partisanship Are a Bad Combination.” Vox. https://www.vox.com/mischiefs-of-faction/2016/11/3/13512362/weak-parties-strong-partisanship-bad-combination.
Bartels, Larry M. 2018. “Partisanship in the Trump Era.” Working paper, available at: https://www.vanderbilt.edu/csdi/includes/Workingpaper2_2108.pdf.
Bialik, Kristen, and Jens Manuel Krogstad. 2017. “115th Congress Sets New High for Racial, Ethnic Diversity.” Pew Research Center. http://www.pewresearch.org/fact-tank/2017/01/24/115th-congress-sets-new-high-for-racial-ethnic-diversity/.
Broockman, David E. 2013. “Black Politicians Are More Intrinsically Motivated to Advance Blacks’ Interests: A Field Experiment Manipulating Political Incentives.” American Journal of Political Science 57 (3): 521–36.
Butler, Daniel M. 2014. Representing the Advantaged: How Politicians Reinforce Inequality. Cambridge, U.K.: Cambridge University Press.
Butler, Daniel M., and Jonathan Homola. 2017. “An Empirical Justification for the Use of Racially Distinctive Names to Signal Race in Experiments.” Political Analysis 25 (1): 122–30.
Carpini, Michael X. Delli, and Scott Keeter. 1993. “Measuring Political Knowledge: Putting First Things First.” American Journal of Political Science 37 (4): 1179–1206.
Citrin, Jack, Donald P. Green, and Morris Levy. 2014. “The Effects of Voter ID Notification on Voter Turnout: Results from a Large-Scale Field Experiment.” Election Law Journal: Rules, Politics, and Policy 13 (2): 228–42.
Cottrell, David, Michael C. Herron, and Sean J. Westwood. 2018. “An Exploration of Donald Trump’s Allegations of Massive Voter Fraud in the 2016 General Election.” Electoral Studies 51: 123–142.
DeSante, Christopher D. 2013. “Working Twice as Hard to Get Half as Far: Race, Work Ethic, and America’s Deserving Poor.” American Journal of Political Science 57 (2): 342–56.
Doherty, David, Conor M Dowling, and Michael G Miller. 2018. “Do Party Chairs Think Women and Minority Candidates Can Win? Evidence from a Conjoint Experiment.” Forthcoming, The Journal of Politics.
Drutman, Lee, Larry Diamond, and Joe Goldman. 2018a. “Follow the Leader: Explaining American Support for Democracy and Authoritarianism.” Report prepared for the Democracy Fund Voter Study Group, available at: https://www.voterstudygroup.org/publications/2017-voter-survey/follow-the-leader.
Drutman, Lee, Larry Diamond, and Joe Goldman. 2018b. “Testing the Limits: Examining Public Support for Checks on Presidential Power.” Report prepared for the Democracy Fund Voter Study Group, available at: https://www.voterstudygroup.org/publications/2017-voter-survey/testing-the-limits.
Fishkin, Joseph, and David E. Pozen. 2018. “Asymmetric Constitutional Hardball.” Columbia Law Review 118.
Foa, Roberto Stefan, and Yascha Mounk. 2016. “The Danger of Deconsolidation: The Democratic Disconnect.” Journal of Democracy 27 (3): 5–17.
Foa, Roberto Stefan, and Yascha Mounk. 2017. “The Signs of Deconsolidation.” Journal of Democracy 28 (1).
Fryer, Roland, and Steven Levitt. 2004. “The Causes and Consequences of Distinctively Black Names.” Quarterly Journal of Economics 119 (3): 767–805.
Graham, Matthew, and Milan W. Svolik. 2018. “Democracy in America? Partisanship, Polarization, and the Robustness of Support for Democracy in the United States.” Working paper, available at: https://cpb-us-w2.wpmucdn.com/campuspress.yale.edu/dist/6/1038/files/2012/12/USA_web-1dnax02.pdf.
Grimmer, Justin, Eitan Hersh, Marc Meredith, Jonathan Mummolo, and Clayton Nall. 2018. “Obstacles to Estimating Voter ID Laws’ Effect on Turnout.” The Journal of Politics 80 (3): 1045–51.
Hajnal, Zoltan, Nazita Lajevardi, and Lindsay Nielson. 2017. “voter ID Laws and the Suppression of Minority Votes.” The Journal of Politics 79 (2): 363–79.
Hawkins, Carlee Beth, and Brian A. Nosek. 2012. “Motivated Independence? Implicit Party Identity Predicts Political Judgments Among Self-Proclaimed Independents.” Personality and Social Psychology Bulletin 38 (11): 1437–1452.
Hainmueller, Jens, Daniel J Hopkins, and Teppei Yamamoto. 2013. “Causal Inference in Conjoint Analysis: Understanding Multidimensional Choices via Stated Preference Experiments.” Political Analysis 22 (1): 1–30.
Huddy, Leonie, Lilliana Mason, and Lene Aarøe. 2015. “Expressive Partisanship: Campaign Involvement, Political Emotion, and Partisan Identity.” American Political Science Review 109 (1): 1–17.
Lee, Frances E. 2009. Beyond Ideology: Politics, Principles, and Partisanship in the U.S. Senate. Chicago, IL: University of Chicago Press.
Levitsky, Steven, and Daniel Ziblatt. 2018. How Democracies Die. New York, NY: Crown.
Levitt, Justin. 2007. “The Truth About Voter Fraud.” New York, NY: Brennan Center for Justice. Available at http://www.brennancenter.org/sites/default/files/legacy/The Truth About Voter Fraud.pdf.
Mason, Liliana. 2018. Uncivil Agreement: How Politics Became Our Identity. Chicago: University of Chicago Press.
McConnell, Christopher, Yotam Margalit, Neil Malhotra, and Matthew Levendusky. 2018. “The Economic Consequences of Partisanship in a Polarized Era.” American Journal of Political Science 62 (1): 5–18.
Minnite, Lorraine C. 2010. The Myth of Voter Fraud. Ithaca, NY: Cornell University Press.
Norris, Pippa. 2017. “Is Western Democracy Backsliding? Diagnosing the Risks.” Journal of Democracy. Downloaded November 9, 2018 from https://www.journalofdemocracy.org/online-exchange-“democratic-deconsolidation”.
Petrocik, John Richard. 2009. “Measuring Party Support: Leaners Are Not Independents.” Electoral Studies 28 (4): 562–572.
Pew Research Center. 2017. “The Partisan Divide on Political Values Grows Even Wider.” Trust, Facts, and Democracy. Pew Research Center. http://www.people-press.org/2017/10/05/the-partisan-divide-on-political-values-grows-even-wider/.
Pew Research Center. 2018. “The Public, the Political System and American Democracy.” Trust, Facts, and Democracy. http://www.people-press.org/2018/04/26/the-public-the-political-system-and-american-democracy/.
Reflective Democracy Campaign. 2018. “A Rising Tide? The Changing Demographics on Our Ballots.” Report prepared by the Reflective Democracy Campaign, available at: https://wholeads.us/wp-content/uploads/2018/10/2018-Rising-Tide-Report-.pdf.
Sargent, Greg. 2018. An Uncivil War: Taking Back Our Democracy in an Age of Trumpian Disinformation and Thunderdome Politics. New York, NY: HarperCollins Publishers.
Svolik, Milan W. 2018. “When Polarization Trumps Civic Virtue: Partisan Conflict and the Subversion of Democracy by Incumbents.” Working paper, available at: https://pdfs.semanticscholar.org/4d2c/50628b3333c52e6f0c7488cae125a996b3f3.pdf.
United States Census Bureau. 2017. “U.S. Census Bureau QuickFacts: United States.” U.S. Census Bureau QuickFacts. https://www.census.gov/quickfacts/fact/table/US/PST045217.
Valentino, Nicholas A., and Fabian G. Neuner. 2017. “Why the Sky Didn’t Fall: Mobilizing Anger in Reaction to Voter ID Laws.” Political Psychology 38 (2): 331–50.
Voeten, Erik. 2017. “Are People Really Turning Away from Democracy?” Journal of Democracy. Downloaded November 9, 2018 from https://www.journalofdemocracy.org/online-exchange-“democratic-deconsolidation”.
White, Ariel R., Noah L. Nathan, and Julie K. Faller. 2015. “What Do I Need to Vote? Bureaucratic Discretion and Discrimination by Local Election Officials.” American Political Science Review 109 (1): 129–142.
Wike, Richard, and Janell Fetterolf. 2018. “Liberal Democracy’s Crisis of Confidence.” Journal of Democracy 29 (4): 136–150.
Word, David L, Charles D. Coleman, Robert Nunziata, and Robert Kominski. 2018. “Demographic Aspects of Surnames from Census 2000.” Technical Report for the U.S. Census Bureau. Downloaded November 9, 2018 from https://www2.census.gov/topics/genealogy/2000surnames/surnames.pdf.