Tempered expectations and hardened divisions a year into the Biden presidency
Bright Line Watch November 2021 surveys
Joe Biden entered the presidency in January aiming to strengthen American democracy by delivering popular policies and reducing partisan enmity. A year later, he convened a democracy summit to address the challenges that rising authoritarianism poses around the world. Here at home, however, the promise of unity has faded and our democratic vulnerabilities remain.
In this report, we describe the findings from parallel surveys we conducted November 5–19, 2021 among political science experts and the public to gauge the status of our democracy and the prospects for reforms that might improve it.
Our key findings are:
-
Partisan divisions over the legitimacy of the 2020 election remain profound. Confidence in the 2022 elections is already more polarized than confidence in the 2020 election was in October of that year.
-
Democrats underestimate the commitment of Republican supporters to democratic norms and principles, and Republicans underestimate the commitment of Democrats. Correcting these misperceptions only modestly decreases support for illiberal actions intended to sabotage or undermine the other party.
-
Support for political violence has been overstated in prior surveys due to respondent inattention and questions that required respondents to select a single option disavowing violence. We correct for these issues and find reduced support for violence. Still, millions of Americans explicitly endorse political violence directed against the other party.
-
Experts and the public believe that fundamental changes are needed to make American government work for current times and that what’s most needed are policy and rule changes that don’t require constitutional amendments.
-
Experts strongly prefer that Senate seats be apportioned to states by population rather than equally. This preference is shared by Democrats but opposed by Republicans and Independents. Overall, the public prefers the status quo.
-
Experts are relatively evenly divided about which of numerous problems facing American democracy is most severe, though they rank economic inequality, unrepresentative political institutions, and racial inequality highest on average.
-
A number of reforms to campaign and legislative rules and practices attract widespread expert support as beneficial to democracy. With few exceptions, however, experts think they are quite unlikely to be enacted.
-
Expert and public perceptions of the performance of U.S. democracy have changed little since June 2021.
Confidence in the 2020 and 2022 elections
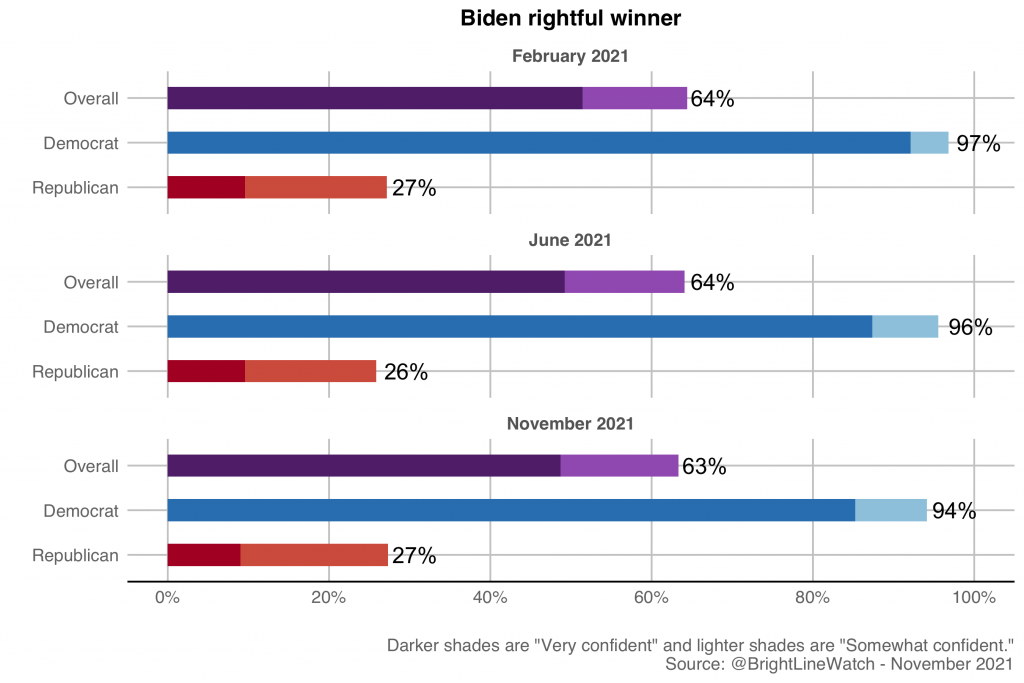
We begin by examining public attitudes on a topic that has remained central to American political discourse since 2020: confidence in elections. In our November 2021 survey, we repeated a question we had asked previously, asking respondents whether or not they thought Joe Biden was the rightful winner of the presidential election in November 2020. As the figure below indicates, just 63% of Americans said Biden was definitely or probably the rightful winner — an estimate that is statistically indistinguishable from the 64% we found in our surveys in February and June 2021. Moreover, we continue to see a vast discrepancy between the parties. 94% of Democrats say Biden is the rightful winner compared to just 26% of Republicans — a split that has also remained remarkably stable since Biden took office. Despite the continued lack of evidence to support Donald Trump’s false claims of widespread fraud in the 2020 election, the public has not become more accepting of the validity of Biden’s victory over time.
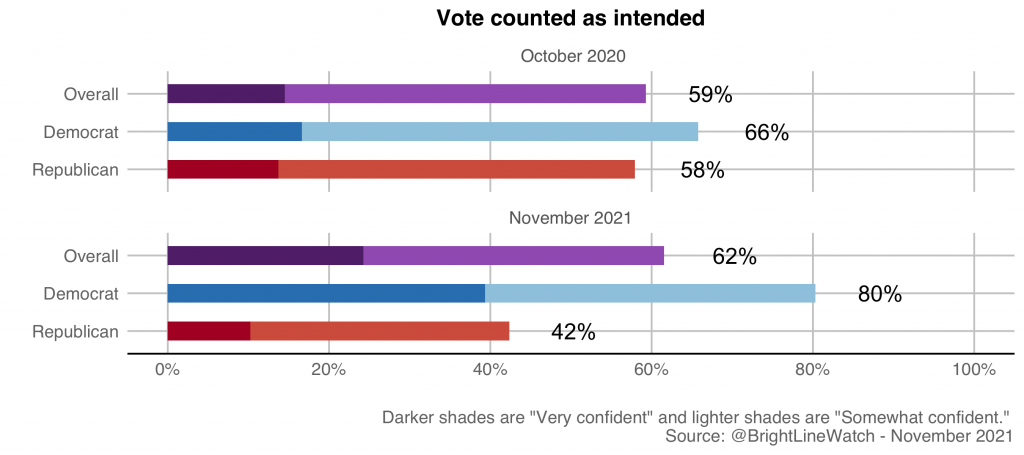
Attacks on the prior election result may be affecting confidence in next year’s midterm election. Only 62% of Americans said they were very or somewhat confident that votes nationwide will be counted as voters intend in the November 2022 election. This is slightly higher than the 59% who expressed confidence in October 2020, weeks before last year’s election, but divisions along partisan lines have deepened. Even though Donald Trump was already frequently making false claims of widespread fraud back in 2020, our data showed similar levels of confidence between Democrats (66%) and Republicans (58%). By now, however, a partisan gulf has opened, with 80% of Democrats expressing confidence compared to only 42% of Republicans.
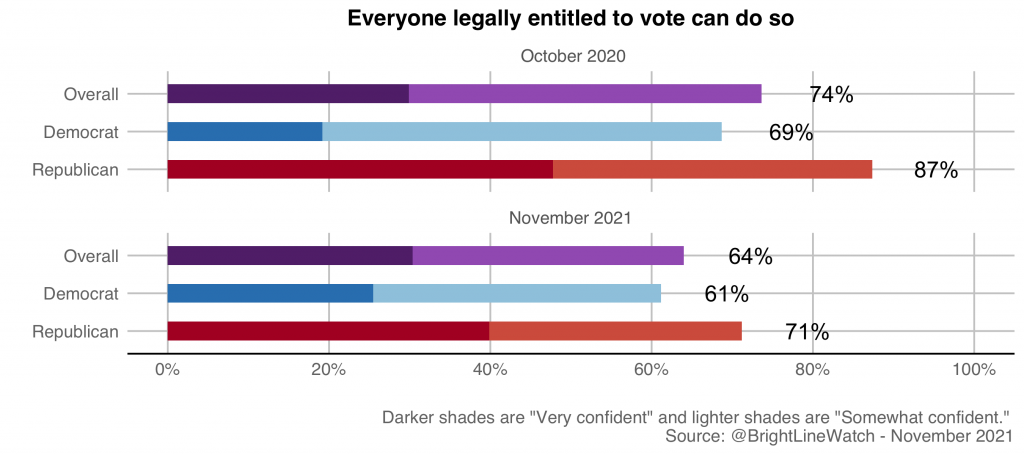
We observe a different pattern with regard to voter access. Overall confidence that all legally entitled voters will have access to the ballot has declined from a year ago, from 74% to 64%, while the partisan gap on this issue has narrowed slightly. In the run-up to the 2020 election, confidence in voter access was 18 percentage points higher among Republicans than Democrats (87% to 69%). The gap is now 10 percentage points, with 71% of Republicans (whose party has taken the lead in passing a wave of state-level restrictions) and 61% of Democrats (whose party has opposed these restrictions) confident that all eligible voters will be able to successfully cast a ballot in the November 2022 election for the U.S. Congress.
Experiment: Out-partisan views and support for anti-democratic practices
Despite the current partisan divide in confidence in the election system, Americans may overestimate the proportion of their partisan opponents who reject democracy itself. How deep are these misperceptions and do they contribute to support for anti-democratic practices? If so, what can we do about it?
Scholars have noted that partisans — Democrats and Republicans alike — tend to overestimate the extremism of their political adversaries and that such overestimation is associated with willingness to take, or support, extreme action oneself. For example, recent studies show that partisans who underestimate their opponents’ support for democratic principles are more likely to support anti-democratic practices and violations of democratic norms. Similarly, partisans who overestimate rival partisans’ support for violence report greater willingness to engage in violence. Correspondingly, experimental interventions to correct these sorts of misperceptions about partisan opponents can reduce expressed support for norm violations and violence.
With these findings in mind, we sought to assess public support for practices that run contrary to a broad conception of the public interest and can reasonably be described as anti-democratic. We also sought to determine whether providing survey participants with accurate information about their partisan opponents would mitigate support for anti-democratic practices.
Our design is modeled on research by Michael H. Pasek, Lee-Or Ankori-Karlinsky, Alex Levy-Vene, and Samantha L. Moore-Berg. First, a randomized subset of our participants engaged in an exercise to determine, and to correct, cross-party misperception. We asked them to estimate what percentage of their co-partisans and members of the other party would say that each of the following principles is important or essential to democratic government:1
- Government agencies are not used to monitor, attack, or punish political opponents
- Elections are conducted, ballots counted, and winners determined without pervasive fraud or manipulation
- Law enforcement investigations of public officials or their associates are free from political influence or interference
- All adult citizens enjoy the same legal and political rights
These respondents were then provided with feedback contrasting their own estimates of out-partisan 2 commitments to democratic principles with actual data from a Bright Line Watch survey earlier this year in the following format:
You guessed that XX% of [out-partisans] say the following principle is important or essential to democratic government. Actually, our most recent survey found that YY% of [out-partisans] say this principle is important or essential to democratic government.
As prior research suggested, respondents frequently underestimated the commitments of out-partisans to democratic principles. In total, 65% of respondents in the treatment group were informed that they had underestimated the democratic commitments of their partisan adversaries on all four items. The figure below contrasts the perceived democratic commitments of Democrats and Republicans offered by co-partisans (round markers) and out-partisans (triangles) with the true values (squares). Blue points represent estimates offered about Democrats; red points represent estimates offered about Republicans.
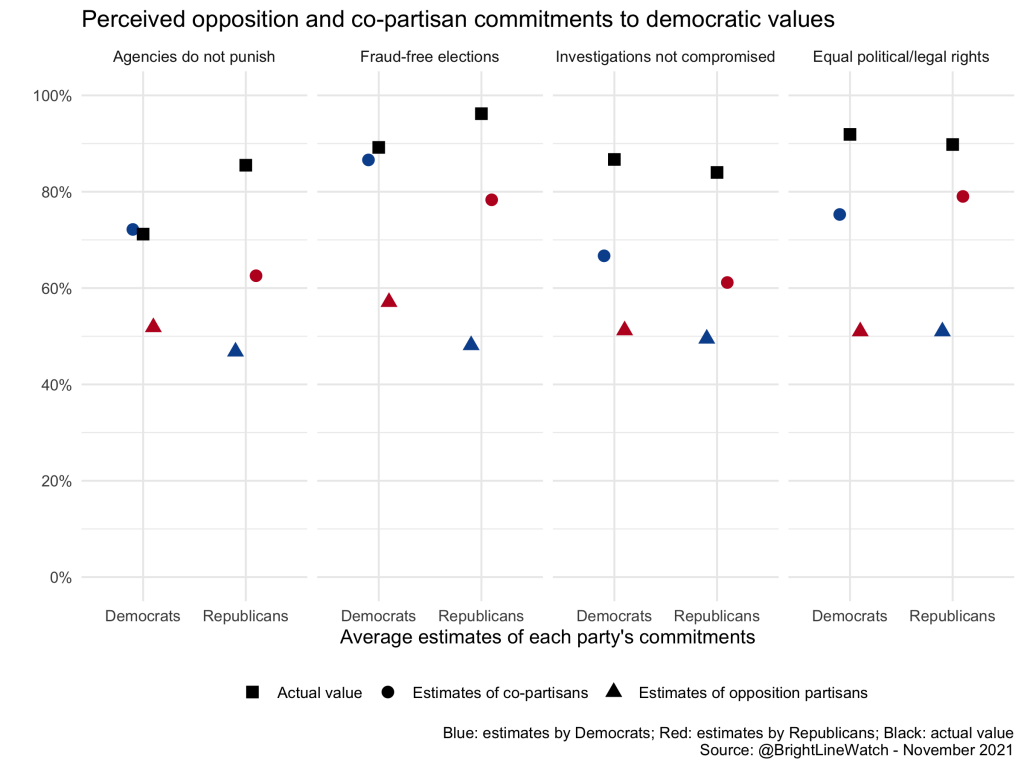
Participants from both parties underestimate the democratic commitments of people from both parties but these errors are especially great for partisan opponents. Across items, respondents underestimated the share of people who supported the importance of democratic principles by 13 percentage points on average for co-partisans and by 36 percentage points on average for opposition partisans. For instance, 92% of Democrats said it was important that all adult citizens enjoy the same legal and political rights, but Democrats estimated that only 75% of Democrats would say so on average and Republicans estimated that only 51% would say so.
After these participants had been presented with accurate information about support for democratic values, all were asked about their support for practices that undermine the public good and could damage democracy. Specifically, we asked they agree or disagree that their co-partisans should take the following set of actions (from research by Pasek et al.):
- should do everything they can to hurt the [other party], even if it is at the short-term expense of the country;
- should do everything in their power within the law to make it as difficult as possible for [the other party] to run the government effectively;
- should redraw districts to maximize their potential to win more seats in federal elections, even if it may be technically illegal;
- should use the Federal Communications Commission to heavily restrict or shut down Fox News [shown to Democrats] / MSNBC [shown to Republicans] to stop the spread of fake news
- it’s OK to sacrifice US economic prosperity in the short-term in order to hurt [the other party’s] chances in future elections.
The figure below shows the percentage of control group respondents that agreed with each statement. We restrict these estimates to respondents whose prior answers indicate that they were reading questions carefully. (Our process for identifying such respondents is described below. As we show there, our estimates of support for illiberal or anti-democratic behaviors are otherwise inflated by careless responses from inattentive respondents.)
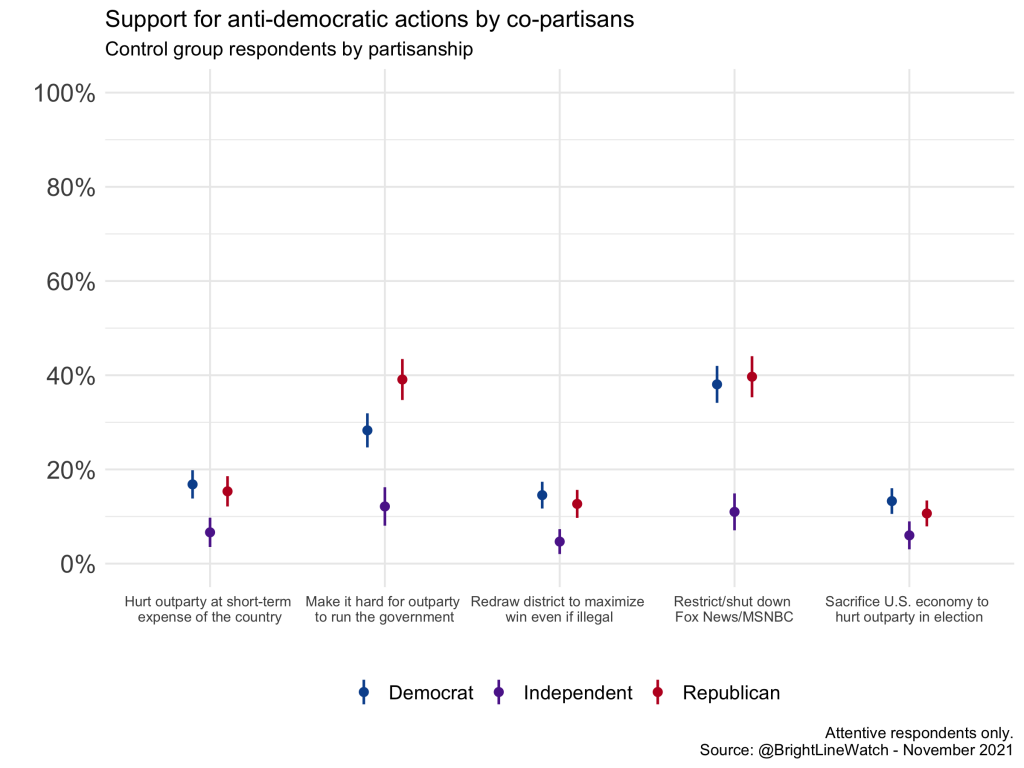
First, support for co-partisans taking illiberal actions was discouragingly widespread, indicating once again that the normative commitments described in the experimental treatment are not always upheld in practice. Of those who did not receive the intervention, 38% of Democrats and 40% of Republicans favor FCC action against disfavored news media networks. Similarly, 28% of Democrats and 39% of Republicans in the control group support doing everything possible to prevent the other party from governing effectively. Lower, but still substantial, shares of control group respondents favor hurting the out-party at the short-term expense of the country (17% of Democrats, 15% of Republicans), pushing the legal limit on partisan gerrymandering efforts (15% of Democrats, 13% of Republicans), or damaging the economy to enhance electoral prospects (13% of Democrats, 11% of Republicans). In general, support for these actions was similar across parties with the exception of whether their party should do everything possible to prevent the other party from governing effectively, which we would expect to be more appealing to Republicans with their party out of power in Washington.
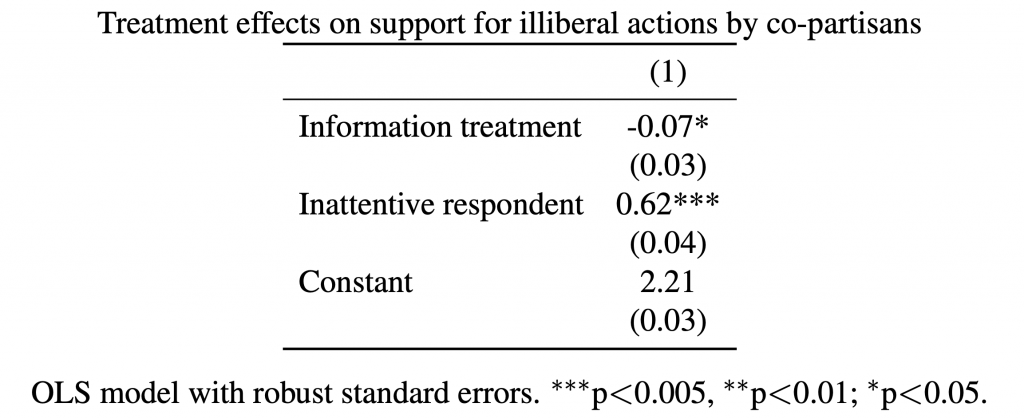
We now turn to assessing the effect of the experimental treatment on the full sample, which we report below on the five-point agree-disagree scale provided to respondents.
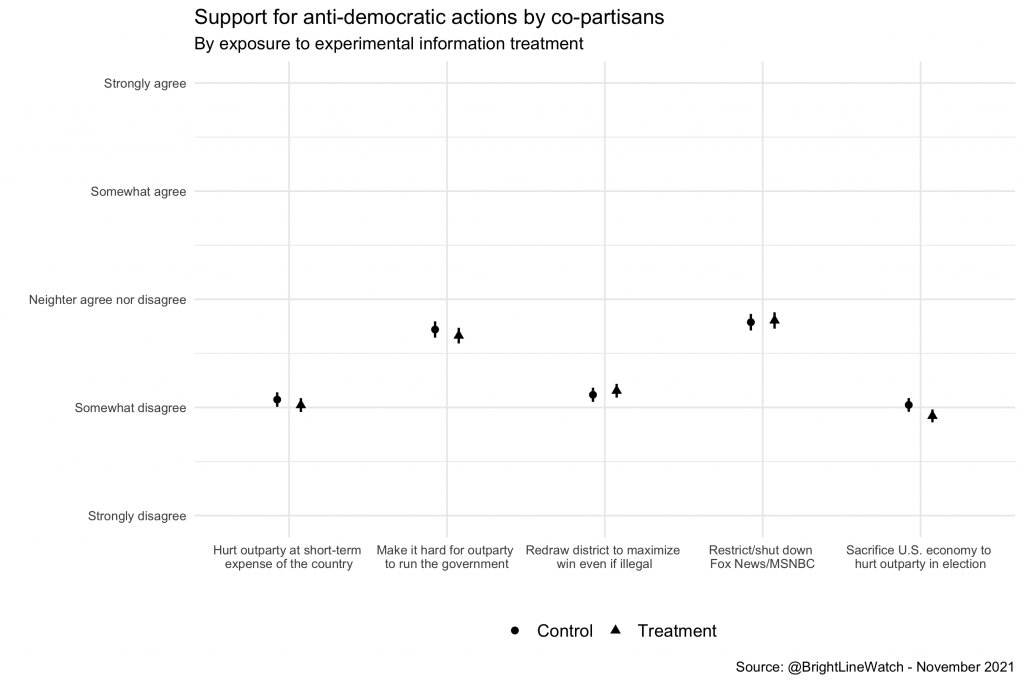
Across the full battery of anti-democratic actions, the effect of the experimental treatment was statistically significant and in the expected direction, but substantively small (just 0.08 standard deviations). Providing accurate information about support for democracy among partisan adversaries reduced support for illiberal actions by co-partisans by 0.07 points on a five-point agree-disagree scale. (Full results are shown in the appendix.) We specifically observed significant, but small, reductions in support for actions intended to damage the other party (hurt the other party at the expense of the country, make it hard for them to govern, and sacrifice economic prosperity to damage them). By contrast, the intervention had no measurable effect on actions against unfavorable media sources or gerrymandering.
These results suggest that underscoring the opposition party’s shared commitment to respecting democratic norms might help strengthen opposition to illiberal actions by co-partisans, but any such effects would be quite limited in magnitude.
Experiment: Measuring support for political violence
Concerns about American democracy extend beyond illiberal actions taken by political elites to support threats, harassment, and even violence. How many Americans condone aggressive or violent acts committed by their political brethren? The issue attracted substantial attention in the wake of anti-racism demonstrations and counter-demonstrations across the country in summer 2020 and especially after the January 6, 2021 riot at the U.S. Capitol.
More recently, in November 2021, the House of Representatives censured Representative Paul Gosar (R‑AZ) after he tweeted a video animation depicting him killing Representative Alexandria Ocasio-Cortez (D‑NY) — but only two of Gosar’s Republican colleagues supported the censure while 207 voted against it. How pervasive are such attitudes among the public at large?
A question battery initially developed by the political scientists Nathan Kalmoe and Liliana Mason and replicated by other researchers (including Bright Line Watch) appears to show alarmingly high levels of support for aggressive and violent actions toward opposing partisans. It consists of the following questions:
-
When, if ever, is it OK for [own party — Democrats/Republicans] to send threatening and intimidating messages to [opposing party — Republican/Democrat] leaders? (Never, Occasionally, Frequently, Always)
-
When, if ever, is it OK for an ordinary [own party — Democrat/Republican] in the public to harass an ordinary [opposing party — Democrat, Republican] on the Internet, in a way that makes the target feel frightened? (Never, Occasionally, Frequently, Always)
-
How much do you feel it is justified for [own party — Democrats/Republicans] to use violence in advancing their political goals these days? (Not at all, A little, A moderate amount, A lot, A great deal)
-
What if [opposing party — Democrats/Republicans] win the [2020/2024] presidential election? How much do you feel violence would be justified then? (Not at all, A little, A moderate amount, A lot, A great deal)
In spring 2020, 16% of Kalmoe and Mason’s respondents said their own party using violence to advance its political goals would be at least a little justified, a figure that increased to 21% if the other party won the presidential election that year. According to data they provided to us from research they conducted for their forthcoming book, Kalmoe and Mason find slightly higher levels of potential support for violence in more recent surveys. Most recently, they found that 17–26% of respondents did not wholly reject threats, harassment, and violence in a June 2021 survey. In particular, the proportion of Americans who do not wholly reject violence was 24% for Republicans and 19% for Democrats in general and 28% and 25%, respectively, if their party were to lose the next presidential election. Bright Line Watch similarly found in October 2020 that 26% of Trump approvers and 21% of disapprovers were willing to condone violence in response to the other side winning the presidential election.
The political scientists Sean Westwood (a colleague of BLW’s John Carey and Brendan Nyhan), Justin Grimmer, Matthew Tyler, and Clayton Nall contend that top-line results from the original Kalmoe/Mason scale overestimate support for violence because they lack precise definitions and offer response options that inflate reported support for violence among inattentive respondents.
Kalmoe and Mason report that their forthcoming book presents additional analyses using different question formats and follow-up questions which also find more moderate willingness to support violence. In this report, however, we focus on the top-line figures, which have attracted substantial attention and raised alarm. Our goal is to provide the most accurate estimate of support for threats, harassment, and violence. We investigated three ways in which the original question scale could lead to overestimation of support for aggressive actions per Westwood and his coauthors:
-
Response options: Response scales in surveys often span the full range of possible responses. For instance, a question measuring presidential approval on a scale ranging from strong disapproval to strong approval. But among the four or five choices provided by the original Kalmoe/Mason response scale, only one signals full rejection; the rest indicate acceptance of at least some aggressive actions. As Westwood et al. note, this design might inflate the proportion of respondents who appear to endorse violence, threats, and harassment.
In our survey, half of respondents were presented with the original Kalmoe/Mason response options and half were instead asked two questions in a branching design. We first asked “Is it ever OK/justified to [action]?” with just two options, Yes or No. Respondents who said “Yes” received a follow-up question with response options that followed those provided in the original Kalmoe/Mason questions. (We classified an answer of “Never” “Not at all” as equivalent to answering “No” to the first question.)
In presenting our results below, we follow Kalmoe and Mason’s practice of distinguishing the percentage of respondents who fully reject aggressive actions or violence altogether from those who express any support for such actions.
-
Respondent attentiveness: Online survey respondents vary in the care and attentiveness they give to questions. Westwood et al. show that inattentive respondents might appear to endorse violence when they are instead answering randomly or carelessly. We therefore embedded two items in our survey that were designed to identify inattentive respondents who were not reading questions and responding carefully (see appendix for wording). The 18% of respondents who failed to respond to both questions correctly (e.g., failing to disagree with the statement that Barack Obama was the first U.S. president) were classified as inattentive.
-
Differing interpretations of “violence”: Two of the original scale questions refer to violence without specifying what that entails. Per Westwood et al., respondents endorsing “violence” might have actions ranging from destruction of property to assault to assassination in mind.
We probed three ways in which the way violence or other aggressive actions are described might affect public support. First, we created three versions of the question asking “How much do you feel it is justified for [own party] to use violence in advancing their political goals these days?” that explicitly differentiate between non-violent misdemeanors, non-violent felonies, and violent felonies:
-
“How much do you feel it is justified for [own party] to commit non-violent misdemeanors in advancing their political goals these days?”
-
“How much do you feel it is justified for [own party] to commit non-violent felonies in advancing their political goals these days?”
-
“How much do you feel it is justified for [own party] to commit violent felonies in advancing their political goals these days?”
Because these questions do not indicate which crimes are being committed, we also tested alternate versions that not only use the branching formats described above but spell out specific examples of each crime or explicitly define violence as using physical force to harm someone. For instance, the reference to “violent felonies” in the question above is changed to instead state “violent felonies (for example, assault during a confrontation with counter-protestors).” Similarly, we tested a modified version of the question about a presidential election victory by the other party in 2024 that not only uses a branching format but explicitly defines violence as “the use of physical force to harm someone.”
We also sought to measure support for violence in less general and hypothetical terms by testing two new questions — one based on the Kalmoe/Mason framework and one created by Robert Pape and his colleagues — that measure support for violence to “prevent Congress from certifying Electoral College votes on January 6” and to “restore Donald Trump to the presidency.” Two versions of each were tested using the same approach described above — one with a single response option and one with a branching scale and a definition for violence (“the use of physical force to harm someone”) added to the January 6 item.
In total, we thus tested eight question items — the threats and harassment questions; questions measuring support for non-violent misdemeanors, non-violent felonies, and violent felonies; a question measuring support for violence if the other party wins the election; and questions measuring support for violence on January 6 and violence to restore Trump to the presidency.
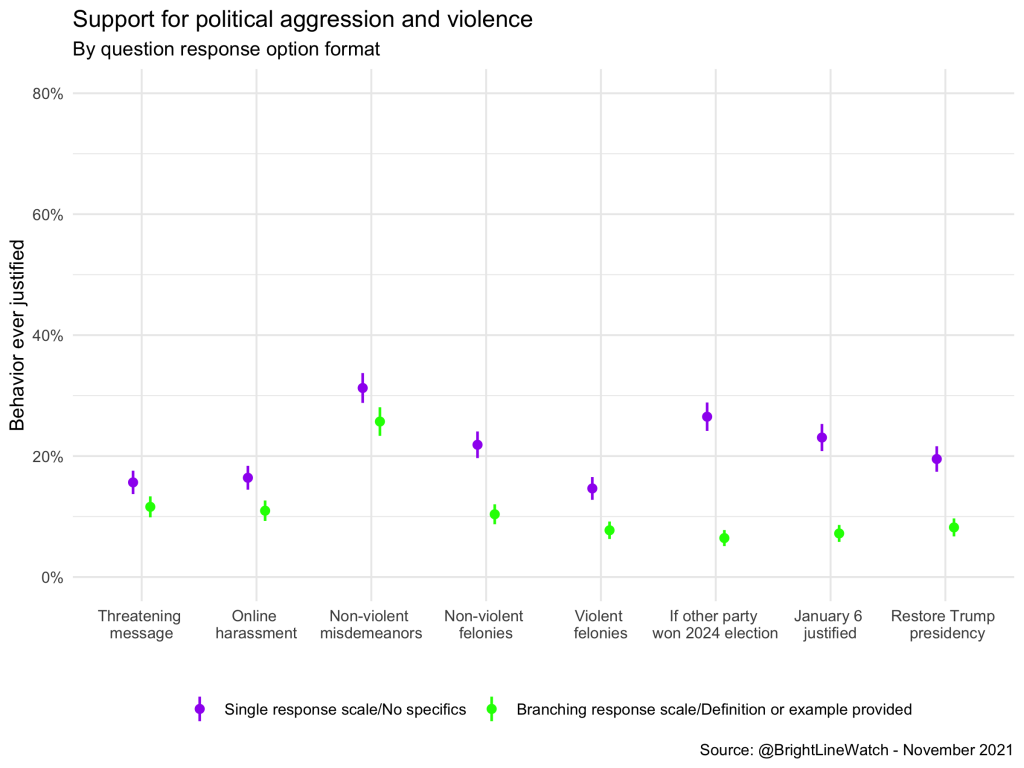
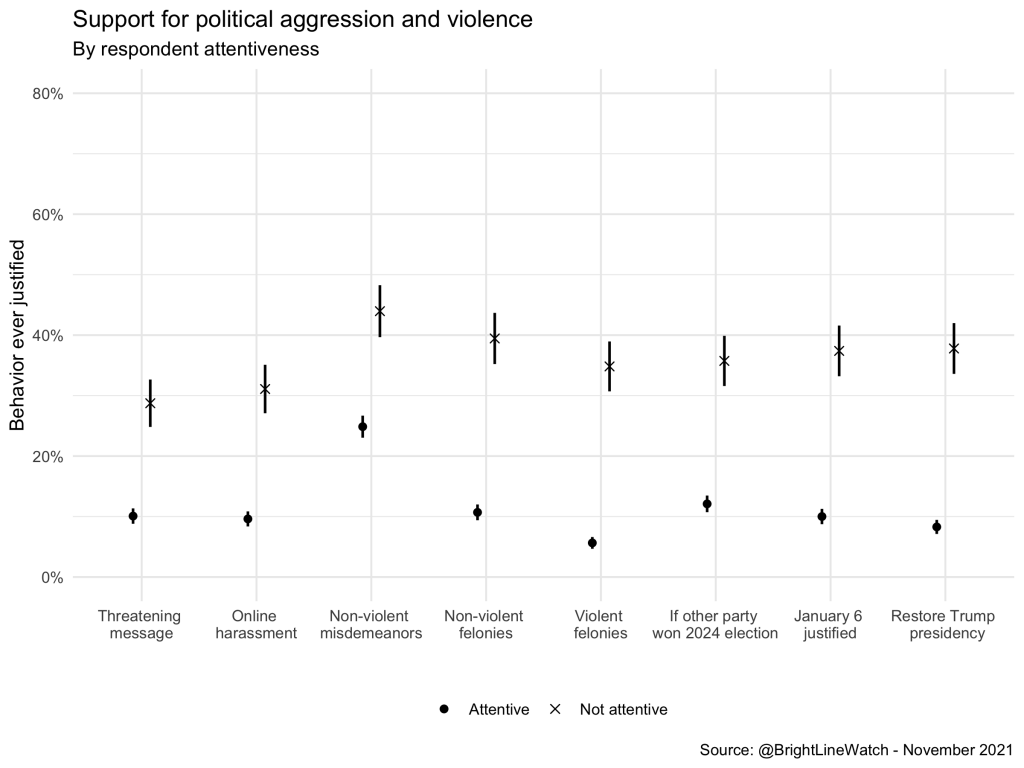
In the figure below, we separately report the proportion of attentive and inattentive respondents who think threats, harassment, crimes, or violence can sometimes be justified among two groups:
-
Respondents who were provided the original response scale and descriptions of actions that omit examples and definitions
-
Respondents provided a branching response scale along with an example or definition
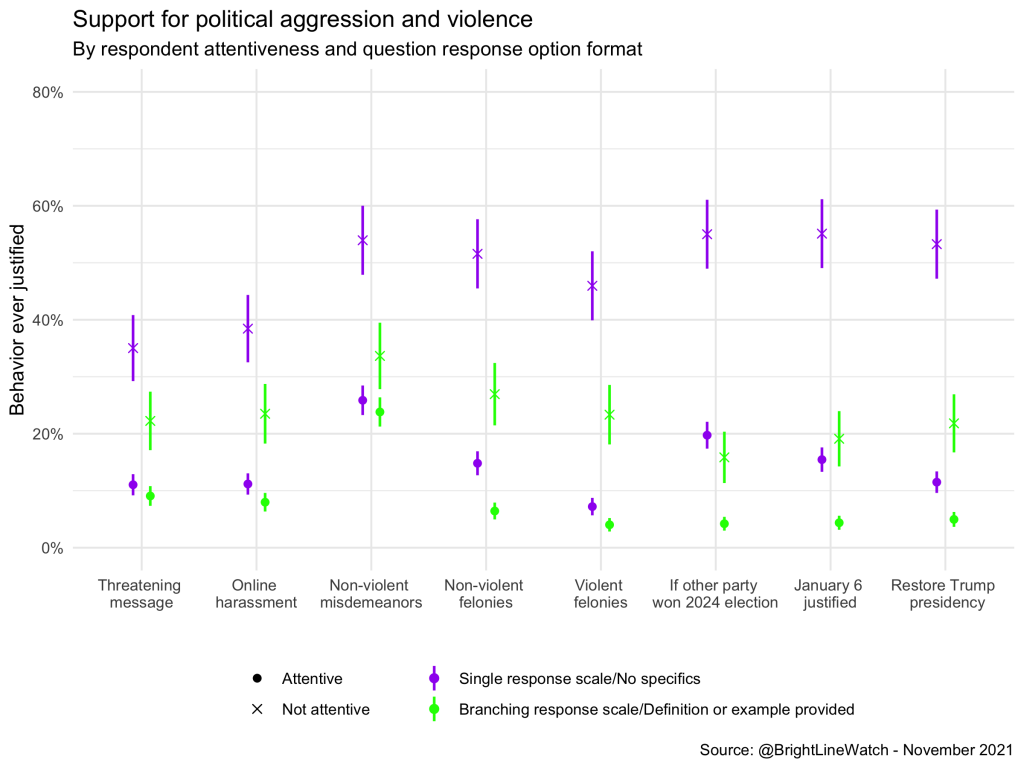
We report three findings. First, fewer Americans endorse these actions when branching and specific terminology is provided. This pattern is consistent for each item, including threats and online harassment, where the only difference between groups is the set of response options (on those, we use identical wording to Kalmoe and Mason’s original scale). Second, frequency of seeming endorsement of political threats, harassment, lawbreaking, and violence is much higher among inattentive respondents across items. However, the pattern of greater endorsements among inattentive respondents (who represent 19% of the sample) is greatly reduced among those who received the branching response options and specific examples or definitions.
These findings indicate that the interaction between inattention and a single response scale inflates estimates of support for threats, harassment, and violence (a problem that may affect many online surveys in which we are especially interested in responses that deviate from one end of a response scale). In contrast, our best estimates of public support for political violence, threats, and harassment are substantially lower than past research found. When we exclude inattentive respondents, first ask attentive respondents a binary question, and provide them with a specific definition or example where appropriate, reported support is 9% for threats, 8% for harassment, 6% for non-violent felonies, 4% for violent felonies, 4% for violence if the other party wins the 2024 election, 4% for violence on January 6, and 5% for violence to restore Trump to the presidency. These figures are much lower than we estimated using the original scale in October 2020.3
These findings are in some ways reassuring, but it is important to note that they do not mean the risk of political violence is minimal. Unfortunately, even small numbers of people who encourage or engage in violence can have dangerous and destabilizing effects on our political system. To date, for instance, 719 people have been charged in the January 6 insurrection, which represents less than 0.001% of the people who voted for Donald Trump in 2020.
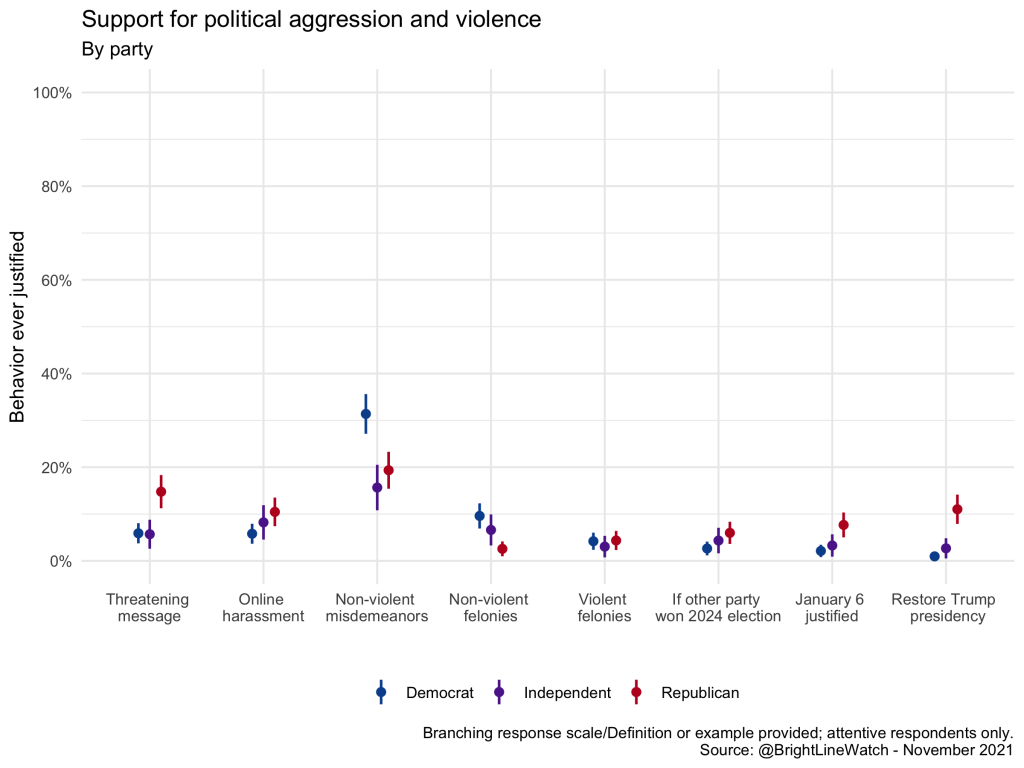
Given the events that took place January 6, it is especially important to consider how support for political aggression and violence varies by party. We further disaggregate the data by strength of respondent partisanship given the influence of the party bases on the actions of politicians. The figure below thus reports separate estimates for Democrats and Republicans who identify strongly with their party and those who don’t. (These data represent estimates from the attentive subsample who answered branching questions that provided examples or definitions where appropriate and thus provides conservative estimates of support for violence.)
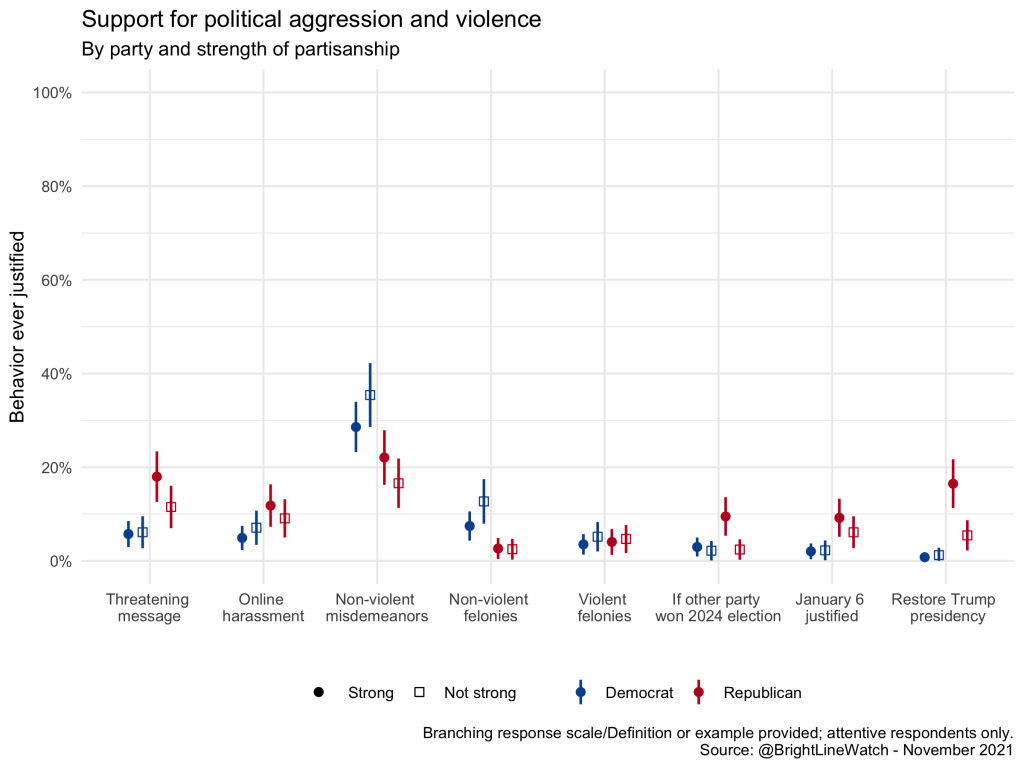
As the figure shows, the parties differ notably on several dimensions. Democrats show higher support for non-violent misdemeanors and non-violent felonies than Republicans, especially among those who do not identify strongly with their party. In total, 35% and 13% of Democrats who do not identify strongly with their party support non-violent misdemeanors and non-violent felonies, respectively, compared to 29% and 7% of those who do identify strongly. By contrast, Republicans support threats, violence if the other party wins the 2024 election, violence on January 6, and violence to restore Trump to the presidency at a higher rate than Democrats. Each of these levels of support is highest among Republicans who identify strongly with their party (18% for threats, 9% for 2024, 9% for January 6 violence, and 17% for violence to restore Trump compared to 12%, 2%, 6%, and 5%, respectively, among those who do not identify strongly).
Fundamental changes to American democracy
Contemporary debate about American democracy includes serious reconsideration of whether and how the structure of our system of government is contributing to potential erosion. Following a 2018 Pew poll, we asked both the public and experts whether they think the design and structure of government serves the country well or if significant changes are needed to make it work for current times. We then asked respondents who favored change whether the best approach would be to seek to make changes that don’t require constitutional amendments, seeking to amend the Constitution, or creating a new constitution altogether. The next figure shows results for both expert respondents and the public.
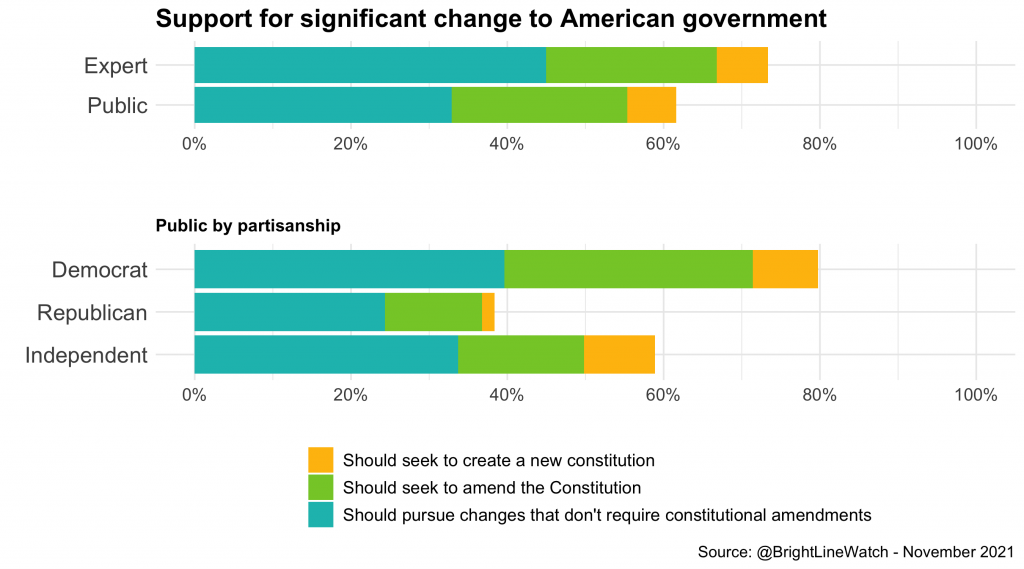
Large majorities of experts (74%) and of the public (62%) favor fundamental change to the structure of American government. Among reform supporters, a majority of experts and the public believe the best approach to making significant change is to pursue reforms that do not require amending the Constitution (45% of all experts, 33% of all members of the public). Relatively few in either group believe the best approach is to seek to amend the Constitution (22% of experts, 23% of the public) or to create a new charter altogether (7% of experts, 6% of the public). Yet, no single approach attracts majority support among either group overall.
Disaggregating our public respondents by partisanship reveals stark polarization. In total, 62% of Republicans oppose change in the fundamental structure of American government, whereas 80% of Democrats support it.. Support is also higher among Democrats than Republicans for pursuing policies that do not require amending the Constitution (40% versus 24%) and for amending the Constitution (32% versus 12%). Few supporters of either party favor pursuing a new constitution, though support is also higher for Democrats (8% versus 2%).
Many observers are particularly concerned about the malapportionment of the U.S. Senate. We thus asked expert and public respondents whether they favor equal representation for all states in the U.S. Senate or a system in which states with more people would have more senators. As the figure below illustrates, experts and the public are divided: 72% of experts, but only 36% of the public, favor Senate representation by population.
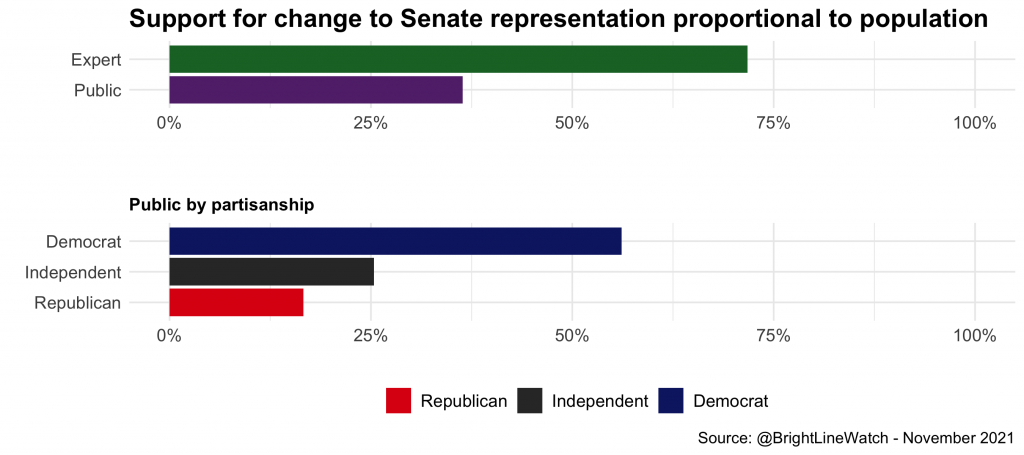
Given the partisan bias of the current Senate map, it is not surprising that 83% of Republicans support keeping two senators per state. However, 75% of independents also prefer to retain the status quo and only a bare majority of Democrats, 56%, favors representation by population.
Prioritization of problems for democracy
To better understand experts’ assessments of what ails American democracy and how those problems might be fixed, we identified the following list of commonly mentioned problems facing American democracy and asked experts to rank their importance:
-
Economic inequality
-
Racial inequality
-
Unrepresentative political institutions
-
Partisan polarization
-
Misinformation and uncivil debate
-
Populism/illiberalism
-
“Wokeness”/identity politics
The figure below shows the distribution of importance rankings for each problem sorted by average rank order.
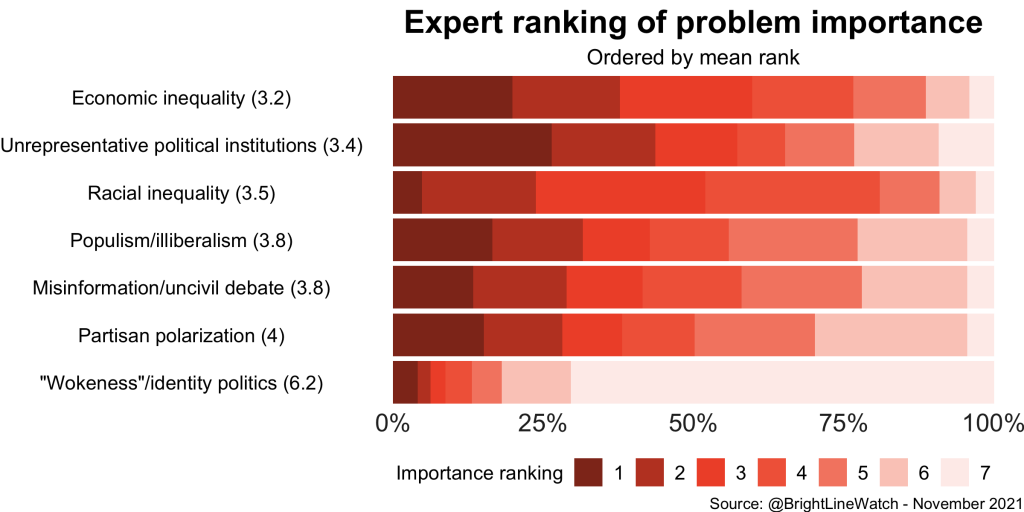
Unrepresentative political institutions was most frequently rated as the most important problem facing American democracy (26%). By average ranking, however, economic inequality rates as most important because more respondents rated it as the second, third, or fourth most important problem. Relatively few experts (5%) rated racial inequality as the most important problem facing American democracy but so many rank it second, third, or fourth that it rates as third most important by average rank.
On the whole, the rankings data reveal little expert consensus on problem importance other than agreement that American democracy faces more pressing threats than “wokeness” and identity politics (ranked first by only 4% and last by 70%). Even factors ranked as relatively less important — populism/illiberalism, misinformation and uncivil debate, and partisan polarization — were ranked as the most important problem by 13–16% of experts, not far from the 26% who rated unrepresentative political institutions first. (Respondents frequently commented that the task was challenging because the problems were closely related.)
Prospects for democratic reform
We also presented experts with nine proposals for political reforms based on prominent debates among politicians, activists, and academics. Consistent with the reform strategy most favored by our expert respondents, none of the identified proposals requires amending the Constitution. These reforms focus overwhelmingly on the representativeness of political institutions, which experts ranked as the second most important problem facing U.S. democracy on average. Though one – public funding for campaigns – aims to reduce the dependence of elected officials on campaign contributions from wealthy donors and thus may address economic inequality in political representation.
We asked expert respondents to rate the expected effect each reform would have on American democracy, if adopted. We then asked respondents to forecast the likelihood, on a 0–100% scale, that each of the nine proposals would be adopted by 2030.
The figure at left below illustrates the results on expected effects, rated on a scale ranging from “extraordinary threat” to “extraordinary benefit.” Short summary descriptions of each reform proposal are provided in the middle of the figure. (The exact wording used in the rating task and forecasting exercise is provided in the appendix.)
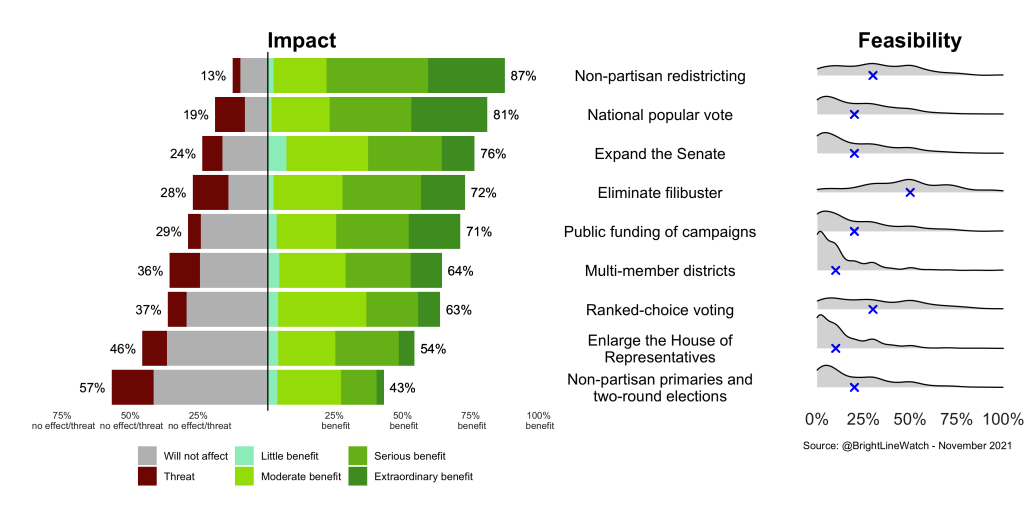
Despite their differences in rating the problems facing American democracy, the experts frequently were in agreement on the benefits of many proposed reforms. More experts saw benefits than threats to democracy for each of the nine proposed reforms. Only one option – non-partisan primaries and two-round elections – was rated as beneficial by less than a majority of expert respondents. On seven of the nine proposals, more than 60% of the experts saw adoption as beneficial to democracy.
Opinion was most favorable toward the adoption of non-partisan redistricting commissions, which 87% of respondents saw as a benefit to democracy and 65% regarded as seriously or extraordinarily beneficial. Only 3% of respondents regarded redistricting reform as a threat to democracy.
Shifting from our current, state-level winner-take-all system for allocating Electoral College votes to a national popular vote for the presidency was nearly as well regarded by experts. Overall, 81% of experts perceive a benefit to democracy from a national popular vote system (58% serious or extraordinary) compared with 11% regarding such a reform as a threat. This support is consistent with recent evidence that Electoral College victories by popular vote losers (as occurred in 2000 and 2016) can damage the legitimacy of the electoral system.
The next two most favored proposals would change the U.S. Senate. The first would grant statehood and thus two senators each to Puerto Rico and the District of Columbia, potentially reducing the current Republican advantage in the chamber. The second would eliminate the filibuster, an extra-constitutional provision that allows a minority of 41 senators to block most legislation. The next three items, all favored by solid majorities, address rules for elections. They include passing “clean election laws” for federal elections creating mechanisms such as public matching donation systems and democracy vouchers, shifting to the use of multi-member districts in House elections, and using ranked-choice ballots in presidential and congressional elections. The last widely supported proposal would expand the House of Representatives to make it and the Electoral College more representative of the nation’s population. A majority (54%) of experts saw this reform as beneficial for democracy. By contrast, only 43% favored the proposal to choose members of Congress through two-round elections in which non-partisan primaries are followed by runoff elections among the “top X” candidates (two, four, five, etc.). Fifty-seven percent of experts either said this system would have no effect (42%) or that it would threaten democracy (15%).
However appealing some of these reforms are to our experts, how likely are they to be adopted? To elicit the experts’ views of the reforms’ chances, we asked them to assess the likelihood that the following changes would take place by the year 2030, on a 0–100% scale:
-
Redistricting commissions are used in 25 or more states (currently used in 10);
-
States representing a majority of Electoral College votes join an interstate compact creating a national popular vote system;
-
The Senate is expanded via the addition of Puerto Rico and Washington, DC as states;
-
The Senate filibuster is eliminated for all legislation;
-
Public funding for congressional campaigns is available in three or more states (currently zero);
-
Multi-member districts are used in three or more states (currently zero);
-
Ranked-choice voting is used in three or more states (currently one);
-
The House of Representatives includes more than 435 members;
-
Non-partisan primaries and two-round elections are used in 10 or more states (currently five).
The figure at right above shows the distribution of likelihood estimates across expert respondents, with the median estimate marked by an X. Two of the four most-favored reforms — the spread of redistricting commissions to half of all states, and the elimination of the Senate filibuster — were rated as the most likely to take place in the next decade, though the median forecasts for these were only 30% and 50%, respectively. Ranked-choice voting, which is currently used at the state level only in Maine but has come into wider use at the municipal level, is also rated as having a 30% median chance of adoption in three or more states by 2030. Experts were even more skeptical about the likelihood of adoption of the remaining of the reform proposals. The median forecast for the other six reform proposals was 20% (national popular vote, Senate expansion, public funding of campaigns, non-partisan primaries and two-round elections) or 10% (multi-member districts, enlarging the House of Representatives).
Events
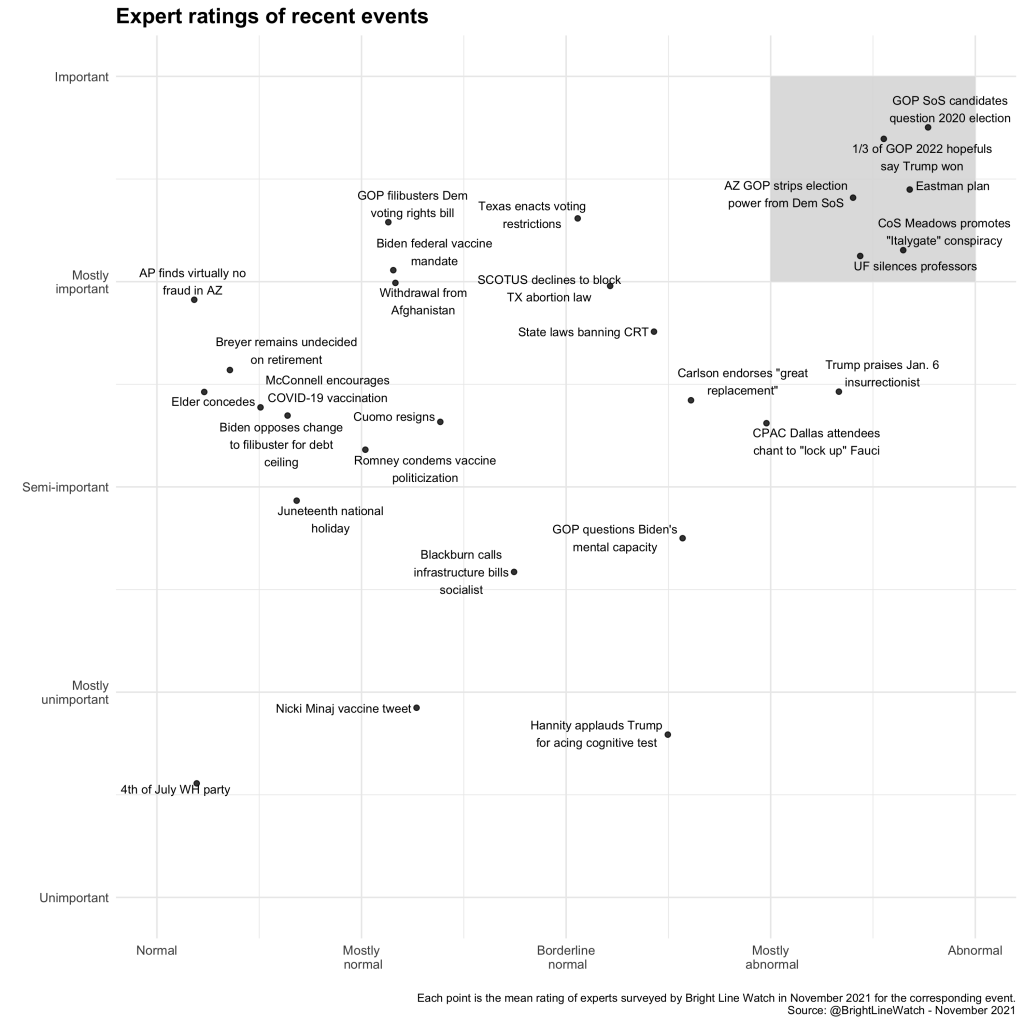
We continue to survey experts about the normality and importance of events that have taken place in recent months. The ratings they provided are plotted on the figure below. It identifies a number of events that experts rate as relatively normal and important (e.g., the US withdrawal from Afghanistan), normal and unimportant (e.g., the Fourth of July party at the White House), events rated as relatively abnormal but unimportant (e.g., Sean Hannity praising Donald Trump for passing a cognitive test), and a number of events rated as both abnormal and important (e.g., Fox host Tucker Carlson endorsing “great replacement” theory). We are particularly concerned about events in the shaded upper-right quadrant, which experts rated as mostly important to important and mostly abnormal to abnormal on average.
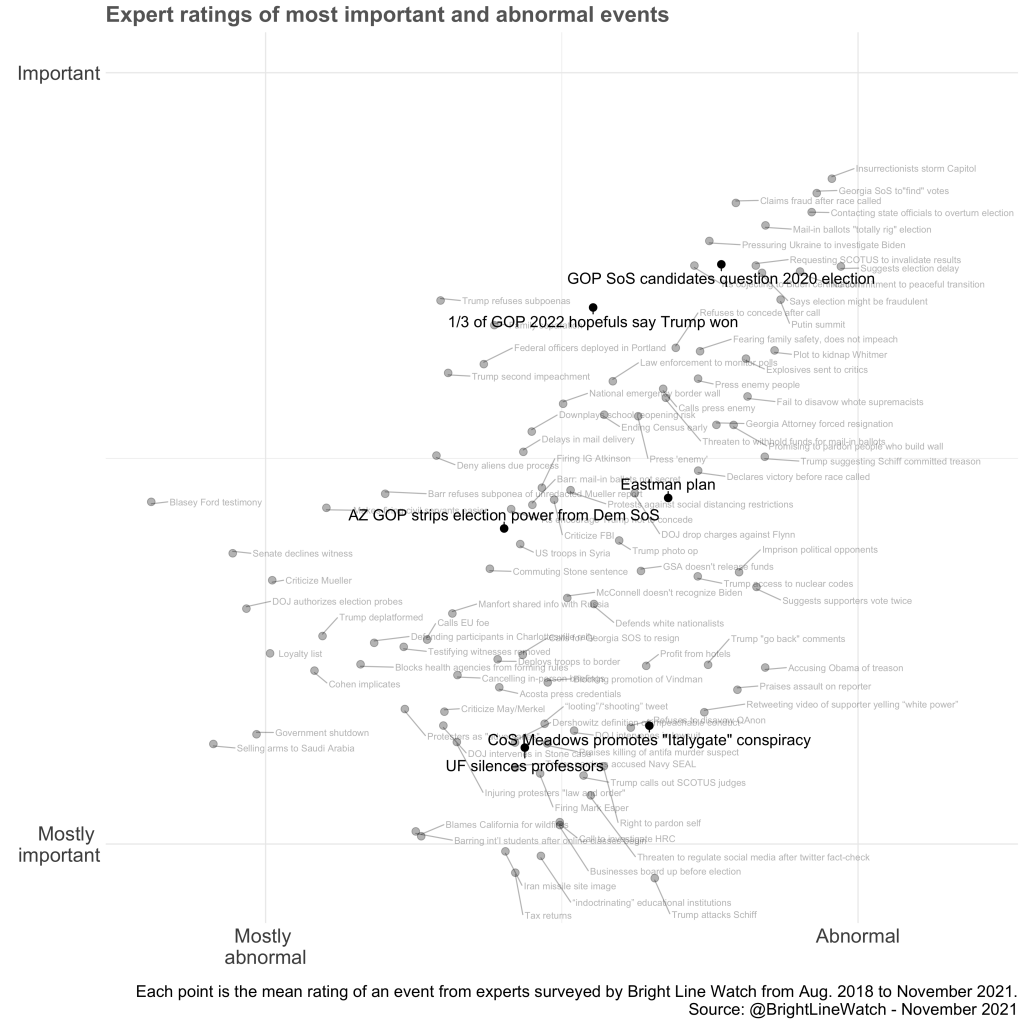
We therefore zoom in on the upper-right quadrant of especially abnormal and important events in the figure below, which juxtaposes expert ratings of events from our most recent survey with those from our past surveys dating back to August 2018. As the figure indicates, six events were rated as highly abnormal and important in this most recent survey, including conservative lawyer John Eastman’s plan to overturn the results of the 2020 presidential election, the University of Florida preventing professors there from testifying in voting rights cases, White House chief of staff Mark Meadows promoting the “Italygate” conspiracy theory about the 2020 election results, and Arizona Republicans in the state legislature stripping powers from the state’s Democratic Secretary of State.
However, experts saw two events as especially noteworthy. Both concern the commitment of the Republican Party to the integrity of the electoral system. First, at least one in three declared GOP candidates for the U.S. House or Senate in 2022 rejects the outcome of the 2020 presidential election. Second, 10 of 15 Republican candidates for Secretary of State in five battleground states question the legitimacy of the 2020 election. These events suggest in turn that the party is increasingly embracing Donald Trump’s efforts to undermine the legitimacy of American elections and that partisans in charge of administering elections could threaten their integrity from within. The embrace of false claims about 2020 by GOP Secretary of State candidates was rated as especially abnormal and important — the first such rating for an event concerning the 2022 and 2024 elections. (Prior events that received comparable ratings concerned Trump’s conduct in office and the effort to overturn the result of the 2020 election.) In total, 97% rated it as mostly abnormal or abnormal, including 82% who rated it as abnormal (the highest value on a five-point scale from normal to abnormal). Similarly, 96% rated it as mostly important or important, including 80% who rated it as important (the highest value on a five-point scale from unimportant to important).
Democratic performance
Finally, as in previous surveys, we asked each expert and public respondent to rate the overall performance of American democracy on a scale from 0 to 100. The figure below reports the average ratings for Democrats and Republicans in the public sample and for experts going back to February 2017.
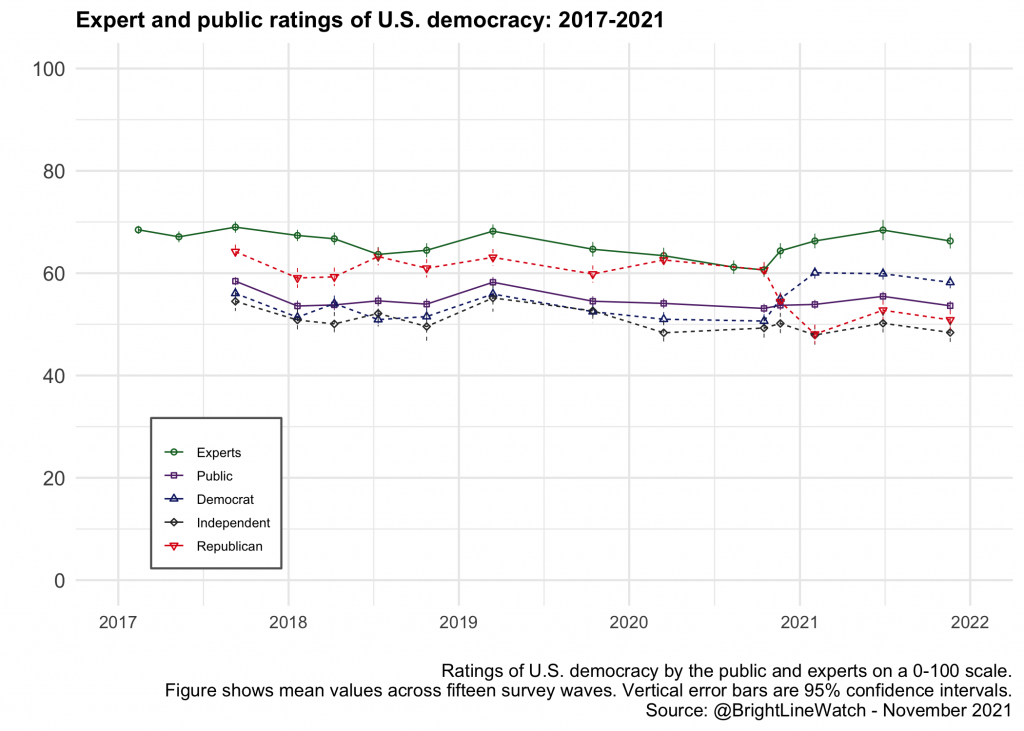
Experts (green) consistently rate American democracy more positively than the public (purple) does, but also broadly regarded Trump’s presidency as a threat to democracy. Democracy ratings among the experts accordingly increased after Trump’s defeat. However, expert optimism appears to have crested at this higher level; mean assessments were statistically unchanged between June (68) and November (66). Similarly, assessments among the public overall (purple) did not change significantly since June overall or for any partisan group. Democrats continue to rate U.S. democracy as performing better than Republicans, the opposite of the pattern seen during the Trump years. Those without a partisan affiliation consistently score American democracy lower than either partisan group.
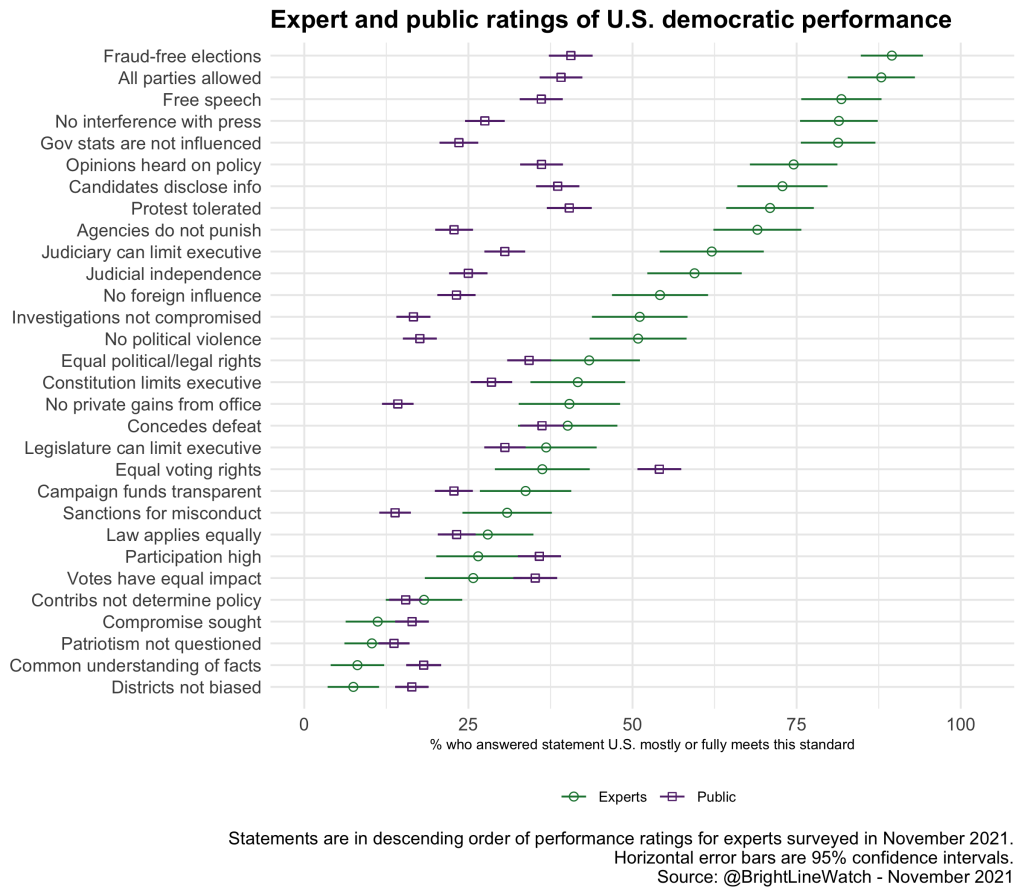
The next figure breaks out performance ratings on each of 30 democratic principles. (Full descriptions of each principle listed in the figure are included in the appendix.) The markers for each principle indicate the percentage of expert (green) and public (purple) respondents who regard the United States as fully or mostly meeting the standard (as opposed to meeting it partly or not at all). Consistent with the overall ratings, the experts rate U.S. democratic performance more positively than the public overall. Few exceptions exist, however, such as voting rights being equally protected for all citizens, politicians operating with a common understanding on factual matters, and electoral districts not systematically favoring one party over the other.
The next figure shows performance assessments on the same 30 principles for the public sample only by respondent partisanship. On some principles, middling overall public assessments hide stark partisan polarization. Three patterns are noteworthy.
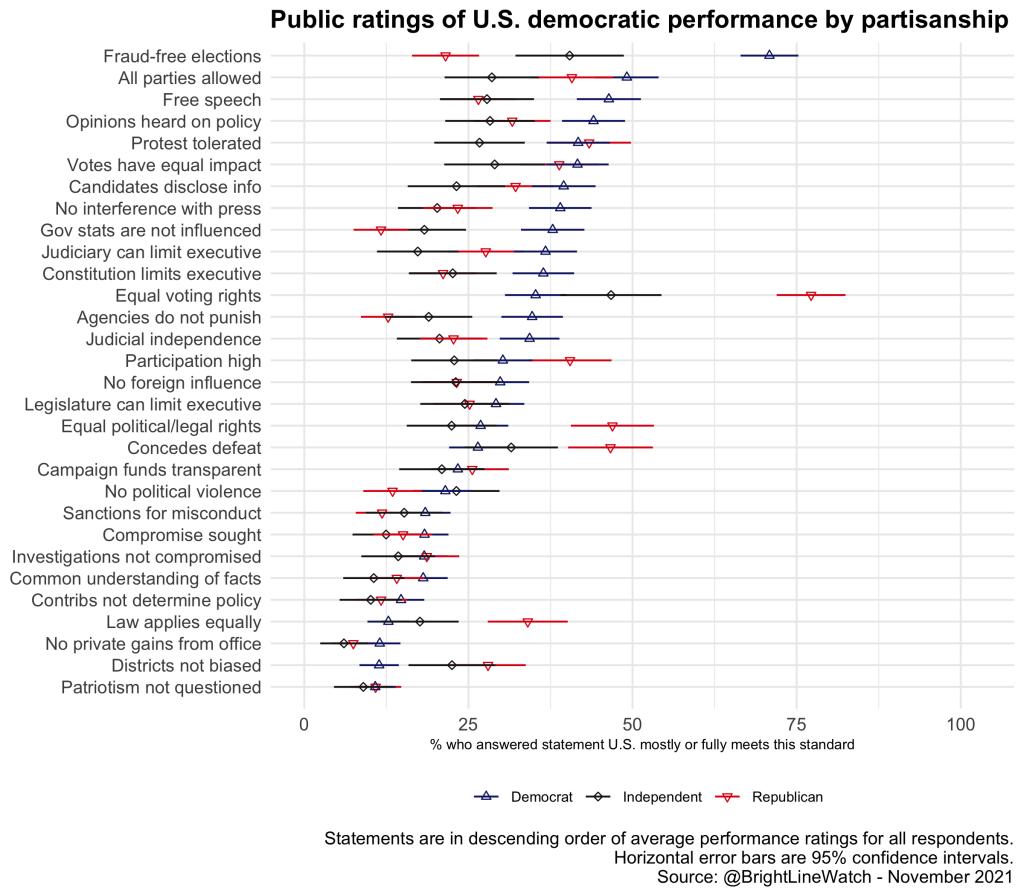
First, Democrats perceive higher levels of inequality among citizens than do Republicans. For example, 77% of Republicans are confident that voting rights are guaranteed equally for all citizens compared with only 35% of Democrats. Similarly, 47% of Republicans, but only 27% of Democrats, believe legal and political rights more generally are equally protected for all citizens, and 34% of Republicans, but only 13% of Democrats believe the law is enforced equally for all citizens.
By contrast, on matters other than citizen equality under law, Democrats are far more confident than Republicans in the basic operation of government. For example, 71% of Democrats, but only 22% of Republicans, regard American elections as free of fraud. 38% of Democrats, but only 12% of Republicans, believe that government statistics are free from political manipulation. 35% of Democrats, but only 13% of Republicans, trust that government agencies are not used to punish political opponents.
Finally, respondents who express no partisan affiliation tend to rate performance low, with assessments closer to the lower partisan group on polarized items, and in many cases lower than either partisan cohorts — for example, on whether the political system is open to all parties, whether the right to peaceful protest is protected, whether all votes have equal impact on election results, whether political candidates disclose information relevant to how they would govern, and whether the judiciary imposes an effective check on executive authority.
Appendix
Bright Line Watch conducted its sixteenth survey of academic experts during November 5–19, 2021 and eleventh of the general public during November 10–19, 2021, on the quality of democracy in the United States. Our public sample consisted of 2750 survey participants from the YouGov sample who were selected and weighted to be representative of the U.S. adult population. We also surveyed 564 political science experts across a diverse range of subfields (5% of solicited invitations). Our email list was constructed from the faculty list of U.S. institutions represented in the online program of the 2016 American Political Science Association conference and updated by reviewing department websites and job placement records from Ph.D. programs in the period since.
All estimates shown in the report used weights provided by YouGov. Our expert sample is traditionally unweighted because we do not collect demographic data to protect anonymity. Error bars in our graphs represent 95% confidence intervals. Data are available here.
Both the expert and public samples in Wave 16 responded to a battery of questions about democratic performance in the United States. Afterward, they were asked to evaluate the quality of American democracy overall on a 100-point scale.
How well do the following statements describe the United States as of today?
- The U.S. does not meet this standard
- The U.S. partly meets this standard
- The U.S. mostly meets this standard
- The U.S fully meets this standard
- Government officials are legally sanctioned for misconduct
- Government officials do not use public office for private gain
- Government agencies are not used to monitor, attack, or punish political opponents
- All adult citizens enjoy the same legal and political rights
- Government does not interfere with journalists or news organizations
- Government effectively prevents private actors from engaging in politically-motivated violence or intimidation
- Government protects individuals’ right to engage in unpopular speech or expression
- Political competition occurs without criticism of opponents’ loyalty or patriotism
- Elections are free from foreign influence
- Parties and candidates are not barred due to their political beliefs and ideologies
- All adult citizens have equal opportunity to vote
- All votes have equal impact on election outcomes
- Elections are conducted, ballots counted, and winners determined without pervasive fraud or manipulation
- Executive authority cannot be expanded beyond constitutional limits
- The legislature is able to effectively limit executive power
- The judiciary is able to effectively limit executive power
- The elected branches respect judicial independence
- Voter participation in elections is generally high
- Information about the sources of campaign funding is available to the public
- Public policy is not determined by large campaign contributions
- Citizens can make their opinions heard in open debate about policies that are under consideration
- The geographic boundaries of electoral districts do not systematically advantage any particular political party
- Even when there are disagreements about ideology or policy, political leaders generally share a common understanding of relevant facts
- Elected officials seek compromise with political opponents
- Citizens have access to information about candidates that is relevant to how they would govern
- Government protects individuals’ right to engage in peaceful protest
- Law enforcement investigations of public officials or their associates are free from political influence or interference
- Government statistics and data are produced by experts who are not influenced by political considerations
- The law is enforced equally for all persons
- Incumbent politicians who lose elections publicly concede defeat
Additional Components of Expert Survey
Expert respondents were asked to respond to address batteries of questions about proposed political reforms and about current political events.
Full descriptions of proposed reforms
- Enlarge the House of Representatives: Substantially enlarge the House of Representatives through federal legislation to make it and the Electoral College more representative of the nation’s population.
- Ranked-choice voting: Introduce ranked-choice voting in presidential and congressional elections.
- Multi-member districts: Repeal the 1967 law that mandates single-member districts for the House so that states have the option to use multi-member districts on the condition that they adopt a non-winner-take-all election model.
- Redistricting commissions: Pass federal legislation requiring fair congressional districts to be determined by state-established independent citizen-redistricting commissions.
- Public funding of campaigns: Pass “clean election laws” for federal elections that would create mechanisms such as public matching donation systems and democracy vouchers.
- National popular vote: Establish an interstate compact that would allow presidents to be elected by direct popular vote instead of the Electoral College.
- Eliminate filibuster: Change US Senate rules to eliminate the filibuster, allowing a simple majority of senators to bring any proposal to the floor for a vote.
- Non-partisan primaries and two-round elections: Choose members of Congress in two-round elections in which all voters pick from a common set of candidates and the “top X” (two, four, five, etc.) advance to a run-off if none wins a majority in the first round.
- Expand the Senate: Admit Washington, DC and Puerto Rico as states, expanding the Senate to 104 senators.
Political events
In this series of questions, we ask how normal or abnormal and how important or unimportant recent political events are.
Is this normal or abnormal?
- Normal
- Mostly normal
- Borderline normal
- Mostly abnormal
- Abnormal
Is this unimportant or important?
- Unimportant
- Mostly unimportant
- Semi-important
- Mostly important
- Important
- GOP senators filibuster Democrats’ election administration and voting rights legislation
- GOP-controlled state legislature in Arizona removes power over election-related lawsuits from Democratic Secretary of State
- Trump praises Ashli Babbitt, who was killed in the January 6 insurrection
- Conservative lawyer’s memo outlines six-point plan for VP Mike Pence to overturn the 2020 election
- About 1/3 of GOP 2022 Congressional candidates have publicly endorsed false claims about the 2020 election outcome
- Texas enacts new law restricting voting access over Democratic objections
- 10 of 15 Republican candidates for Secretary of State in five battleground states question the legitimacy of the 2020 election
- Tucker Carlson claims the Biden administration’s immigration policy is called “the great replacement”
- Florida, Texas, and other states ban the teaching of “critical race theory”
- 14 Republican congressmen write letter attacking Biden’s mental faculties
- White House Chief of Staff emailed acting attorney general theory that Italian firm rigged 2020 election
- Hannity compliments Trump on acing test intended to identify dementia and cognitive decline
- Conservative Political Action Conference (CPAC) Dallas attendees chant “lock him up” in reference to Dr. Fauci
- The singer Nicki Minaj tweets about her cousin’s friend’s supposed side effects from a COVID-19 vaccine
- Associated Press investigation finds fewer than 200 cases of potential voter fraud out of 3.4 million ballots cast in Arizona
- Sen. McConnell encourages followers to get vaccinated against COVID-19
- Biden evacuates US troops from Afghanistan
- Supreme Court initially declines to block Texas abortion law allowing lawsuits against abortion providers after 6 weeks
- Biden mandates COVID-19 vaccine for all federal employees
- Biden opposes changing filibuster rule in Senate to raise or suspend the debt ceiling
- SCOTUS Justice Breyer says he has not decided when he will retire
- Mitt Romney says “the politicization of the [COVID-19] vaccine is an outrage and frankly moronic”
- Biden signs bill to make Juneteenth a national holiday
- Larry Elder concedes to Gavin Newsom in California gubernatorial recall election
- Gov. Andrew Cuomo (D‑NY) resigns amidst sexual assault allegations
- Sen. Blackburn says infrastructure bills are an attempt to enact socialism in America
- Biden hosts 4th of July party on White House South Lawn
- University of Florida prohibits political science professors from testifying as expert witnesses in a case challenging a Florida voting rights law supported by Governor Ron DeSantis
Additional components of public survey
Please indicate whether you agree or disagree with each statement below.
- Strongly agree
- Somewhat agree
- Neither agree nor disagree
- Somewhat disagree
- Strongly disagree
Attention check 1:
- By law, abortion should never be permitted
- In order to reduce the budget deficit, the federal government should eliminate all welfare programs that help poor people
- The federal government should raise the minimum wage to $10
- The federal government should guarantee health insurance for all citizens
- The federal government should pass new rules that protect the right of workers to join labor unions
- Barack Obama was the first president of the United States
Attention check 2:
- People convicted of murder should be given the death penalty
- World War I came after World War II
- Gays and lesbians should have the right to legally marry
- In order to reduce the budget deficit, the federal government should raise taxes on people that make more than $250,000 per year
- The Affordable Care Act passed by Congress in 2010 should be repealed
Threats, harassment, and violence:
- When, if ever, is it OK for [own party — Democrats/Republicans] to send threatening and intimidating messages to [opposing party — Republican/Democrat] leaders? (Never, Occasionally, Frequently, Always)
- When, if ever, is it OK for an ordinary [own party — Democrat/Republican] in the public to harass an ordinary [opposing party — Democrat, Republican] on the Internet, in a way that makes the target feel frightened? (Never, Occasionally, Frequently, Always)
- How much do you feel it is justified for [own party — Democrats/Republicans] to commit non-violent misdemeanors in advancing their political goals these days? (Not at all, A little, A moderate amount, A lot, A great deal)
- How much do you feel it is justified for [own party — Democrats/Republicans] to commit non-violent felonies in advancing their political goals these days? (Not at all, A little, A moderate amount, A lot, A great deal)
- How much do you feel it is justified for [own party — Democrats/Republicans] to commit violent felonies in advancing their political goals these days? (Not at all, A little, A moderate amount, A lot, A great deal)
- How much do you feel it is justified for [own party — Democrats/Republicans] to use violence in advancing their political goals these days? (Not at all, A little, A moderate amount, A lot, A great deal)
- Thinking about the riot that took place at the U.S. Capitol on January 6 while Congress was in the process of certifying Electoral College votes… How much do you feel violence was justified to prevent Congress from certifying Electoral College votes? (Not at all, A little, A moderate amount, A lot, A great deal)
- Thinking about the riot that took place at the U.S. Capitol on January 6 while Congress was in the process of certifying Electoral College votes… How much do you feel violence is justified to restore Donald Trump to the presidency? (Not at all, A little, A moderate amount, A lot, A great deal)
Additional result
Additional figures
Notes
- Respondents who are independents (i.e., who do not identify with or lean toward either party) were asked to provide estimates for each party in randomized order.
- “Out-partisan” refers to members of the other party from a given survey respondent.
- We cannot fully rule out the possibility that inattentive respondents are also sincerely more supportive of threats, harassment, and violence than attentive respondents, but the huge reduction in endorsement we observe among inattentive respondents when the question format and wording are changed suggests that the difference is largely an artifact of question format. On this basis, we prefer estimates based on attentive respondents as best reflective of overall support for violence, threats, and harassment.