The Accuracy of Expert Forecasts of Negative Democratic Events
By Andrew Little and Bright Line Watch
The November 2024 wave of the survey asked experts to make predictions about the probability of negative events in the second Trump term. Are these predictions a reliable indicator of how likely these events are to occur? To answer this, we can ask how predictions made in previous waves have lined up with reality. Most of these events described scenarios that we consider unambiguously bad for democracy, such as “Disputes over the election results escalate to political violence in which more than 10 people are killed nationwide.”1 Of the 82 events, we code 73 as unambiguously negative. We focus on the 69 of these for which we can now clearly say whether the event occurred or not. The average event in our sample has 254 expert forecasts.
In short, we find that experts are highly pessimistic in the sense that they assign a higher probability to negative events than the actual rate at which those events occur.2 However, after aggregating across experts and adjusting for their pessimism, the resulting forecasts are remarkably accurate. We also find that experts who primarily study American politics and rate US democracy relatively favorably are the least pessimistic and make the best predictions.
Measuring expert pessimism
To assess the accuracy of these forecasts, we compare the average probability assigned to events with the share of events that actually occurred. If experts are accurate forecasters, these two numbers will be similar. Instead, we find that experts are too pessimistic in the sense that they consistently place too high of a probability on negative events.
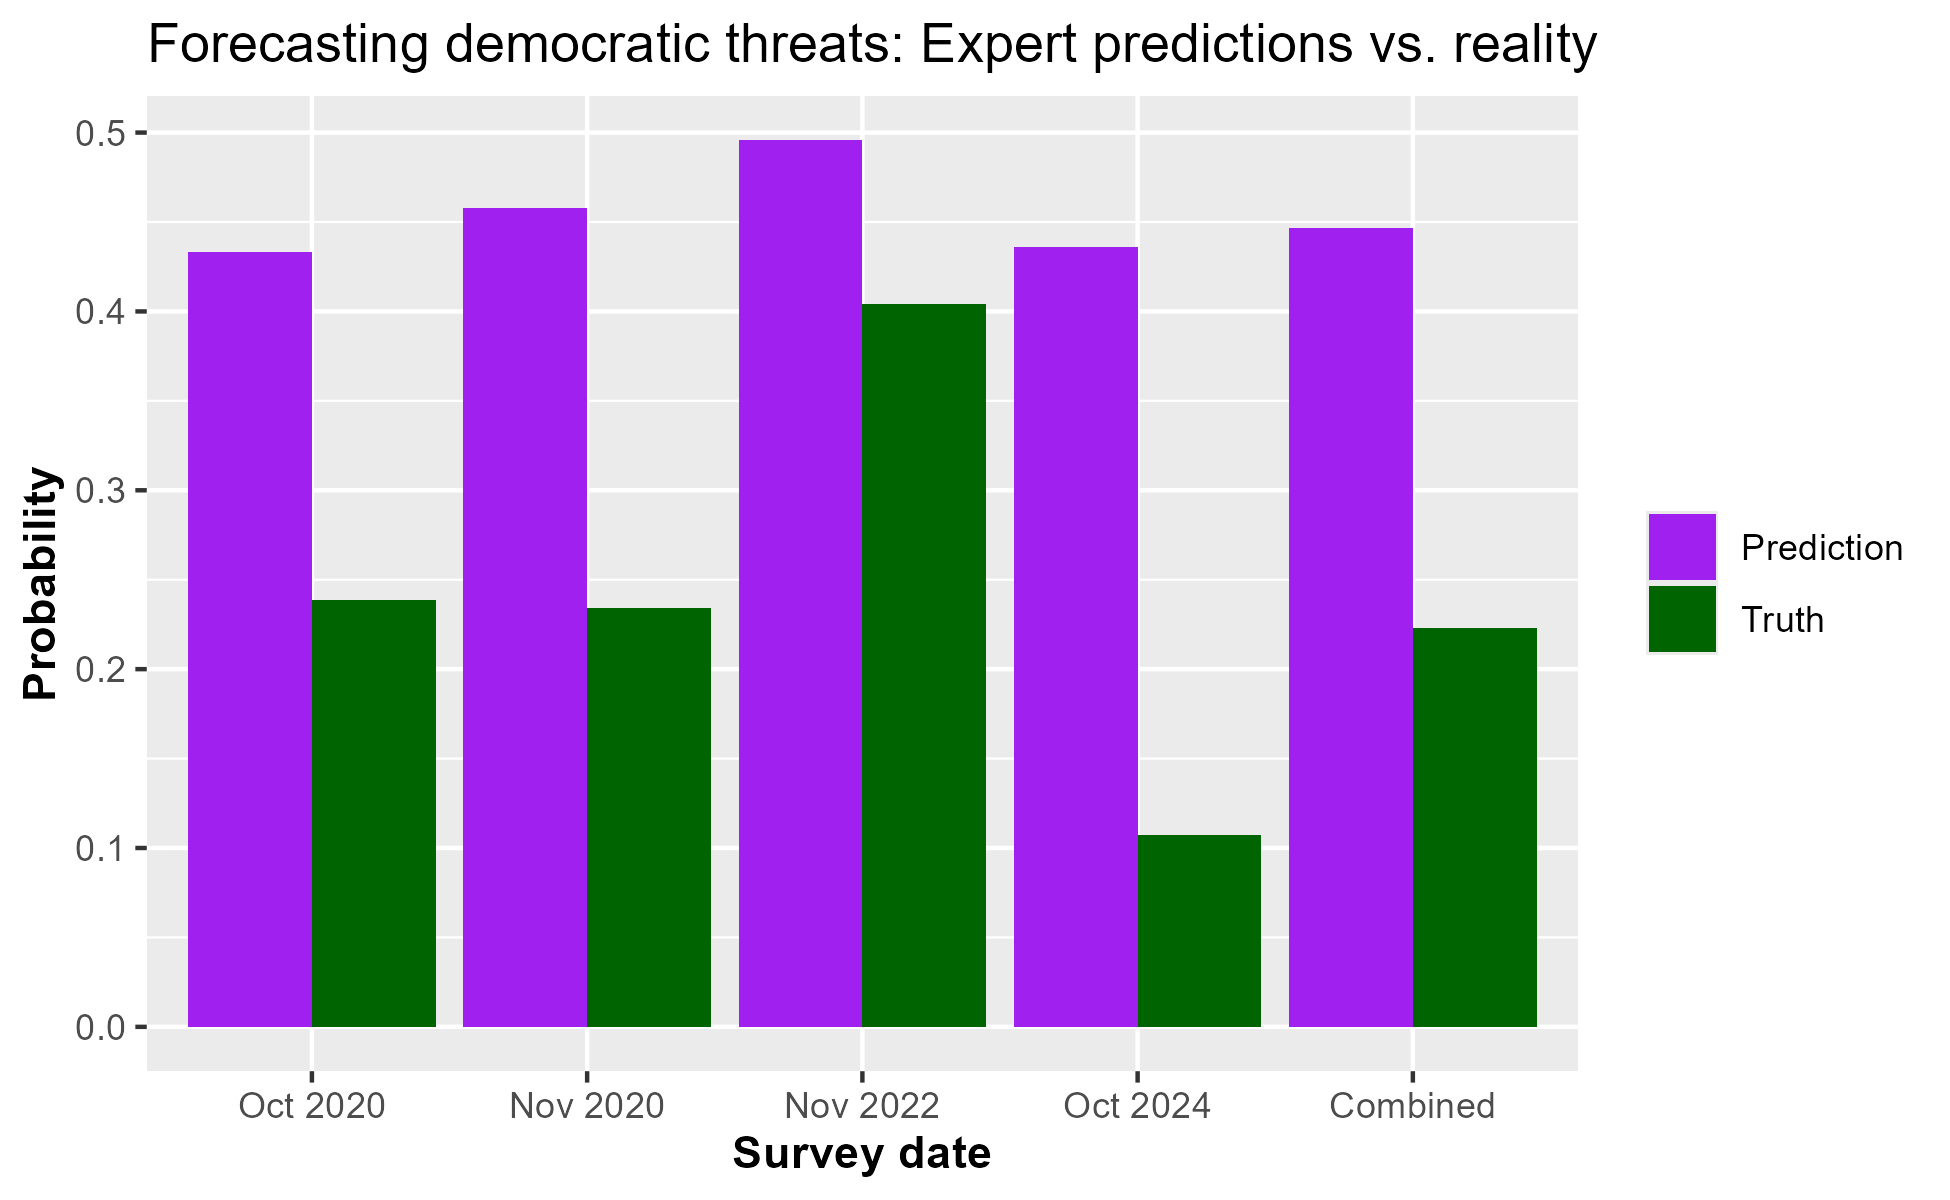
The figure below plots the average prediction in purple and the share of negative events that actually occur in green across these four survey waves. Overall, the average probability assigned to negative events was about 45%, but only 22% occured. This difference is particularly stark in data from October 2024 — the average probability estimate for negative events was 44% but only 11% of the events actually happened.3
Evaluating expert accuracy by group
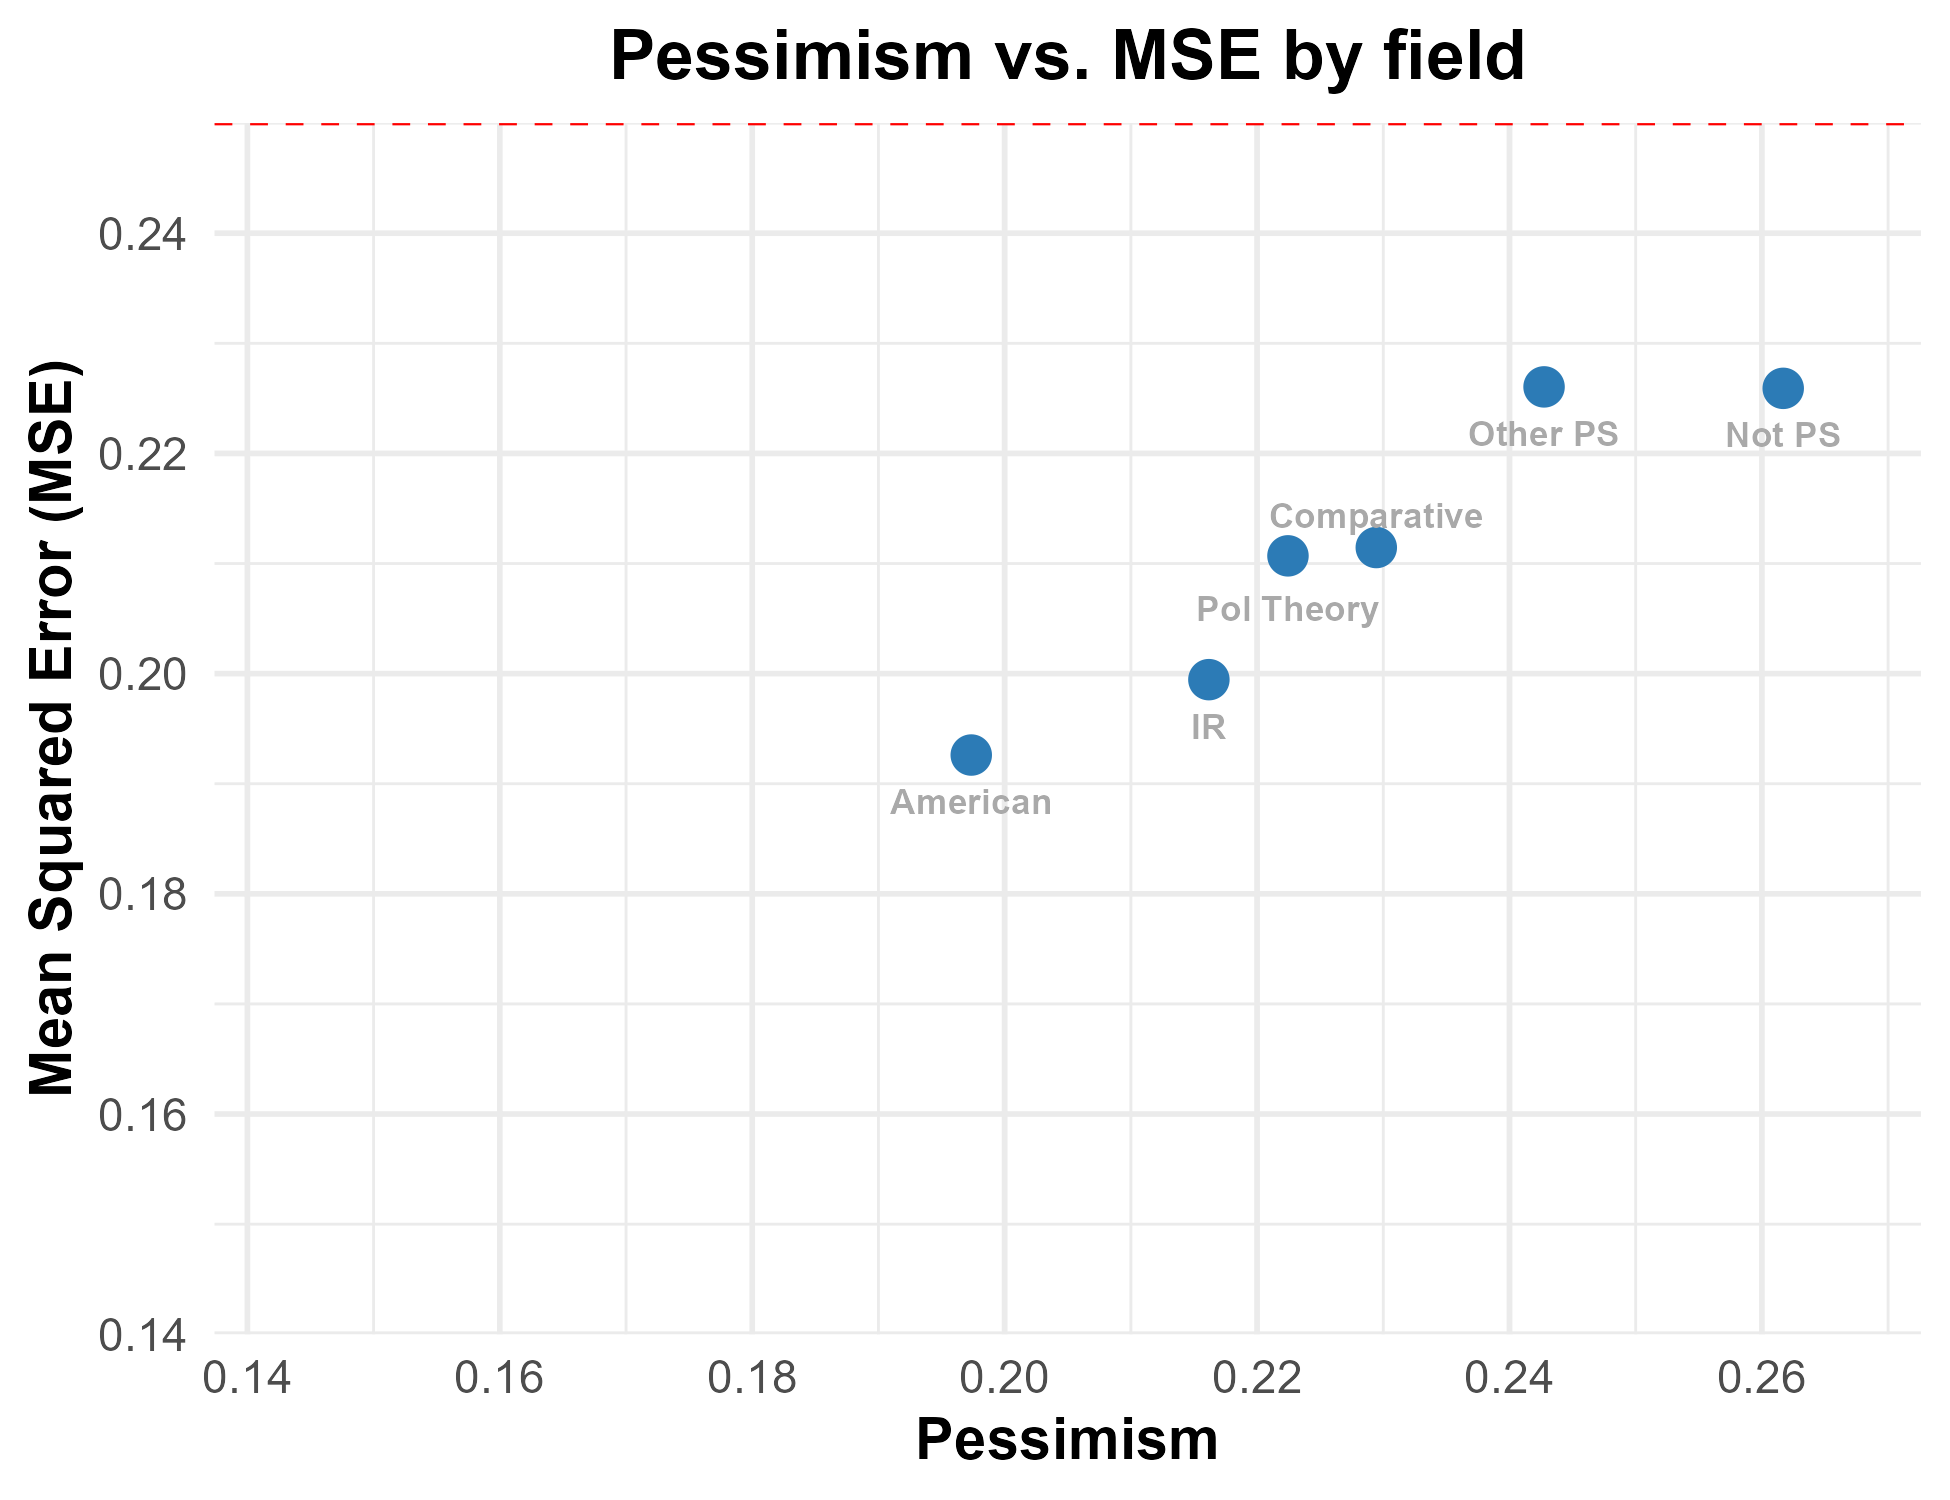
We next ask which groups of experts are most pessimistic. We again measure pessimism by comparing the average probability assigned to negative events to the share of the predicted events that actually occur. As is standard, we measure the quality of predictions using the metric of mean squared error (MSE), which is equal to the average squared difference in the probability assigned to an event minus the outcome (1 for events that occur and 0 for those which do not). A forecaster who makes perfect predictions (i.e., assigns 1 to all events which occur and 0 to all which do not) gets an MSE of 0, while someone who always predicts the opposite of the truth gets an MSE of 1. A useful benchmark in MSE is that someone who lacks any information and assigns probability 0.5 to all events – colorfully described by Philip Tetlock as a “dart-throwing chimp” – would have an MSE of 0.25. By comparing the MSE of a group to 0.25, we can approximate how much better their predictions are than uninformed guessing.
The figure below plots the average pessimism and MSE by the primary political science subfield of the expert. Those who study American politics are the least pessimistic (though they still exaggerate the probability of negative events by almost 20 percentage points) and also make the best predictions, with an MSE below 0.2.4 The other major subfields of political science (international relations, political theory, and comparative politics) are also somewhat more pessimistic and also somewhat more inaccurate. Those who classify themselves as in another subfield of political science or outside political science are the most pessimistic and make the worst predictions, only slightly outperforming the proverbial dart-throwing chimps.
Another question asked across all waves is to rate American democracy on a scale from 0 to 100. For each expert, we compute the quartile of their answer to this question (within wave). The figure below shows how pessimism and MSE in predictions varies with this rating, where higher numbers mean a more favorable evaluation of U.S. democracy.
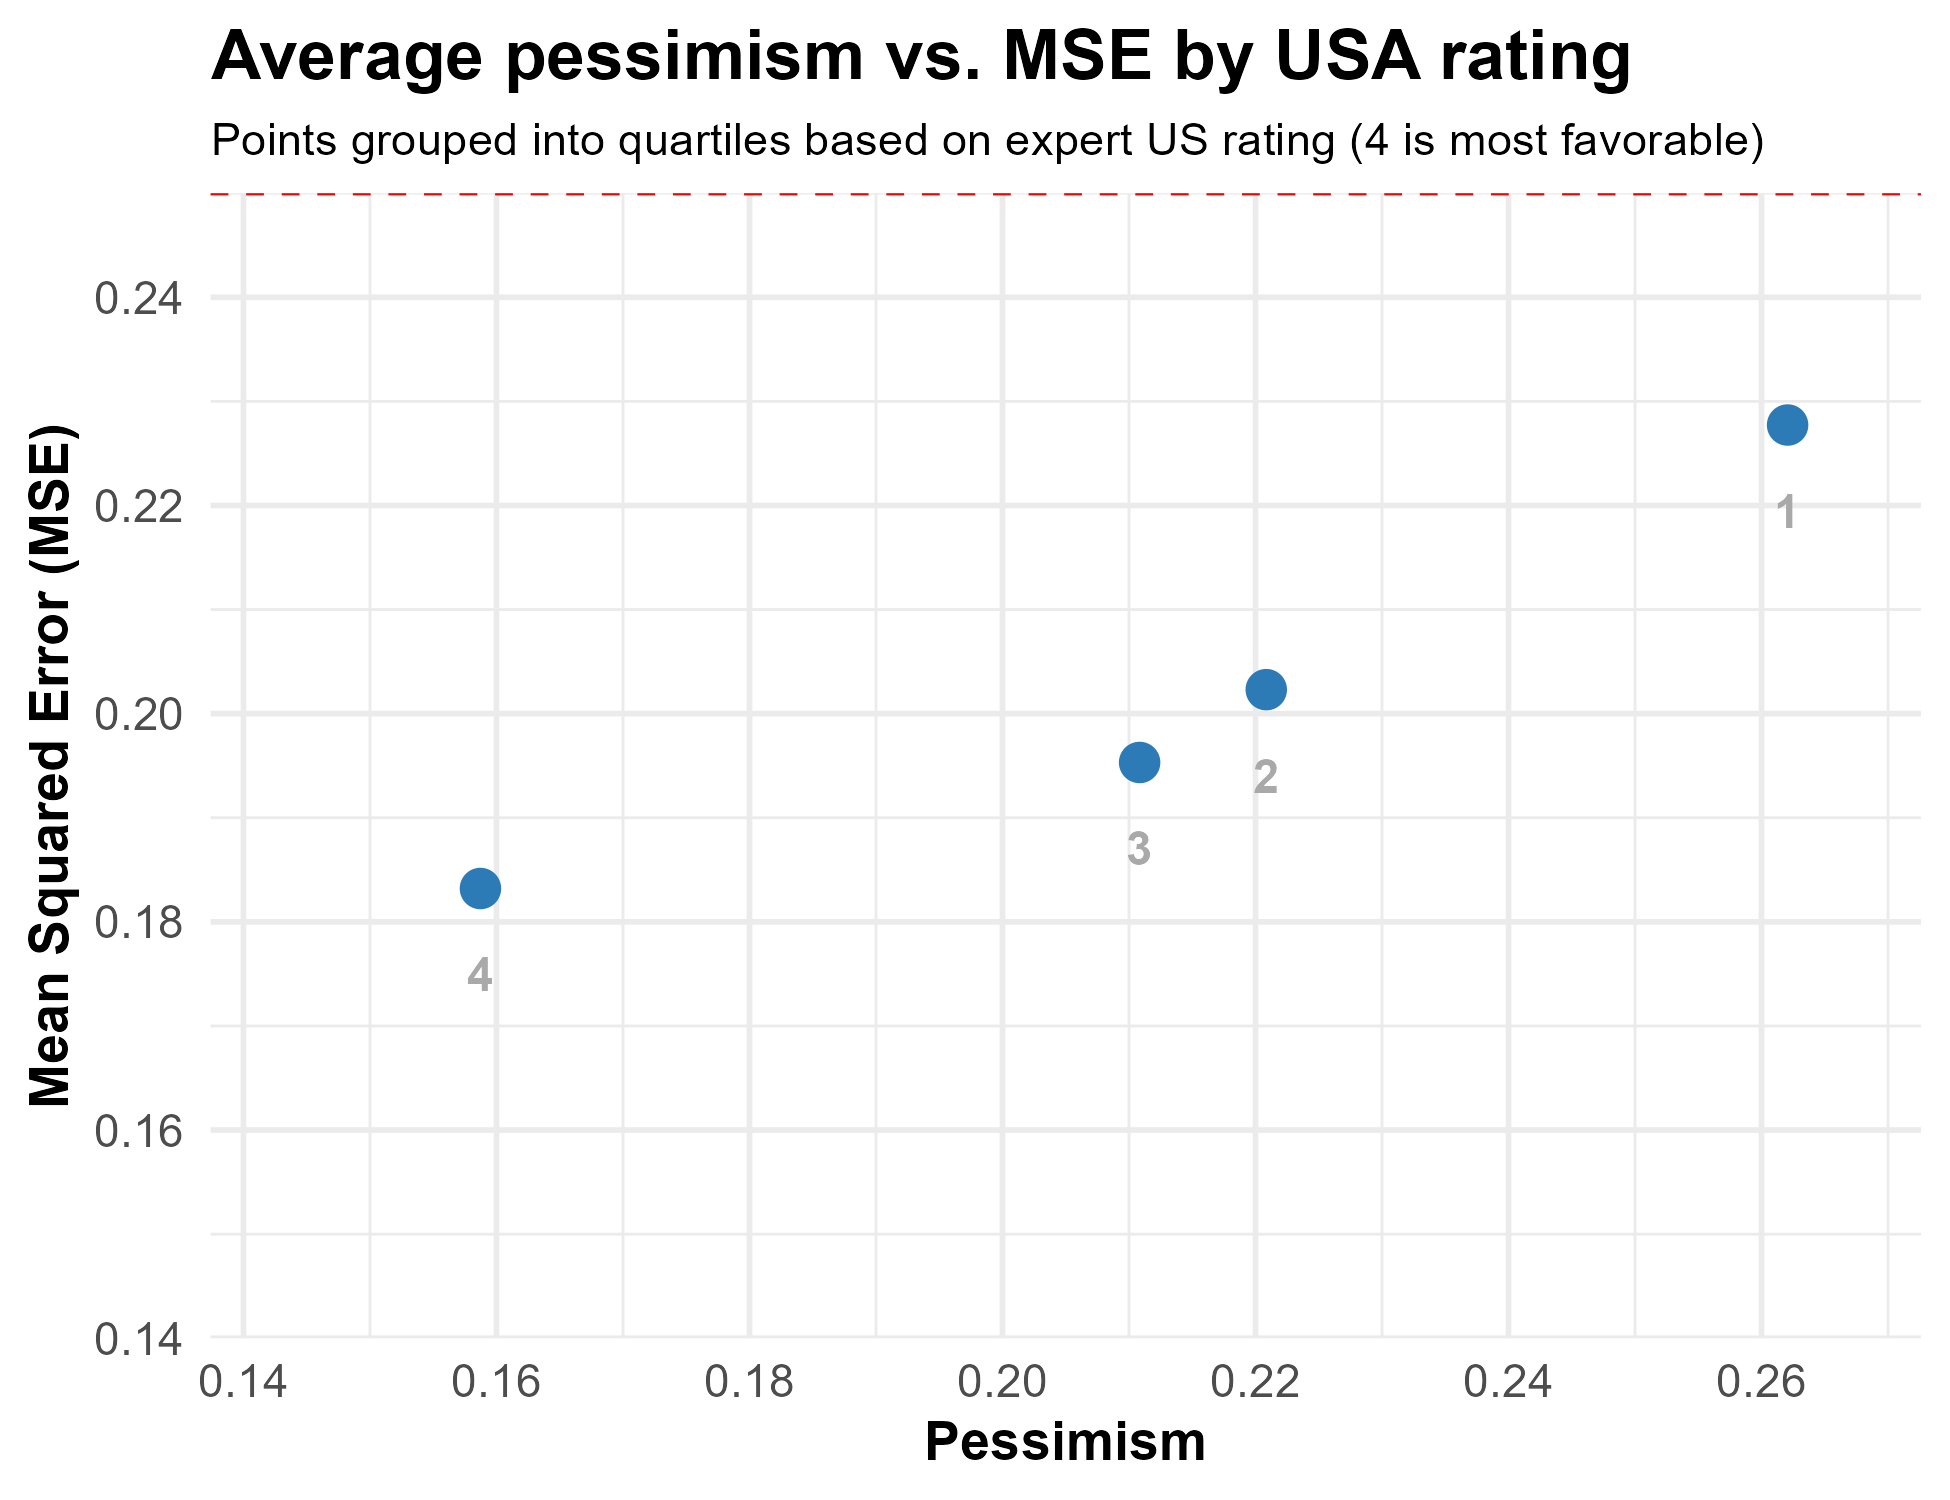
Unsurprisingly, those who give US democracy the most negative ratings (the first quartile, which is labeled 1) are the most pessimistic, overstating the probabilities assigned to negative events and making predictions that are only slightly better than random chance. Those who rate US democracy more positively (quartiles 2, 3, and 4) make predictions that are less pessimistic and more accurate.
Finally, we can check whether those who are more engaged with BLW surveys make more accurate predictions. The figure below plots pessimism and mean squared error (MSE) by how many waves of Bright Line Watch surveys the expert has completed.
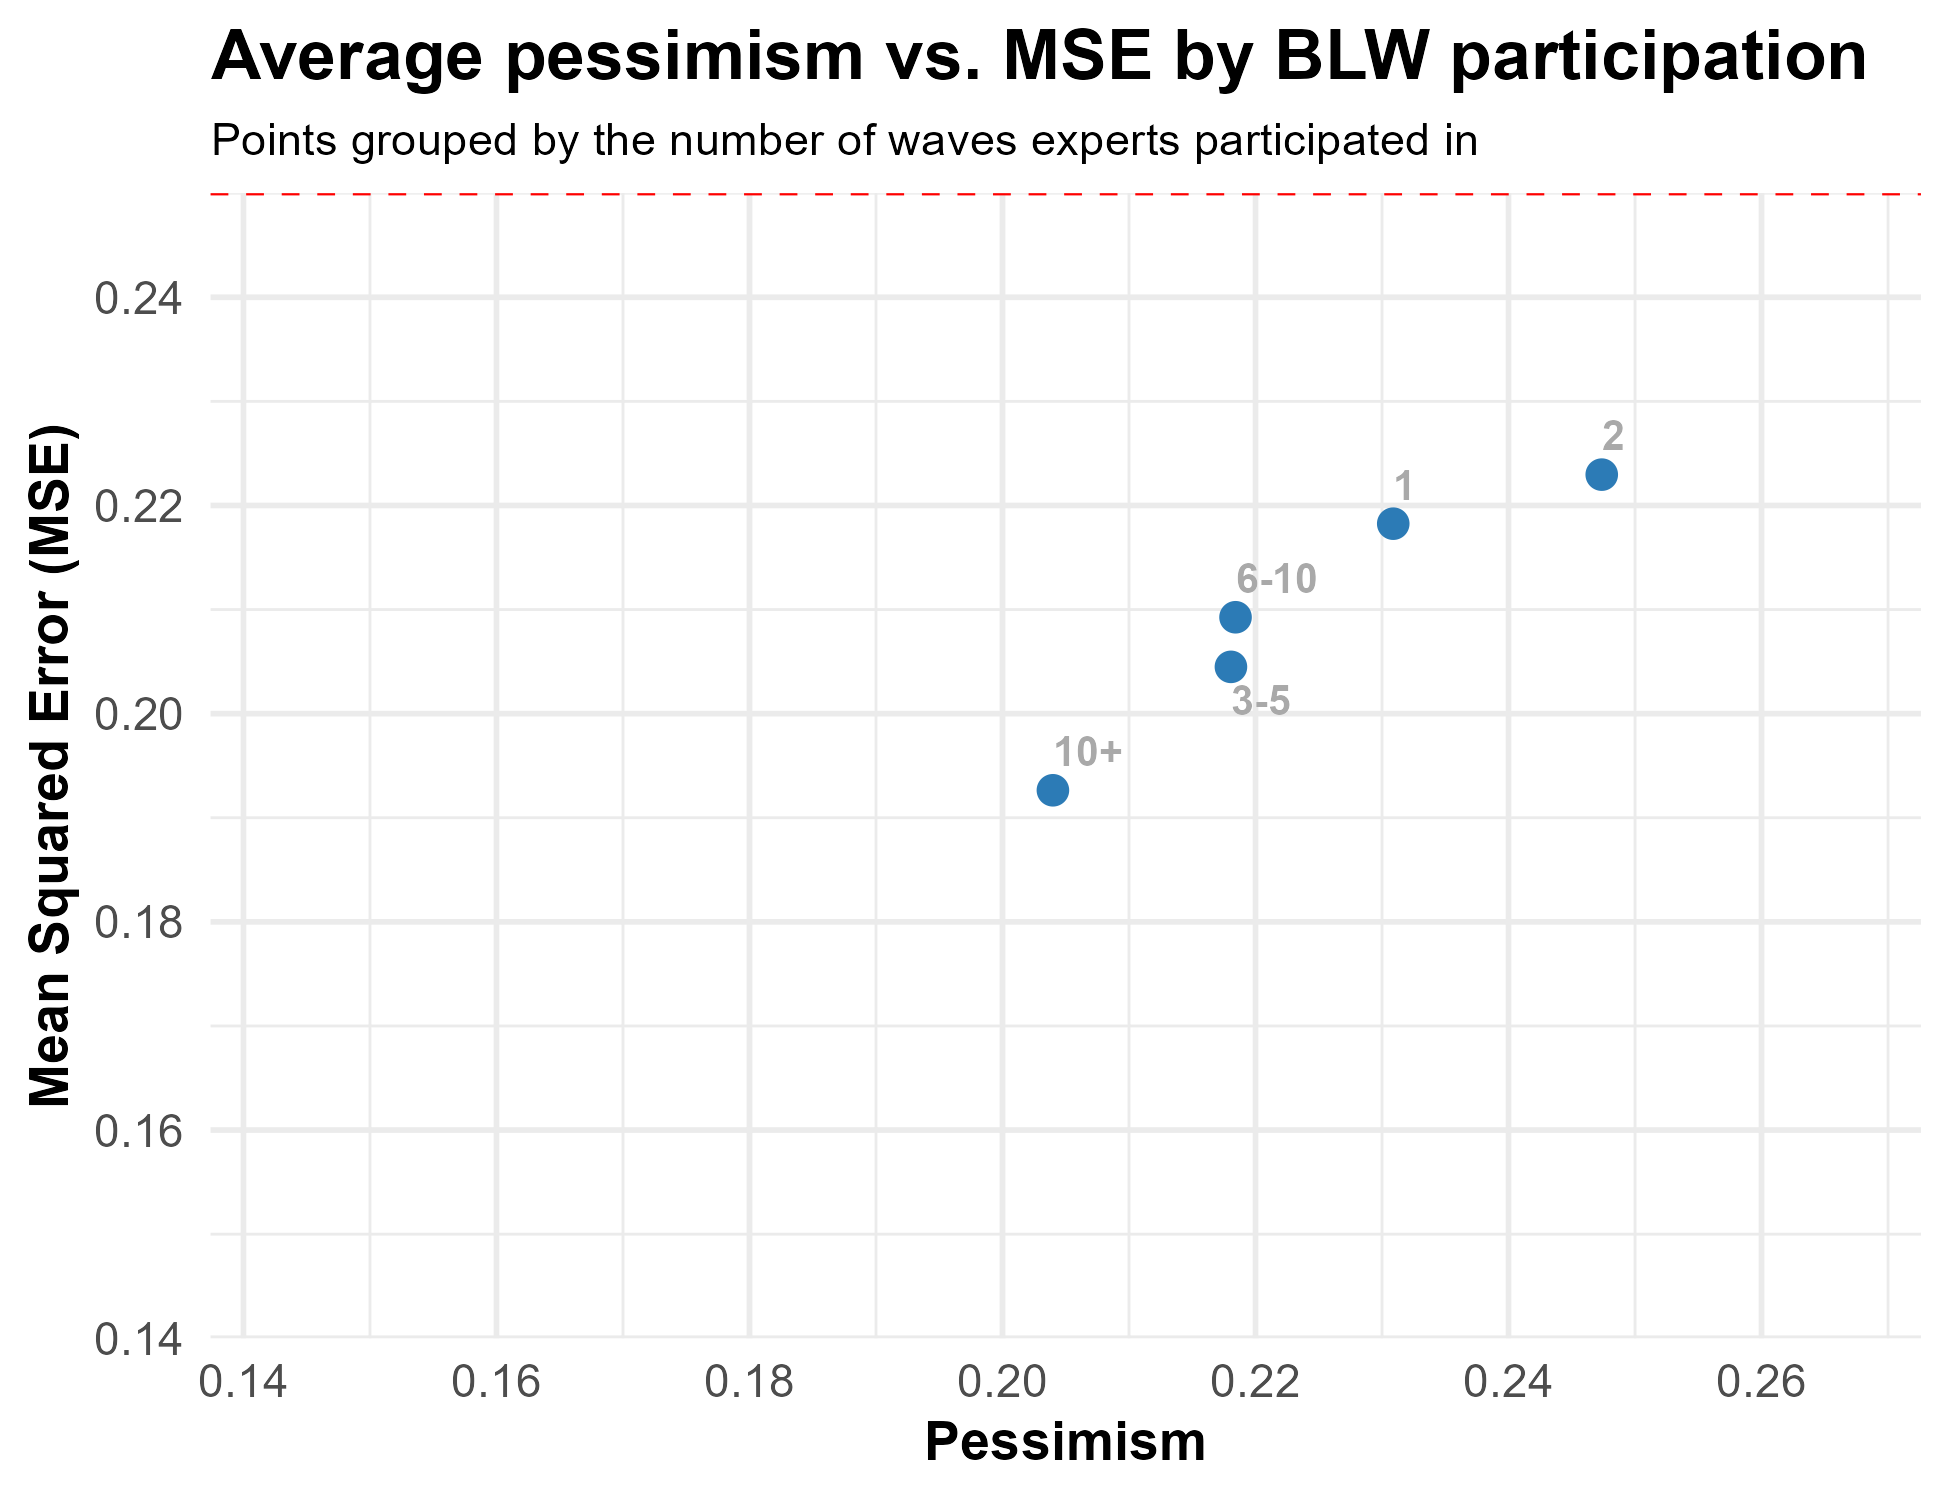
Though the relationship between numbers of surveys completed and both pessimism and accuracy is not totally linear, experts who only completed one or two waves are the most pessimistic and least accurate while those who have completed 10+ waves are both less pessimistic and more accurate.
Implications for debates about measuring democracy
These findings speak to a previous debate involving the authors of this report (and others). Little and Meng argue that the decline in global democracy ratings in recent years may be driven by coders getting more pessimistic over time rather than countries actually becoming less democratic. The findings here can’t directly evaluate this claim because the questions asked change over time, but they do show that political scientists are excessively pessimistic about a prominent country and that this pessimism correlates strongly with evaluations of U.S. democracy. For example, the average rating of U.S. democracy for experts across waves was 65 compared to 70 among those who were not optimistic or pessimistic (i.e., their pessimism is between ‑0.1 and 0.1). If the prevalence of pessimism has changed over time, it could plausibly affect how the U.S. and other countries are coded in widely-used data sources.
On the other hand, these findings also support claims in some responses to Little and Meng. For example, Knutsen et al. argue that relying on country experts may attenuate bias. Accordingly, we find that scholars of American politics are the least pessimistic and most accurate in their predictions (though still pessimistic!). Finally, Bergeron-Boutin et al. show that experts who are more engaged in BLW surveys (measured by the number of waves they complete) are less pessimistic about U.S. democracy. We correspondingly show that these highly engaged subjects are also more accurate in their predictions, suggesting that the experts who take part in country coding may be relatively skilled at doing so in an unbiased way.
Adjusting forecasts for pessimism
Finally, we ask how these findings should affect how we interpret the expert predictions in the November 2024 wave. On an individual level, a simple way to correct for pessimism is by examining a “calibration plot” of past predictions about negative events. This plot breaks the predicted probabilities into ranges of 0–0.1, 0.1–0.2, etc., and plots the average predicted probability within each group against the average probability of the event happening.
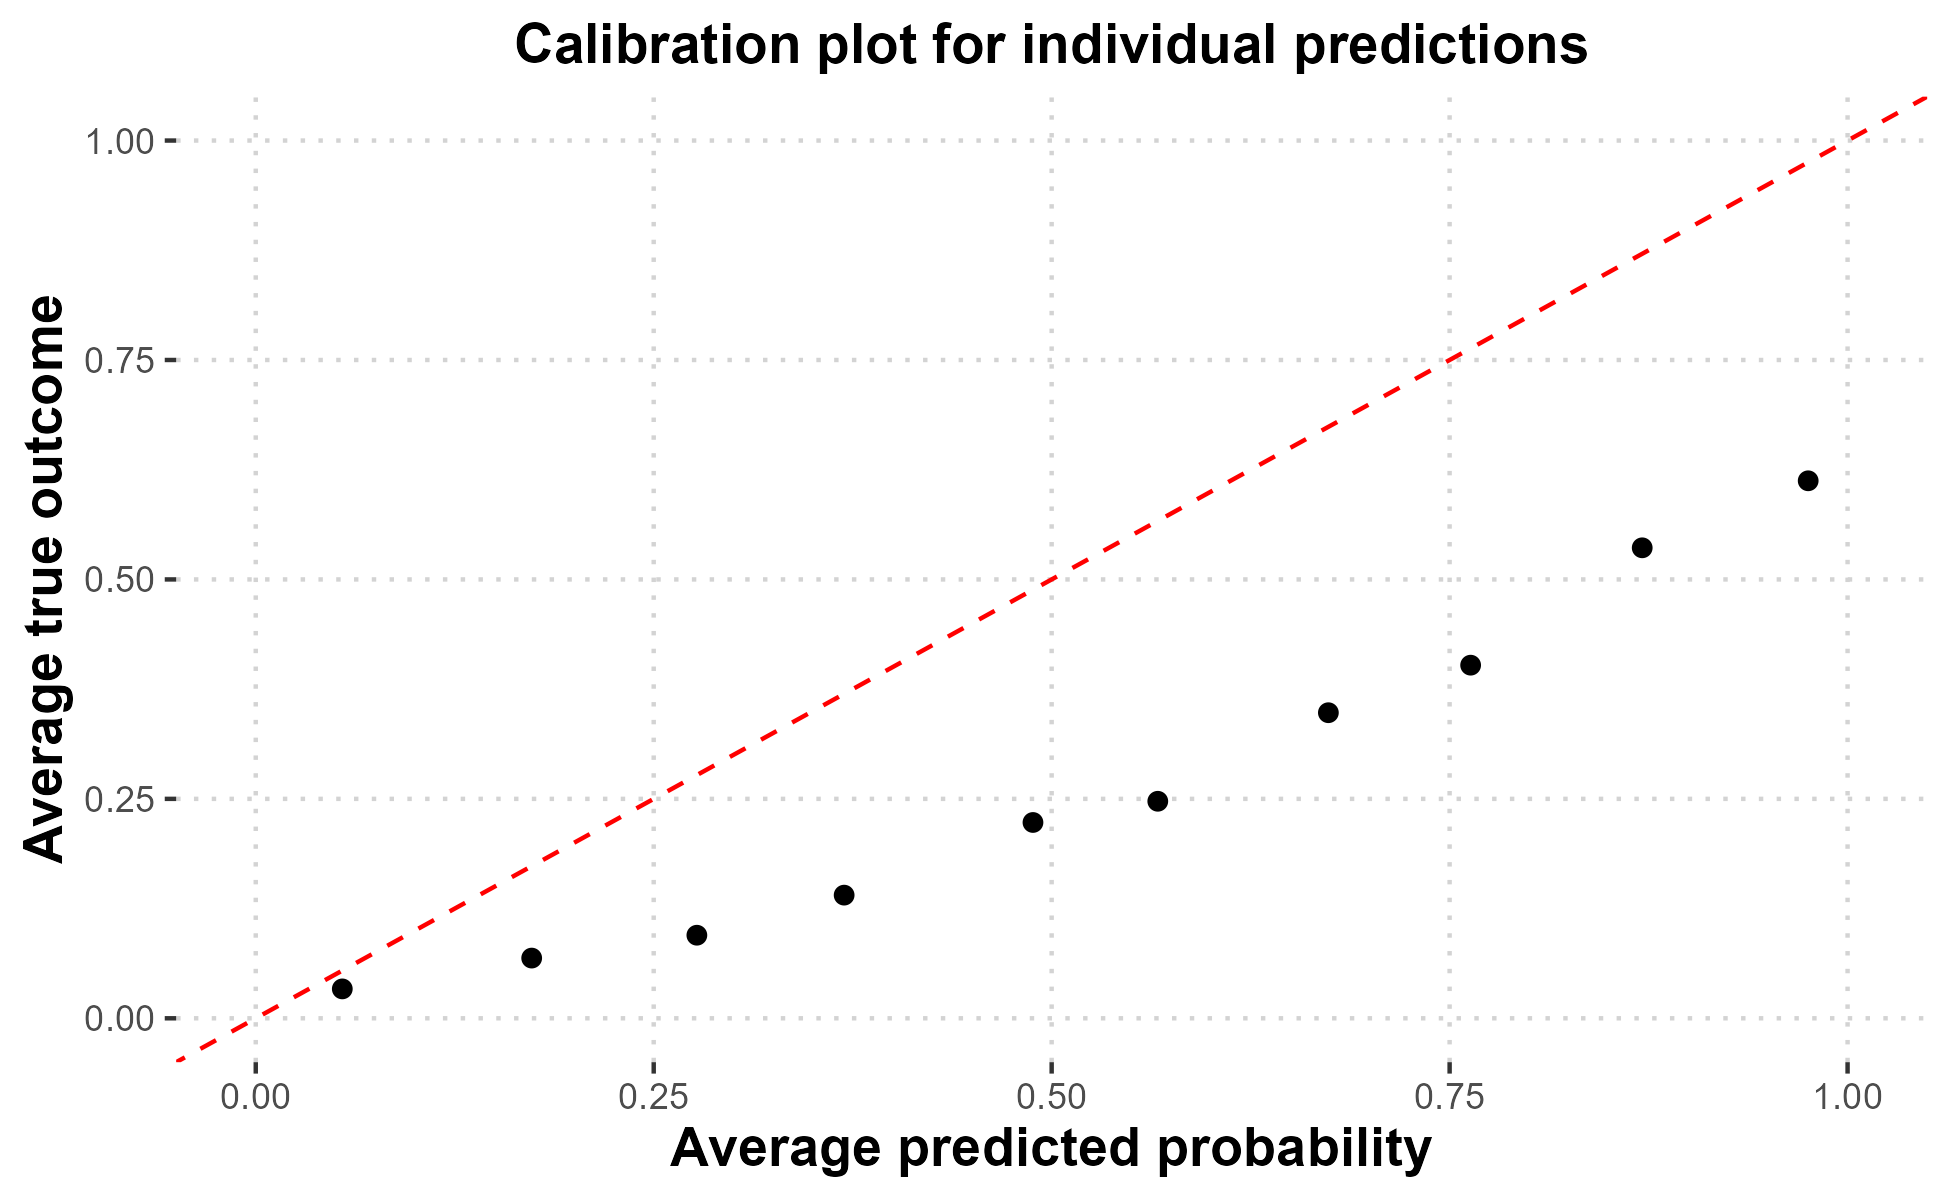
For events with a forecast probability of less than 0.1 (i.e., the expected chance of them happening is less than 10%), the average expert prediction (0.05) corresponds well with the rate at which events occur (0.03). However, as the predicted probabilities increase, expert predictions fall further below the 45 degree line, indicating the events are less likely to occur than predicted. For example, events assigned a probability of 40–50% chance happen less than 25% of the time. Events assigned a probability over 90% happen only 61% of the time.
We also want to know how to adjust aggregate predictions for pessimism. For example, if the median predicted probability of an event occurring is 60%, how often should we expect it to occur? Making an analogous calibration plot is more difficult because we only have 69 observations. The following figure therefore flexibly estimates the relationship between the median probability experts assign to an event and its likelihood.5
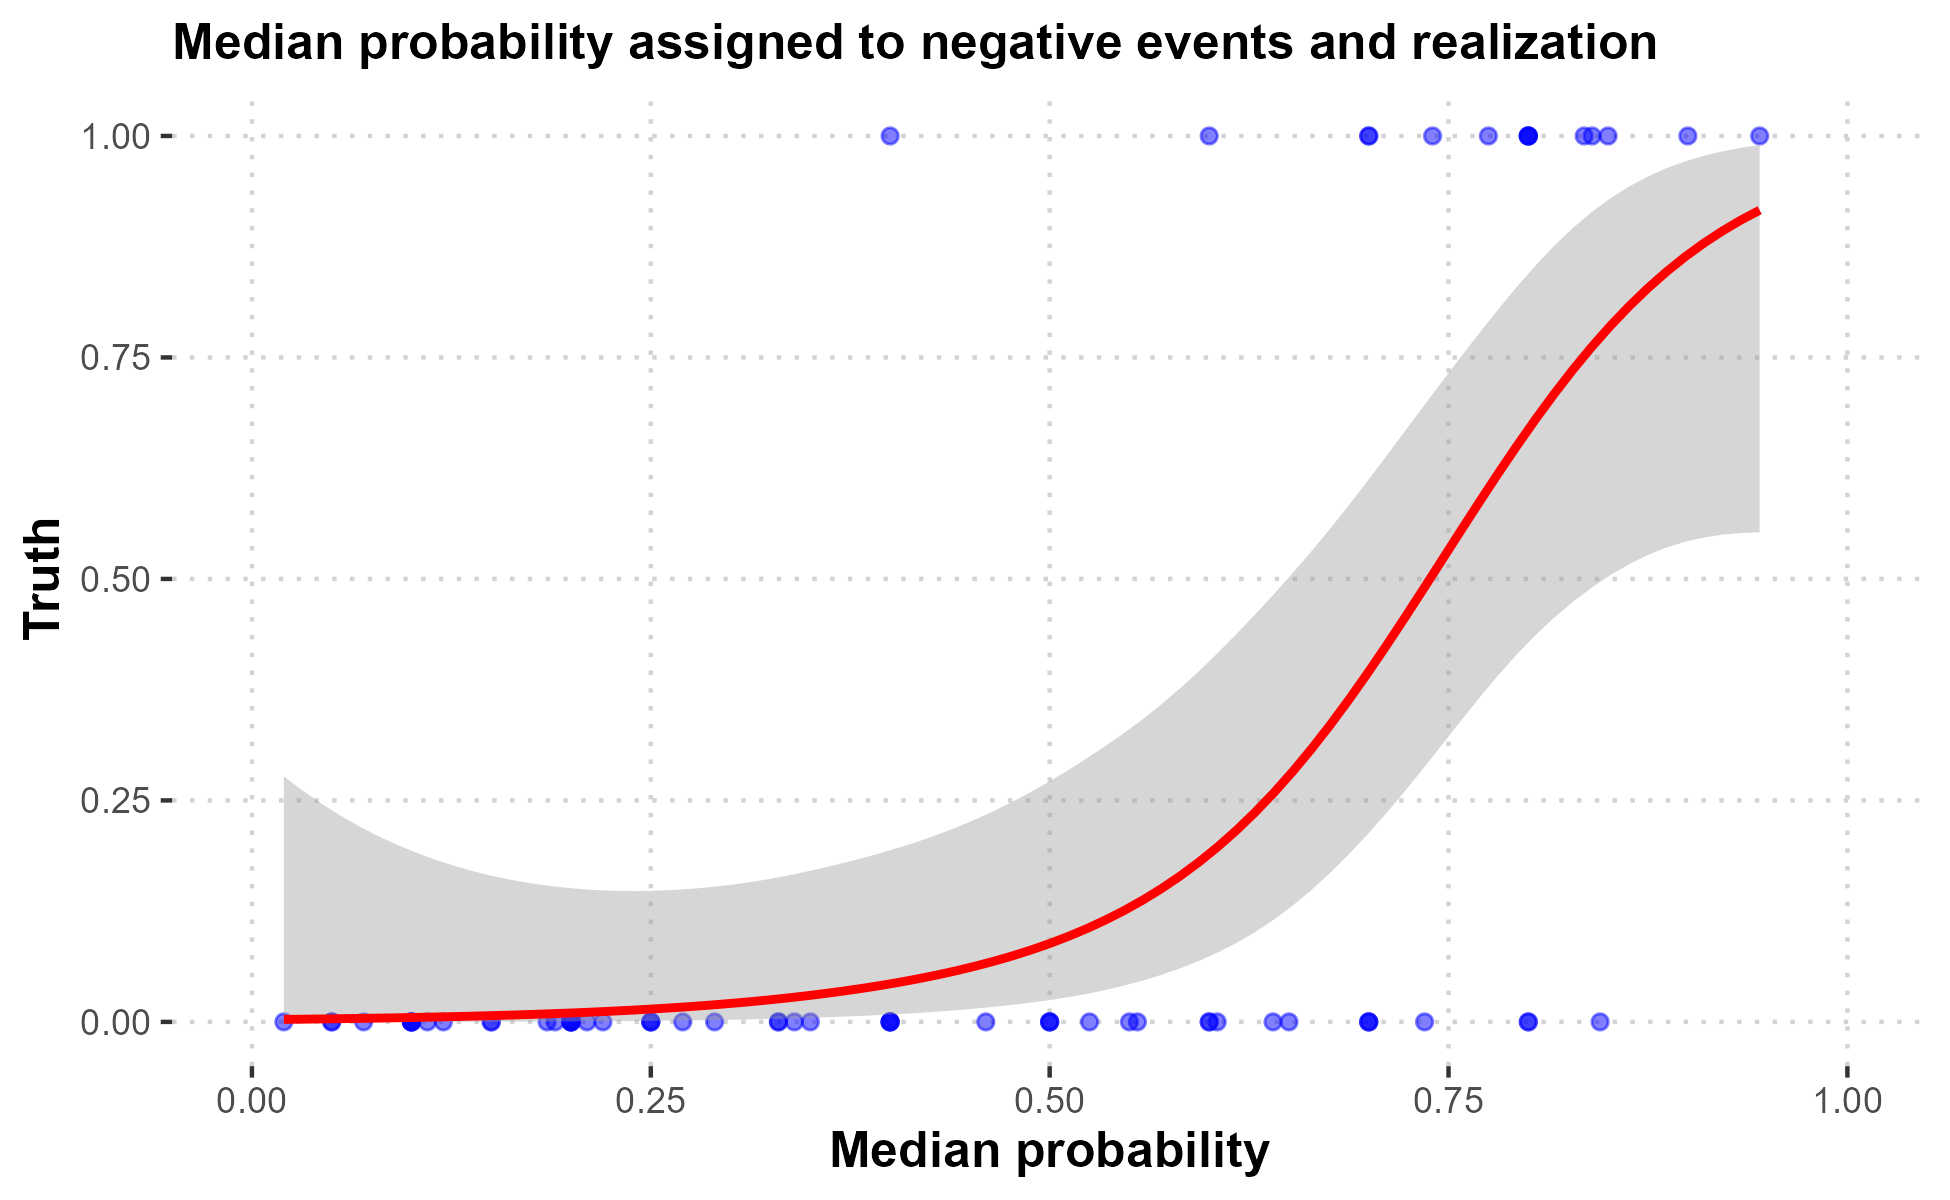
We first note that only one event out of 40 assigned a median probability less than 0.5 actually occurred,6 while all but three of the 16 events assigned a probability greater than 0.75 occurred.7 So, while the pessimism we observe at the individual level holds at the aggregate level as well, we should be worried about negative events that experts think are very likely to occur.
To summarize how combining aggregation and adjustment for pessimism can lead to substantially better predictions, we first create an adjusted probability for individual predictions using the same flexible approach as we do for the aggregate predictions above.8 We then compare the MSE and pessimism of the (1) unadjusted individual predictions, (2) adjusted individual predictions, (3) unadjusted aggregate (median) predictions, and (4) adjusted aggregate (median) predictions following the approach above.
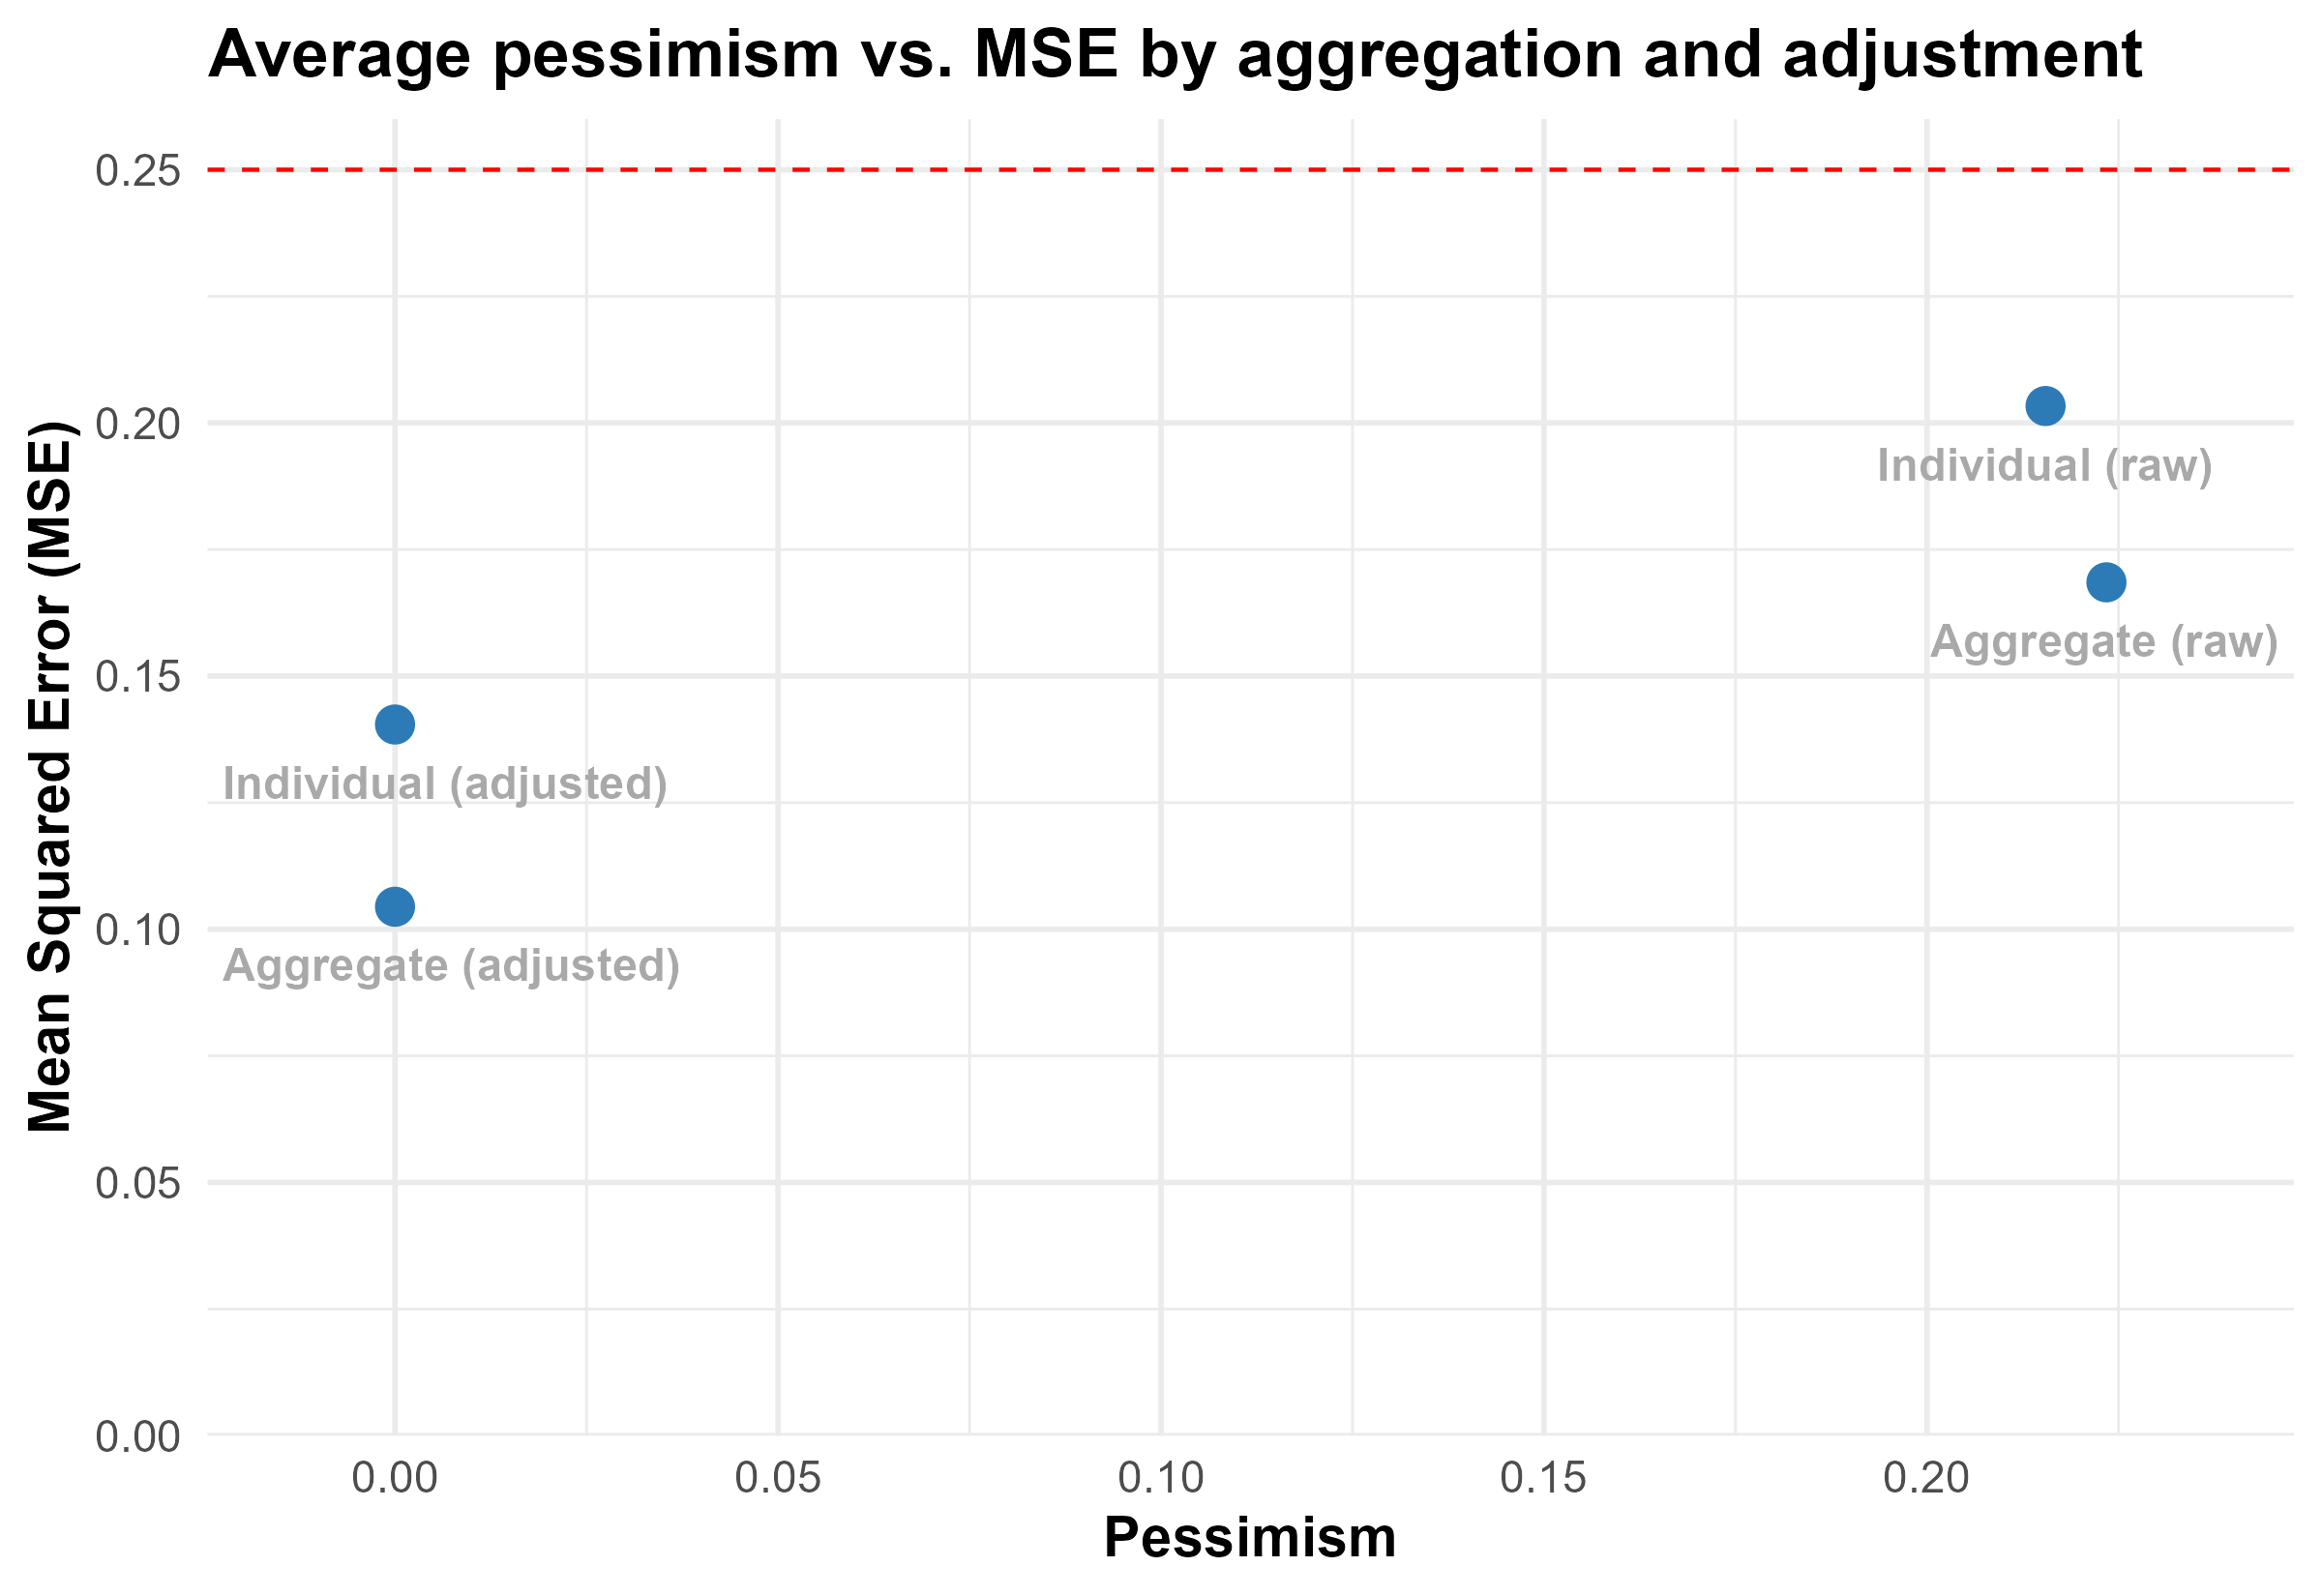
Starting with the individual raw predictions, the MSE is 0.20, which is not substantially better than random chance. However, adjusting these individual scores for pessimism lowers the MSE to 0.14. Similarly, taking the median prediction of all experts lowers the MSE to 0.17. Combining both of these steps lowers the MSE to 0.10. One way to think about how much these adjustments improve predictions is to ask how much more accurate the resulting predictions are relative to the benchmark of random chance. The individual raw predictions reduce MSE by 13% relative to random chance while the aggregate adjusted predictions reduce MSE by 57%.
We can apply this method to adjust the forecasts of events from the November 2024 wave that have not resolved:
- The Trump administration directs the Department of Justice to suspend the prosecution of at least one person accused of crimes related to the 2020 election or the events of January 6, 2021.
- Trump issues a pardon to himself for any federal charges he faces.
- The Trump administration directs the Department of Justice to investigate Joe Biden or another leading Democrat.
- Trump creates a board with the power to review generals and admirals and to recommend removals of them.
- The Trump administration detains and deports millions of undocumented immigrants.
- Trump’s appointees use the powers of the Federal Communications Commission to challenge the broadcast license of one or more media outlets.
- The Trump administration fires tens of thousands of civil servants who work for federal government agencies.
- The Senate parliamentarian is removed by June 30, 2025.
- Trump attempts to stay in power beyond the end of his term in office in January 2029.
The following figure compares the median forecast with the adjusted median forecast for these events.
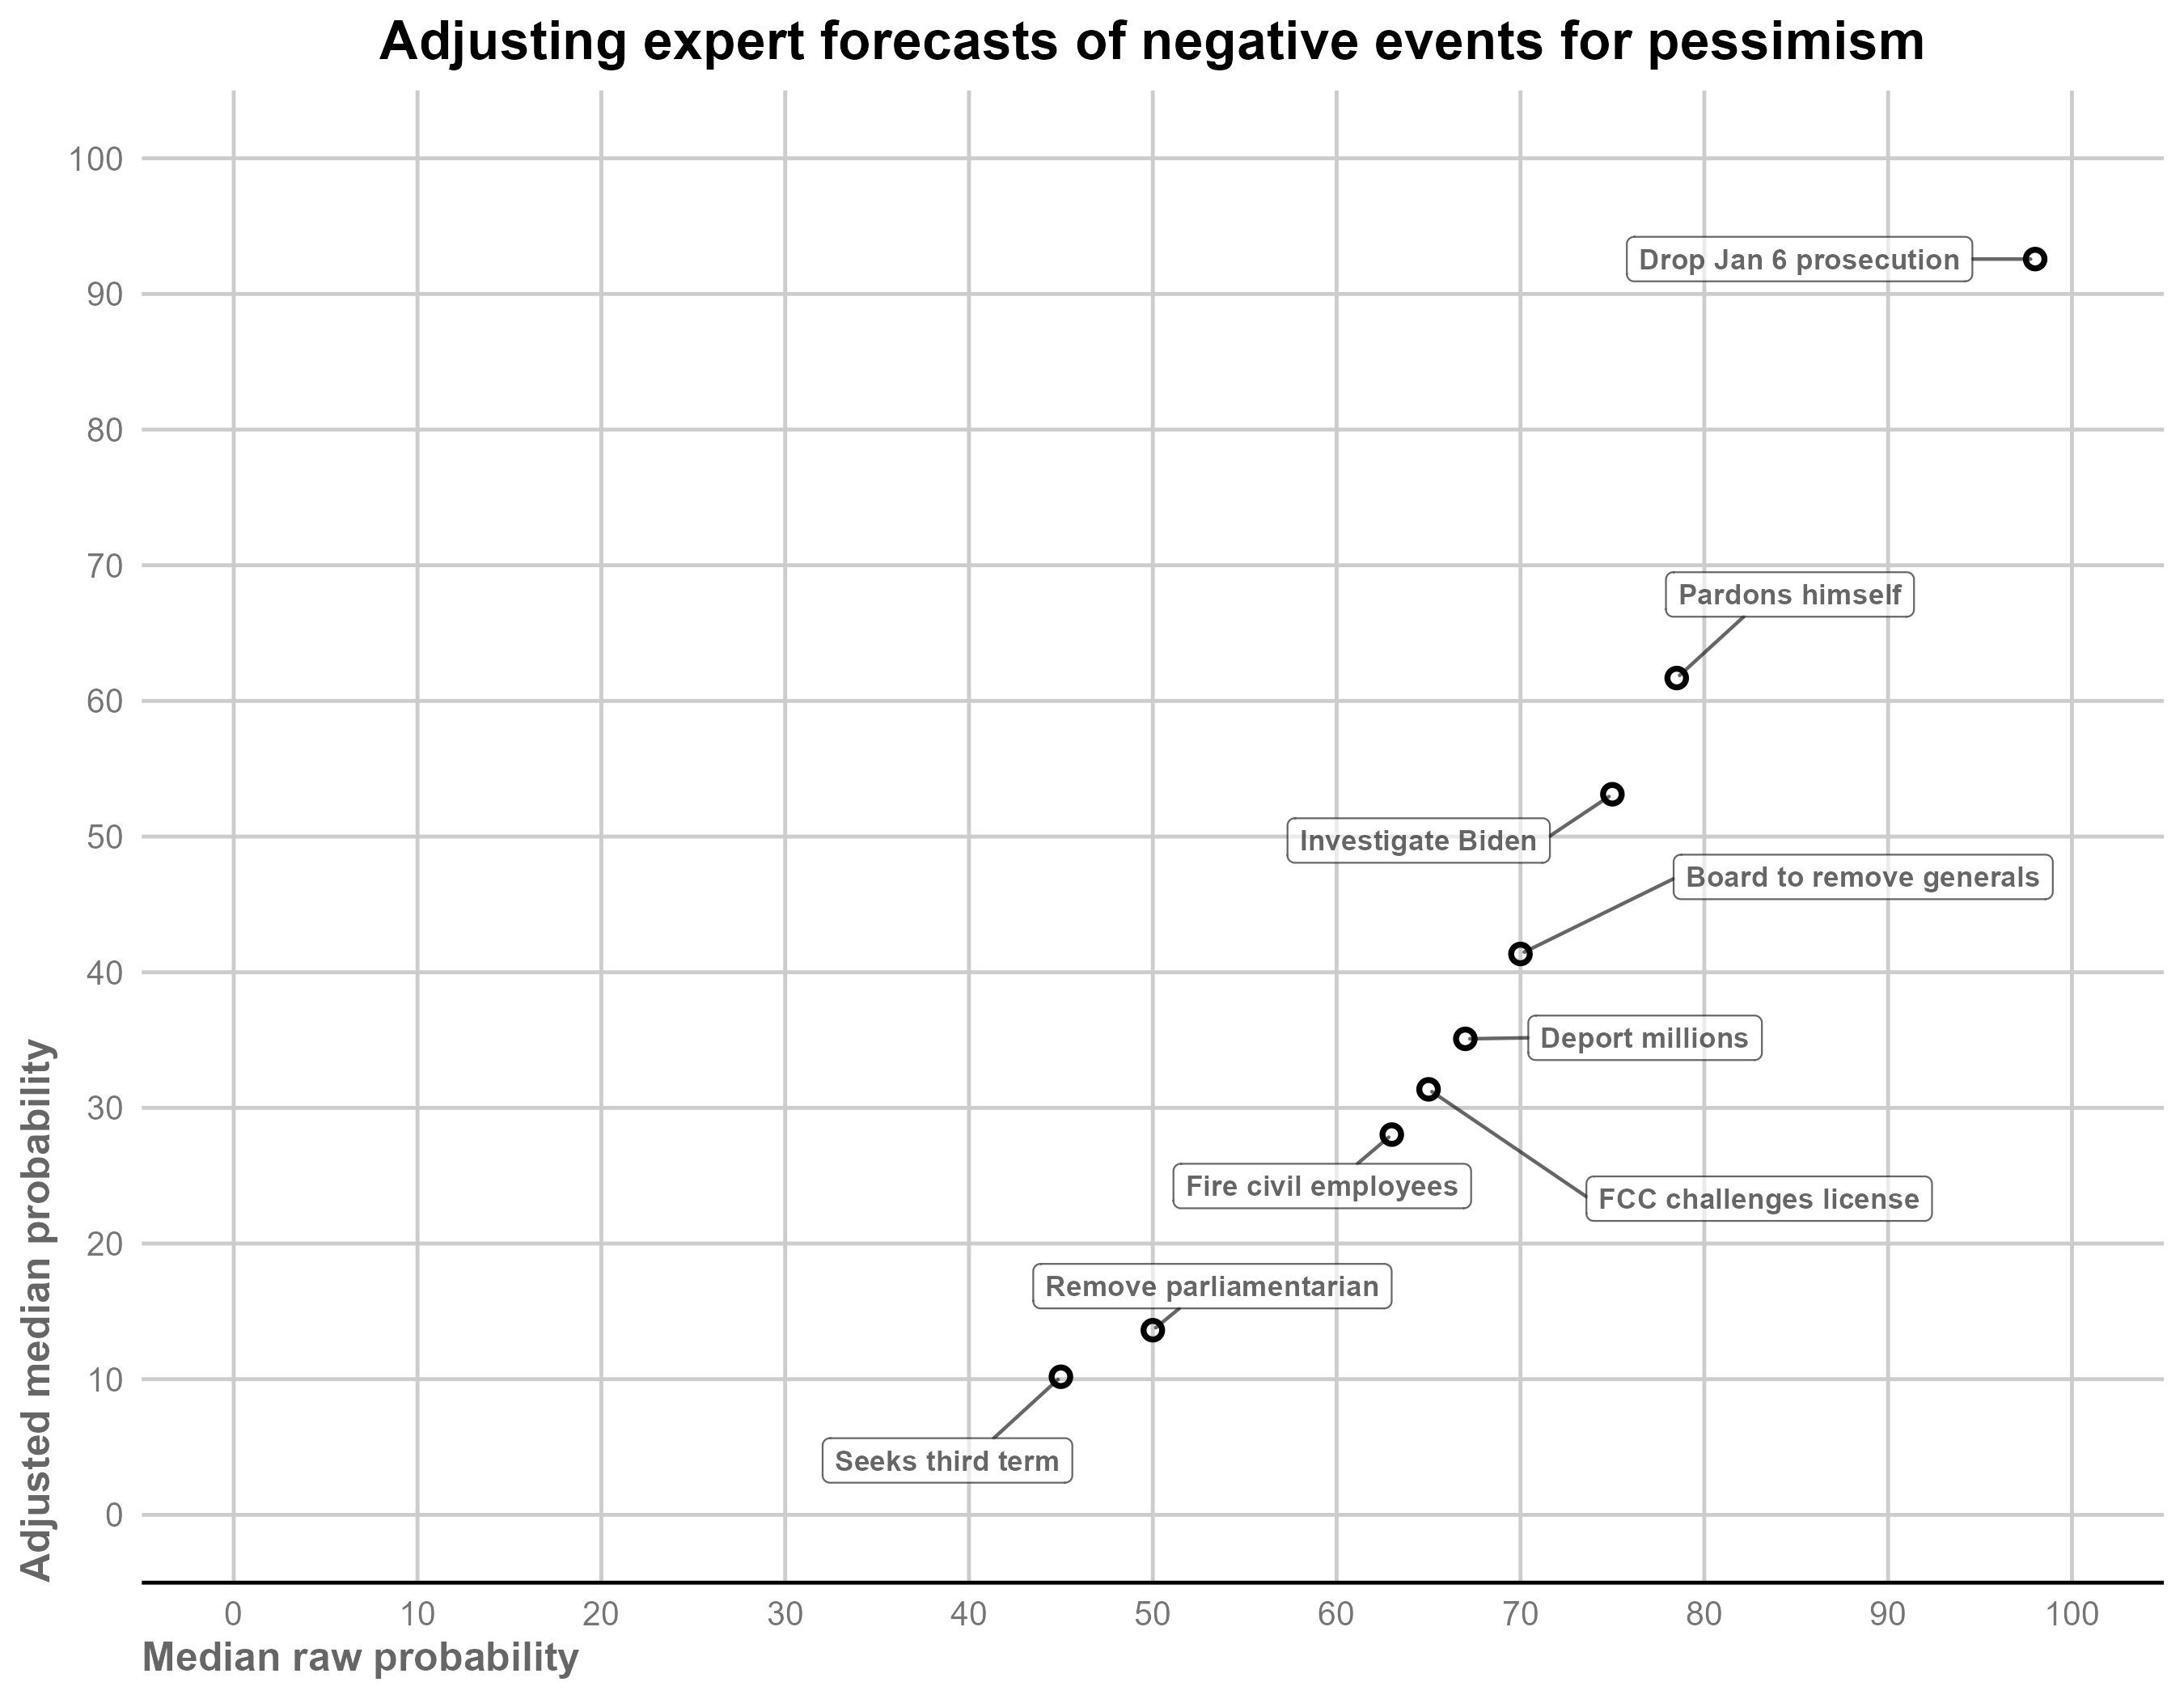
For events assigned a very high median probability (e.g., Trump directing the Department of Justice to suspend at least one prosecution related to the 2020 election or January 6), the adjusted forecast is essentially the same as the raw median. However, other events are adjusted downward substantially. For instance, Trump creating a board to review and remove generals decreases from 70% to 41% and the Senate parliamentarian being removed by June 2025 goes from 50% to 14%.
- An example of a neutral event is “Joe Biden is nominated as the Democratic candidate for president in the 2024 election.” We only asked for forecasts on nine such events so we omit analysis of them here.
- To test the effect of pessimism itself on accuracy, we would ideally also test whether experts are less accurate in forecasting negative events than for neutral or positive events. However, we have not asked experts to forecast the probability of enough neutral or positive events to conduct such an analysis.
- It is challenging to construct confidence intervals or run hypothesis tests for this difference since the realizations of the outcomes are almost certainly correlated. Still, we are reasonably confident it is not driven by random chance given the magnitude of the difference and its consistency across waves. Further, a recent study of existential risk found that domain experts were substantially more pessimistic than so-called superforecasters with a track record of making accurate predictions.
- Pessimism is expressed on a 0–1 scale in the graphs we report above but we often characterize it in percentage point terms in the text for expositional clarity.
- To allow for a flexible relationship between the predicted probability and realization while also ensuring predictions are between 0 and 1, we use a generalized additive model with a cubic spline smoother and a logit link function.
- This event was “President Joe Biden’s son Hunter Biden is indicted by the end of 2023”.
- The three events with probability 0.75 or greater that did not take place are “President Trump preemptively pardons Rudy Giuliani and/or employees of the Trump organization” (2020), “[f]ormer President Trump attacks the ‘blue shift’ toward Democrats as mail votes are counted, insisting that the initial totals on Election Night were correct” (2024), and “[f]ormer President Trump makes statements or posts tweets encouraging violence and intimidation during voting or ballot counting” (2024).
- That is, we again use a generalized additive model with cubic splines and a logistic link to predict the probability an event occurs as a function of each individual prediction and then compute the predicted probability from this model.
