Prior to the release of the Mueller report and subsequent escalation of conflict between the executive and legislative branches, Bright Line Watch conducted a new wave of surveys on the quality of democracy in the United States. From March 12–21, 2019, we fielded our eighth survey of academic experts and sixth survey of the general public. Since we began these surveys in 2017, assessments of U.S. democratic performance had generally declined among both groups. In the March 2019 surveys, our first since the 2018 midterm elections, we identified a substantial reversal of that trend (albeit one that is likely already eroding). This survey also includes our first expert ratings of the quality of democracy at the level of state government. The key results from these surveys are:
-
Ratings of overall democratic quality increased among both experts and the general public between October 2018 and March 2019 (before the Mueller report’s release).
-
When we examined specific democratic principles separately, the biggest increases in perceived performance during the October 2018-March 2019 period were on items that include the effectiveness of judicial checks on executive authority, protections from political violence, and the impartiality of investigations.
-
Trump supporters and opponents continue to have starkly different views about the state of American democracy. Overall increases in performance ratings prior to the Mueller report were driven by those who disapprove of President Trump. Within this group, the biggest perceived improvement was on Congress’s ability to check the president. By contrast, Trump supporters believed that U.S. democratic performance on that principle had, in fact, declined since before the 2018 midterm elections.
-
Assessments from our expert sample showed substantial variance in democratic quality at the state level. States rated highest tend to cluster in New England and on the West Coast, whereas many of those ranked lowest are in the South.
Overall democratic quality rises
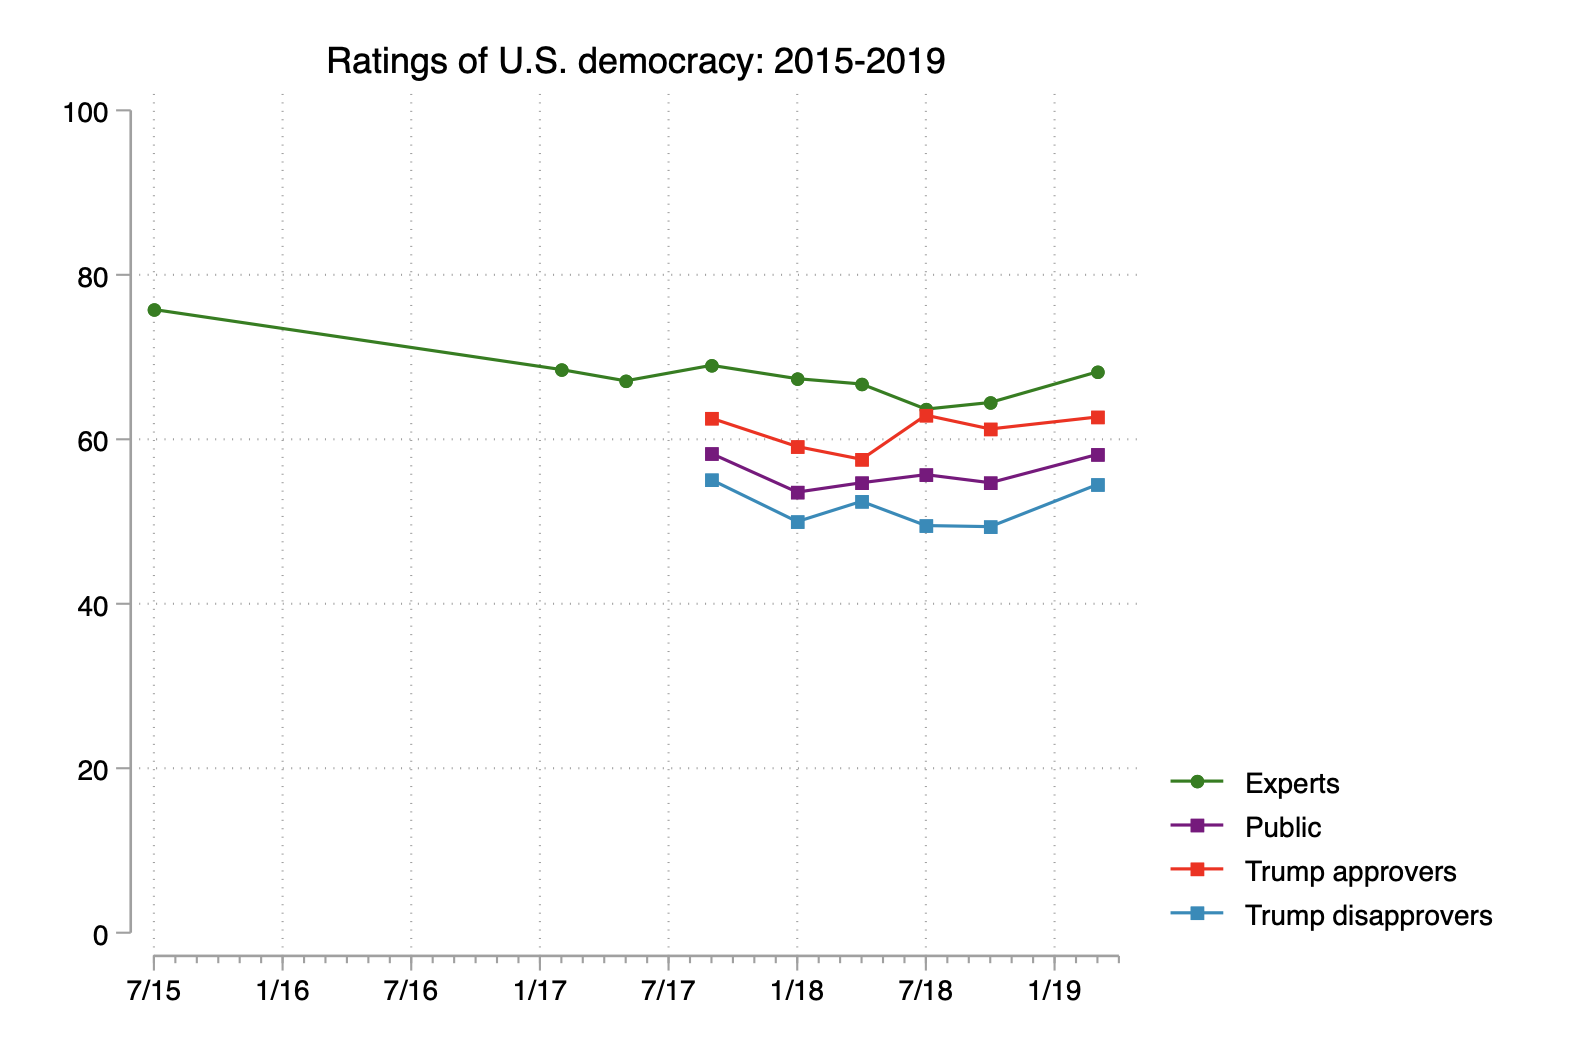
We asked survey respondents to rate the quality of U.S. democracy overall on a 100-point scale. The figure below shows mean ratings from the academic experts, the public overall, and the public disaggregated by their approval of Donald Trump for each wave since we began conducting our surveys.[1] Ratings have generally declined over time among both experts and the public until the most recent surveys. Specifically, the mean rating of U.S. democracy dropped from 69 to 65 among experts from February 2017 to October 2018 and from 59 to 55 among the public between September 2017 and October 2018. In March 2019, those numbers bounced back up to their 2017 levels. Disaggregating the public sample between those who approve and those who disapprove of President Trump shows that both groups register increased ratings between October 2018 and March 2019, but the more pronounced improvement is among Trump’s opponents.
The heart of Bright Line Watch’s democratic performance survey instrument is a battery of ratings of how well 27 democratic principles are currently upheld in the United States. A full list of these principles is included in the appendix. To measure perceived democratic performance, we compare the percentage of respondents who rated the United States as “fully” or “mostly” meeting a given democratic standard with the percentage saying the United States only “partially meets” or “does not meet” it.
We first analyze performance ratings from our academic experts. As the figure below illustrates, we observe statistically significant increases in perceived performance on 19 of 27 democratic principles. The points in the graph show the increase in the proportion of respondents who rated each standard as “mostly” or “fully” met (as opposed to “partially” or “not at all” met). The line through each point represents the 95-percent confidence interval.
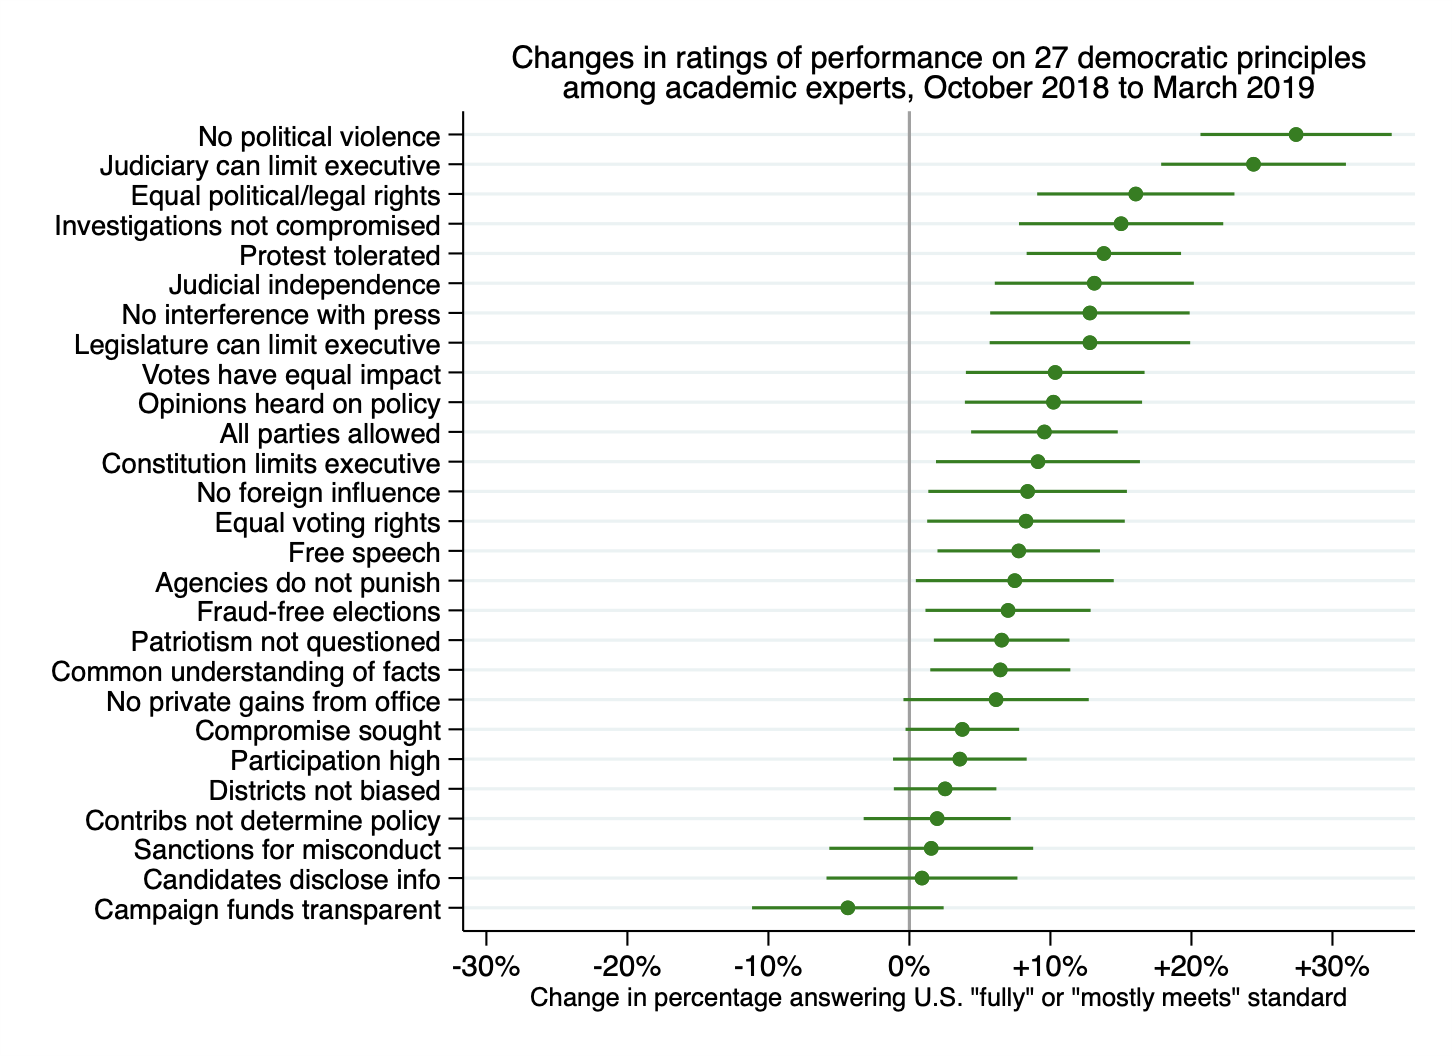
These gains were led by belief in a lack of political violence and judicial checks on the executive (discussed further below), but are too broad to be attributable to any single event or factor. They instead likely reflect the pre-Mueller report environment in which there appeared to be legal and political checks on President Trump, including the results of the 2018 election and ongoing investigations into the administration and the President’s associates by law enforcement officials and Congress.
As noted above, however, the improvement we observe only returns us to the levels of democratic performance observed in 2017. The figure below demonstrates that March 2019 expert ratings are largely indistinguishable from those measured in our September 2017 survey.
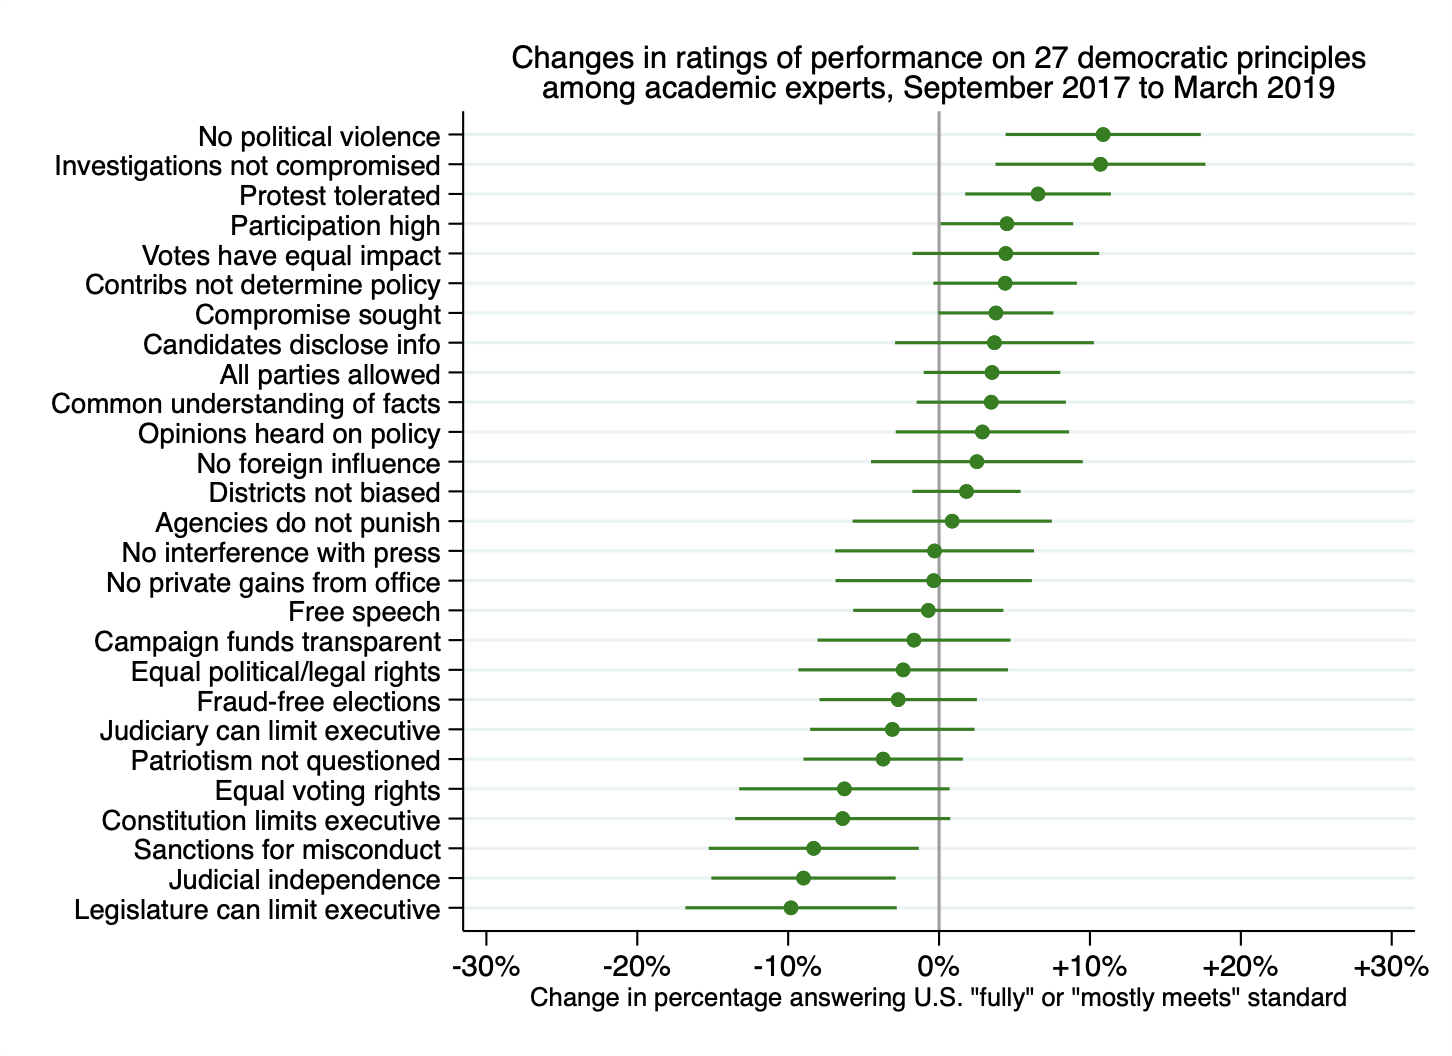
Compared to September 2017, experts rated U.S. democracy better in March 2019 on lack of political violence, independence of investigations of government officials, and toleration of protest, but worse on sanctions for misconduct, independence of the judiciary, and legislative checks on the executive. Performance on other principles was not measurably different.
Turning now to the public, when the point of comparison is our October 2018 survey, we find a similar pattern of perceived improvement in democratic performance across a number of democratic principles.

We observe a statistically significant increase in perceived performance among the public on 13 of the 27 statements. By contrast, none shows a measurable decline.
The largest jumps in the public’s perceived performance are on the ability of the judiciary to check executive authority, protection against political violence from private actors, the right of all parties and candidates to compete regardless of political ideology, and the independence of investigations of public officials from political interference. On political violence, the improvement is a recovery from the prior survey. In October 2018, the Tree of Life synagogue attack in Pittsburgh and effort to send pipe bombs to Democratic politicians commanded headlines while our survey was in the field. The sharp improvement on this item by March 2019 is an artifact of that prior dip.
We believe the other improvements were driven by political developments in early spring. For instance, the improvement in perceptions that the judiciary can limit the executive may have reflected the indictments and/or sentencing of Trump’s closest associates, such as Paul Manafort, Roger Stone, and Michael Cohen. The increase in perceptions that “Parties and candidates are not barred due to their political beliefs and ideologies” may reflect the rise to prominence since the 2018 midterm election of politicians like Alexandria Ocasio-Cortez and Ilhan Omar, as well as the early fundraising successes of presidential candidate Bernie Sanders, all of who proclaim themselves to be “democratic socialists.” With regard to the improvement on “Law enforcement investigations of public officials or their associates are free from political influence or interference,” the survey was completed just before the report of Special Prosecutor Robert Mueller was delivered to Attorney General William Barr in March 2019. At that time, perceptions of the investigation’s integrity were at a peak. Events since late March, including Barr’s initial summary of the report and subsequent battles with Democrats in Congress over his impartiality and commitment to rule of law, will undoubtedly diminish future ratings.
Disparate assessments across the Trump divide
Respondent ratings on most democratic principles diverge sharply between respondents who approve, and those who disapprove, of President Trump. Figure A3 in the appendix illustrates that, consistent with previous surveys, approvers continue to rate performance higher than disapprovers on almost all dimensions. Most noteworthy from the current survey is the narrowing of that gap as the president’s critics perceive improvements across most items in our battery. As the figure below illustrates, Americans who disapprove of Trump perceived significant improvement on numerous democratic principles.
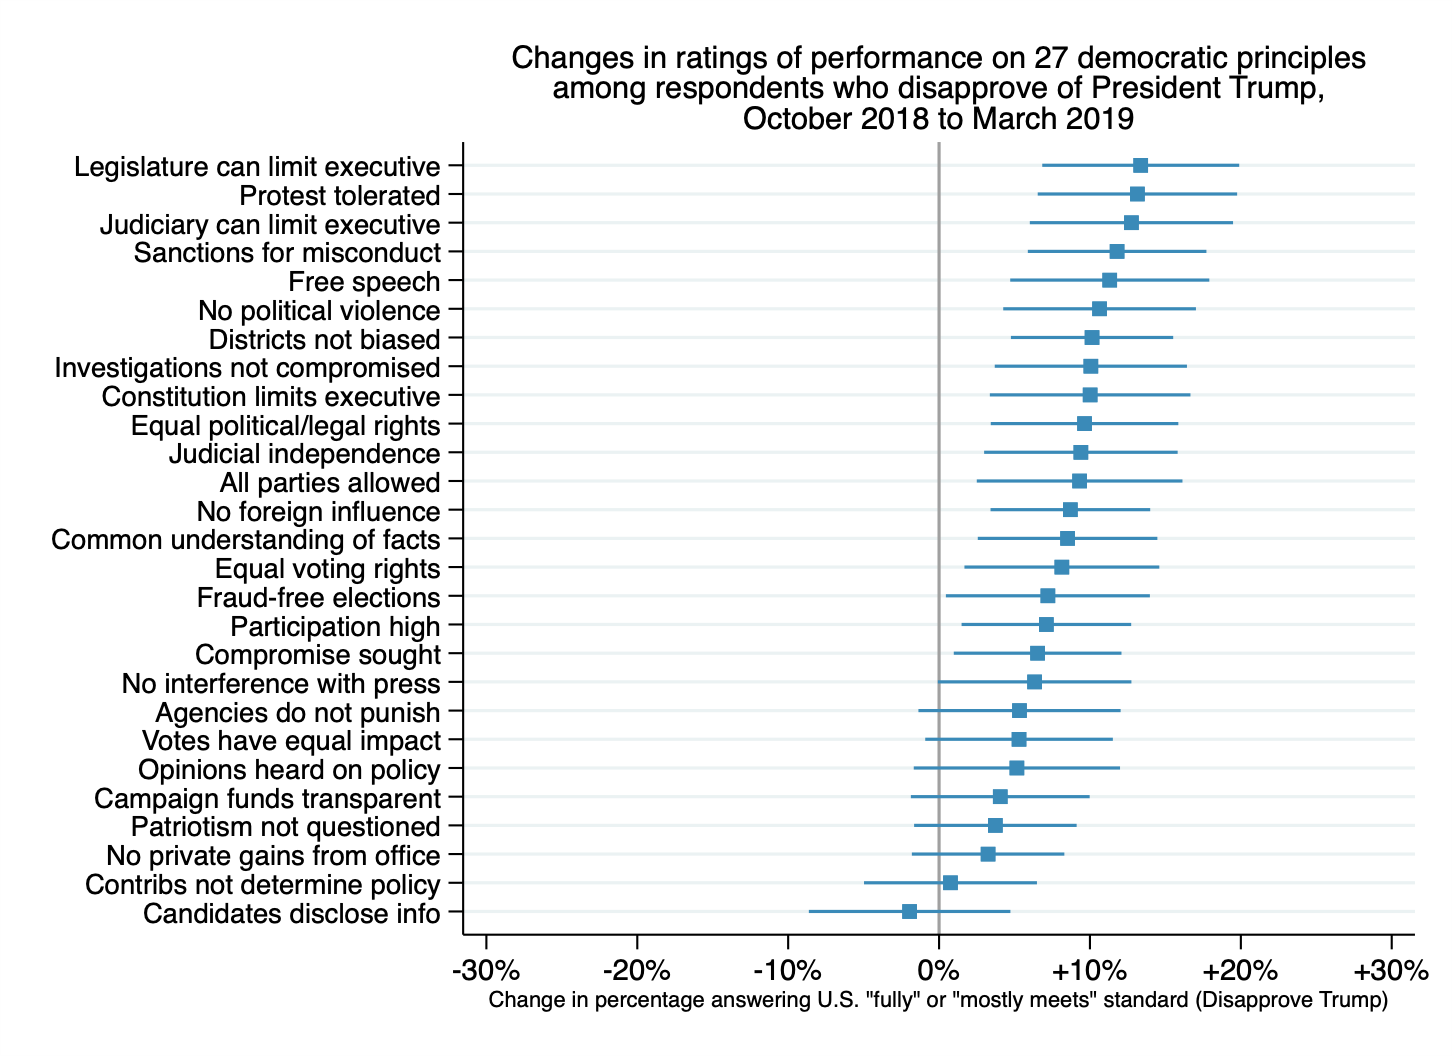
For this subset of respondents, 18 of 27 democratic principles show statistically significant improvements from October 2018 to March 2019. We observe the single biggest gain for Congress’s effectiveness in checking executive power, which likely reflected Democrats winning a majority in the U.S. House of Representatives in the 2018 midterm elections. (We again note, however, that our surveys were fielded prior to the release of the Muller report and thus pre-date the administration’s current obstruction of congressional oversight.) This same group shows similarly increased optimism in the judiciary’s ability to limit the executive and that government officials will be legally sanctioned for misconduct, which may reflect confidence in the oversight capacity of the newly Democrat-controlled House and/or the legal proceedings in which many Trump associates are currently enmeshed.[2]
In contrast to the surge in democratic optimism among Trump opponents, the president’s supporters remained unmoved over the past half year, exhibiting a statistically discernible change on only one of our 27 principles — a slight decline on protections for free speech.[3] In short, the improved estimates of the performance of U.S. democracy between the fall of 2018 and spring of 2019 are driven by buoyancy among those who disapprove of President Trump that is not shared with the president’s supporters.
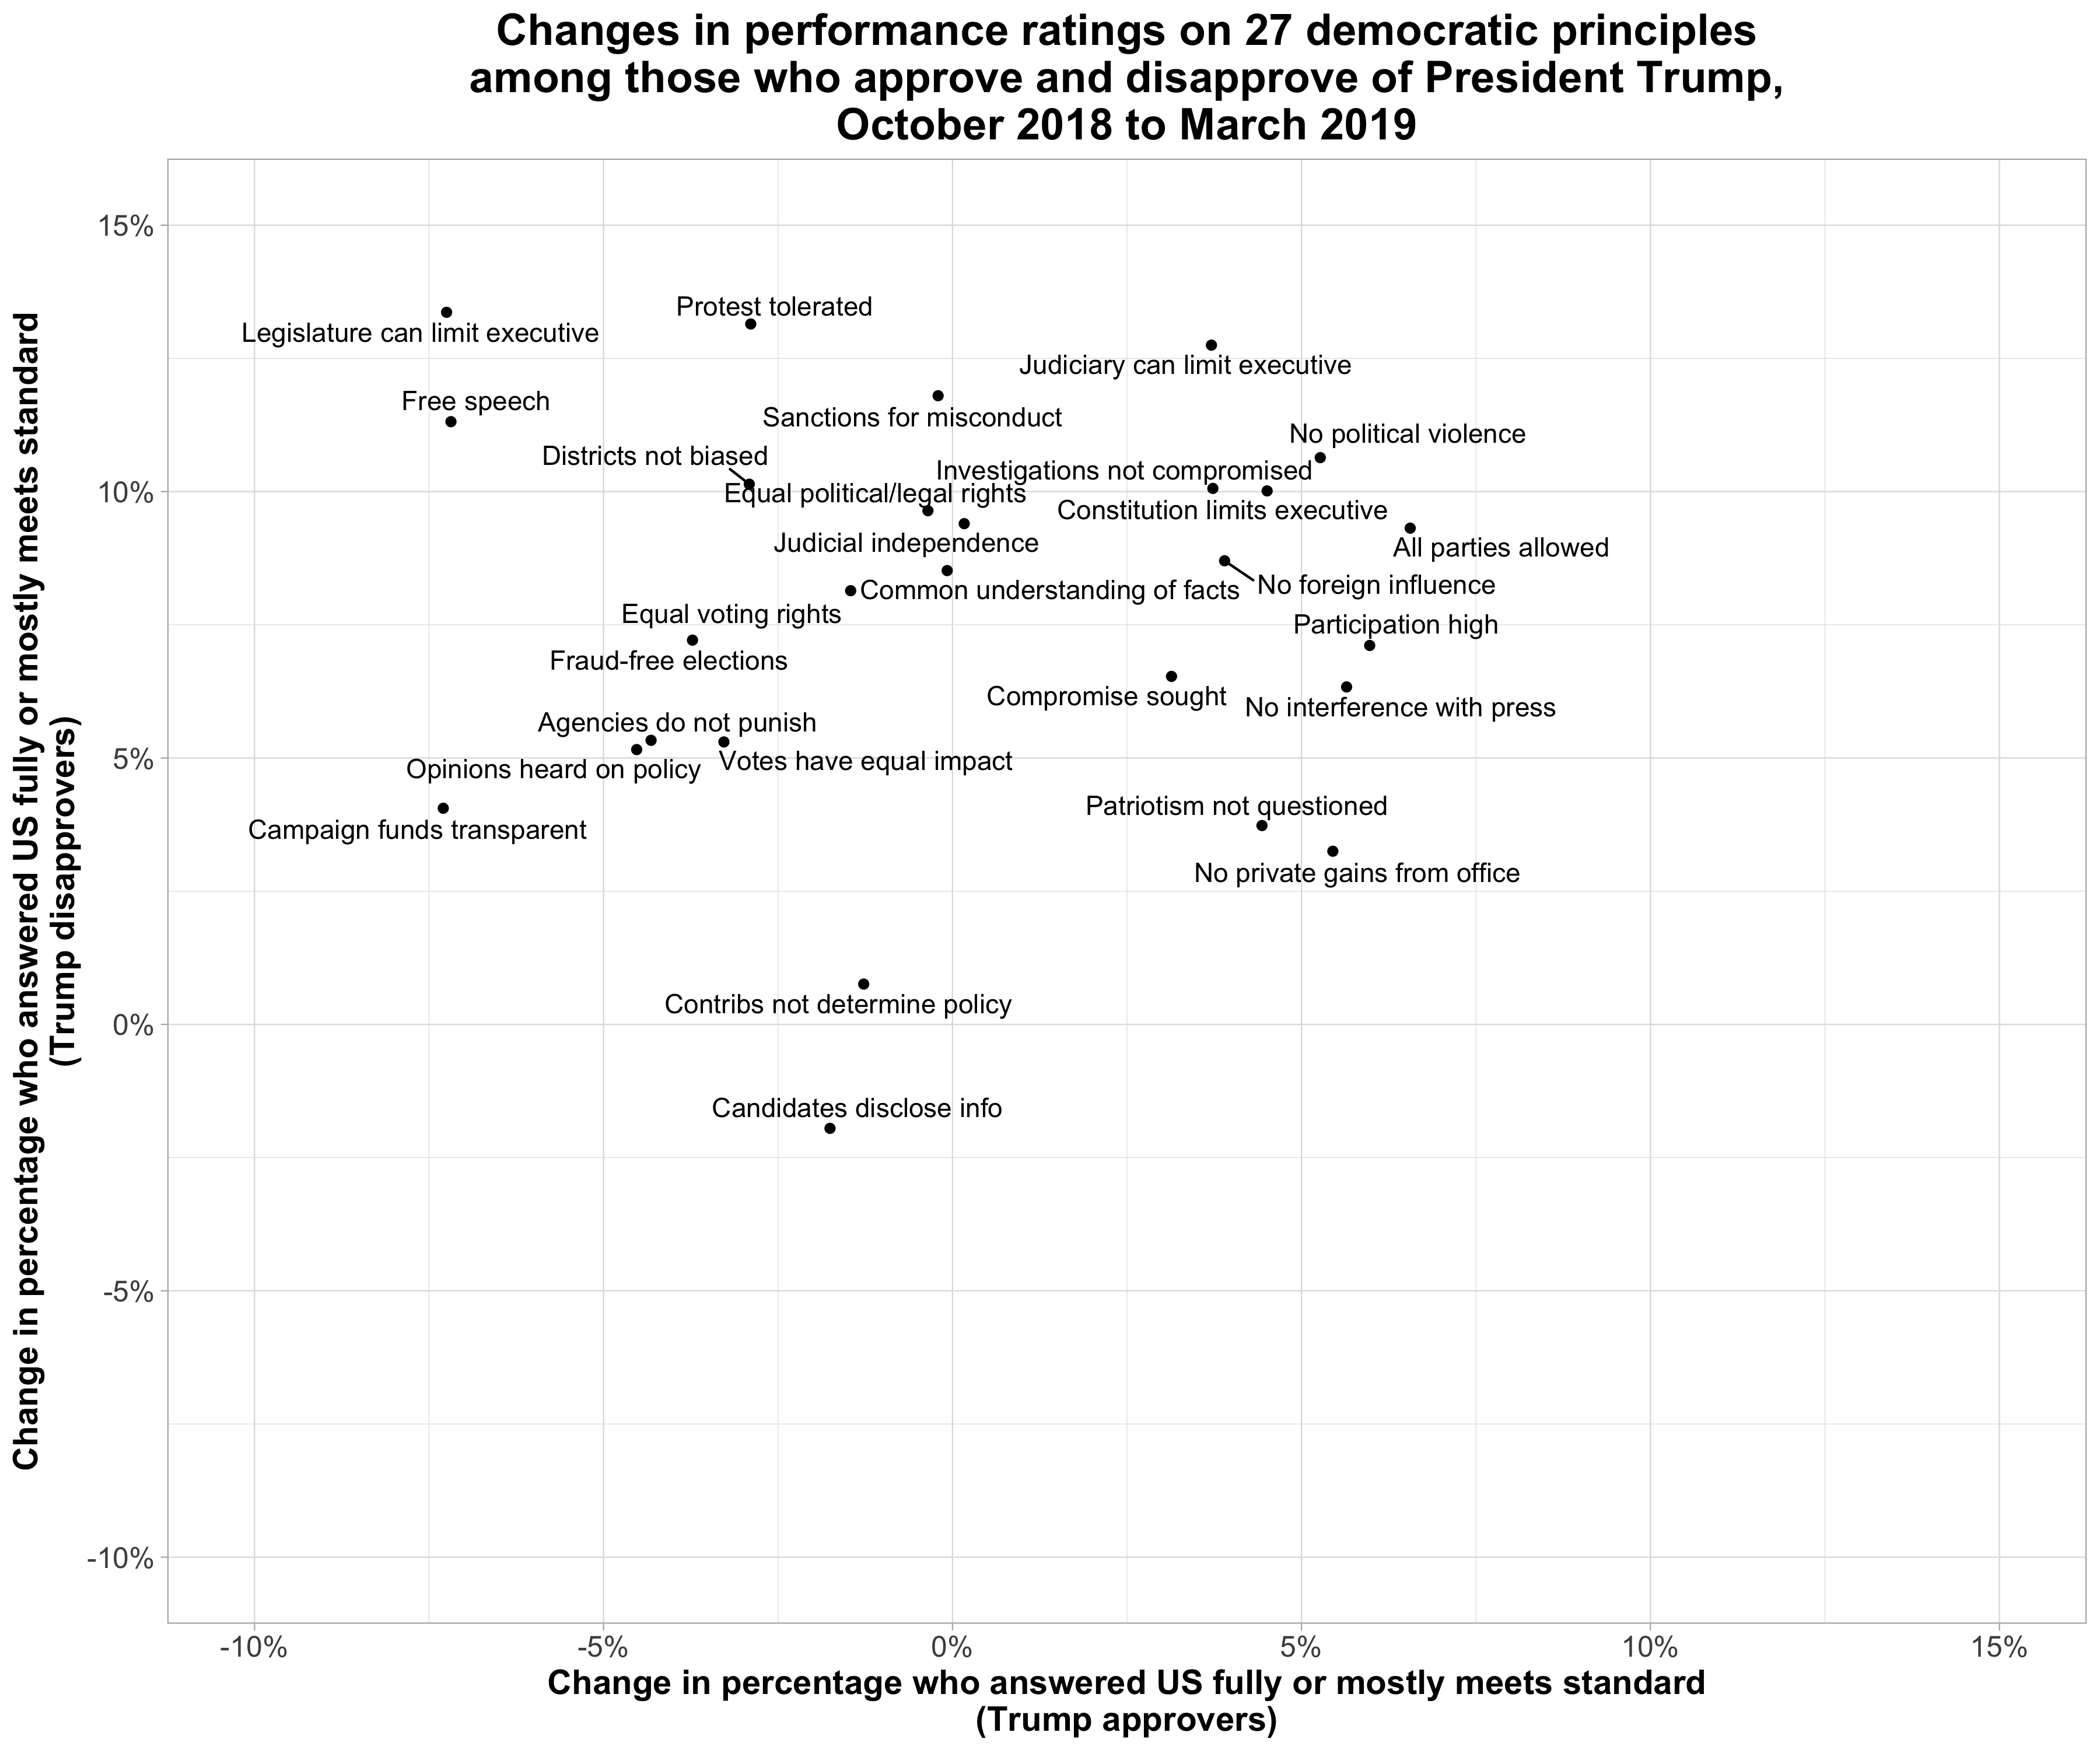
The disconnect in how these groups perceive politics is underscored by the fact that there is virtually no correlation in how these groups rated changes on individual democratic principles during the past half year.[4] In fact, on three items where Trump opponents saw the biggest improvements — legislative checks on the executive, toleration of political protest, and free speech — the president’s supporters regarded performance as deteriorating. Perceptions of whether performance is improving or degrading are thus generally unrelated across the Trump divide.
Democracy in the states
Our March survey of academic experts also included a state democracy module cosponsored by the Center for Local, State, and Urban Policy at the University of Michigan’s Gerald R. Ford School for Public Policy. The module asked expert respondents to rate the quality of democracy in their state. We received 713 responses. The figure below shows the mean democracy rating by state for the 47 states from which we received responses as well as the District of Columbia. As a point of reference, the graph also includes respondents’ mean rating for the quality of U.S. democracy overall.[5]
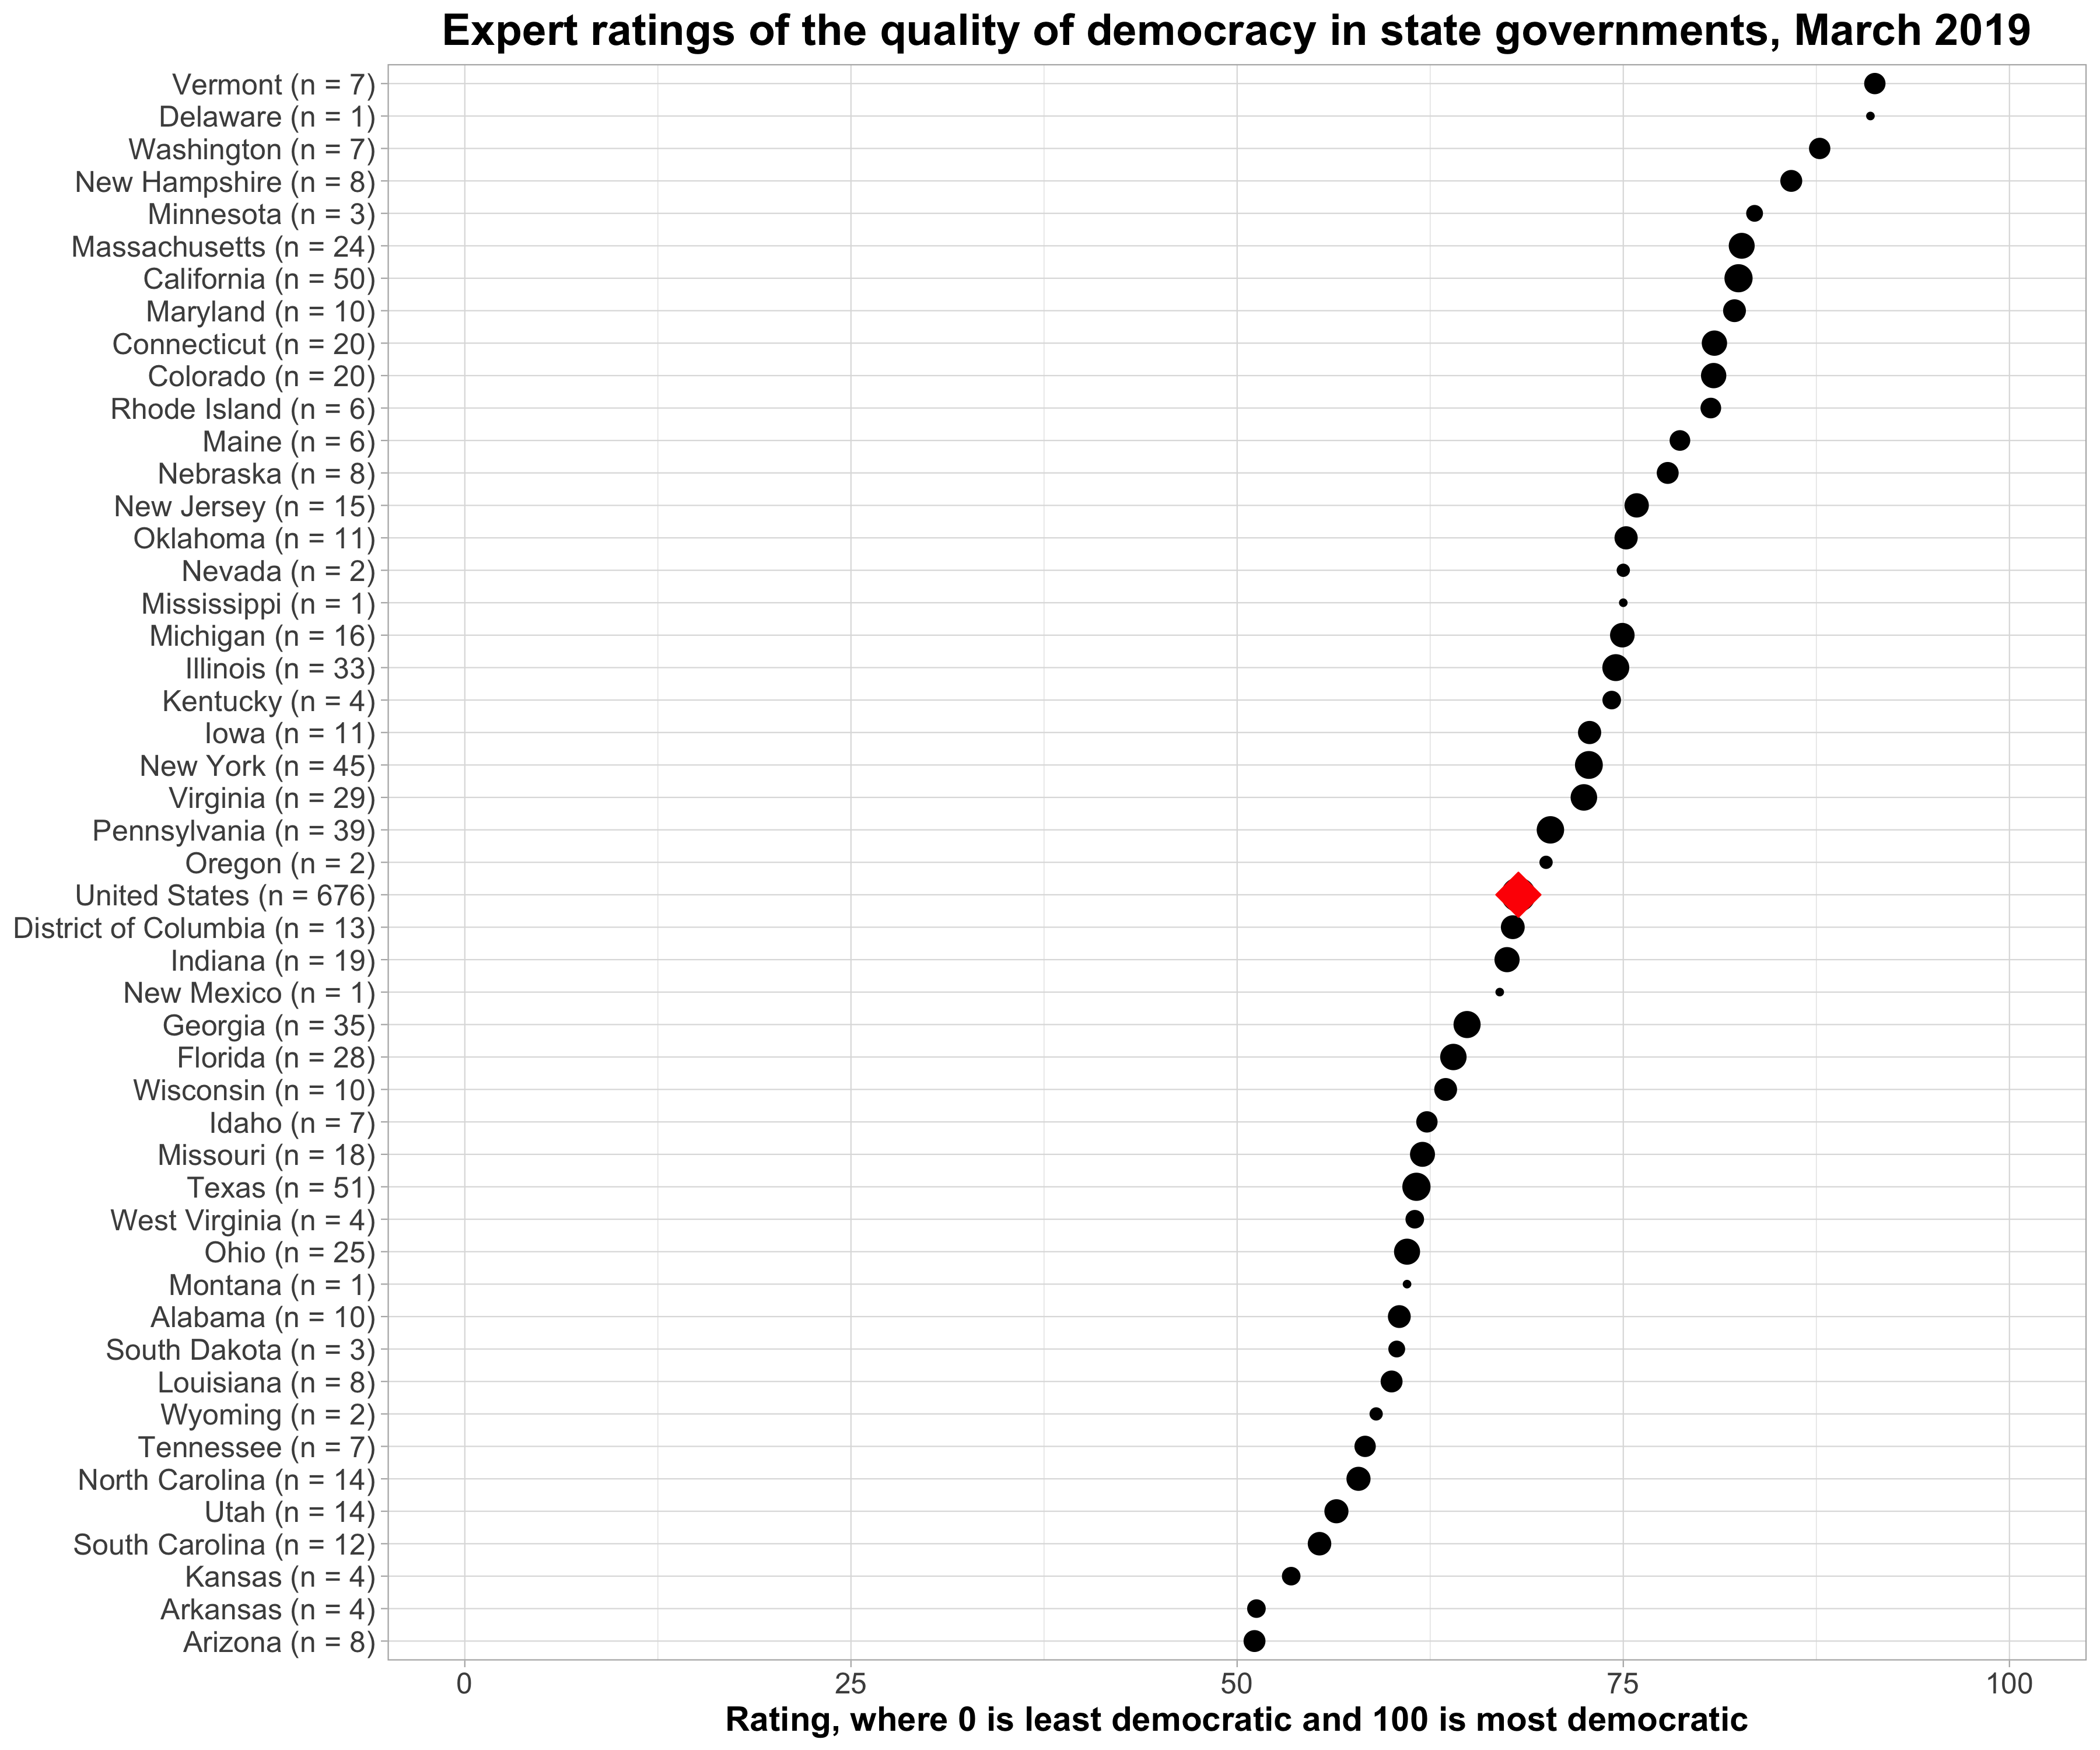
We first note the existence of substantial variation in our expert respondents’ assessments of democratic quality at the state level — mean values range from the 51 to 91 on a 100-point scale. It is also striking that the state-level estimates are almost equally distributed around the overall rating for U.S. democracy, with 25 states rated above the U.S. mean value of 68, and 22 states and the District of Columbia rated lower.
The states ranked highest tend to cluster in the Northeast, particularly in New England (for example, Vermont, New Hampshire, Connecticut, Massachusetts) and on the West Coast (for example, California and Washington). By contrast, many of those ranked lowest are in the South (Arkansas, North Carolina, South Carolina, Tennessee, and Texas) and Mountain West (Utah and Arizona).[6]
Events
As in recent surveys, we also asked experts to rate how (ab)normal and (un)important recent political events were, seeking to distinguish events that are truly abnormal and important from those that are important but normal or abnormal but unimportant. The graph below plots the results for the set of events we asked about, which were identified using news coverage, timelines of events during the Trump administration, and events from The Atlantic’s set of “Donald Trump’s 50 Most Unthinkable Moments” that we had not previously asked experts to rate.
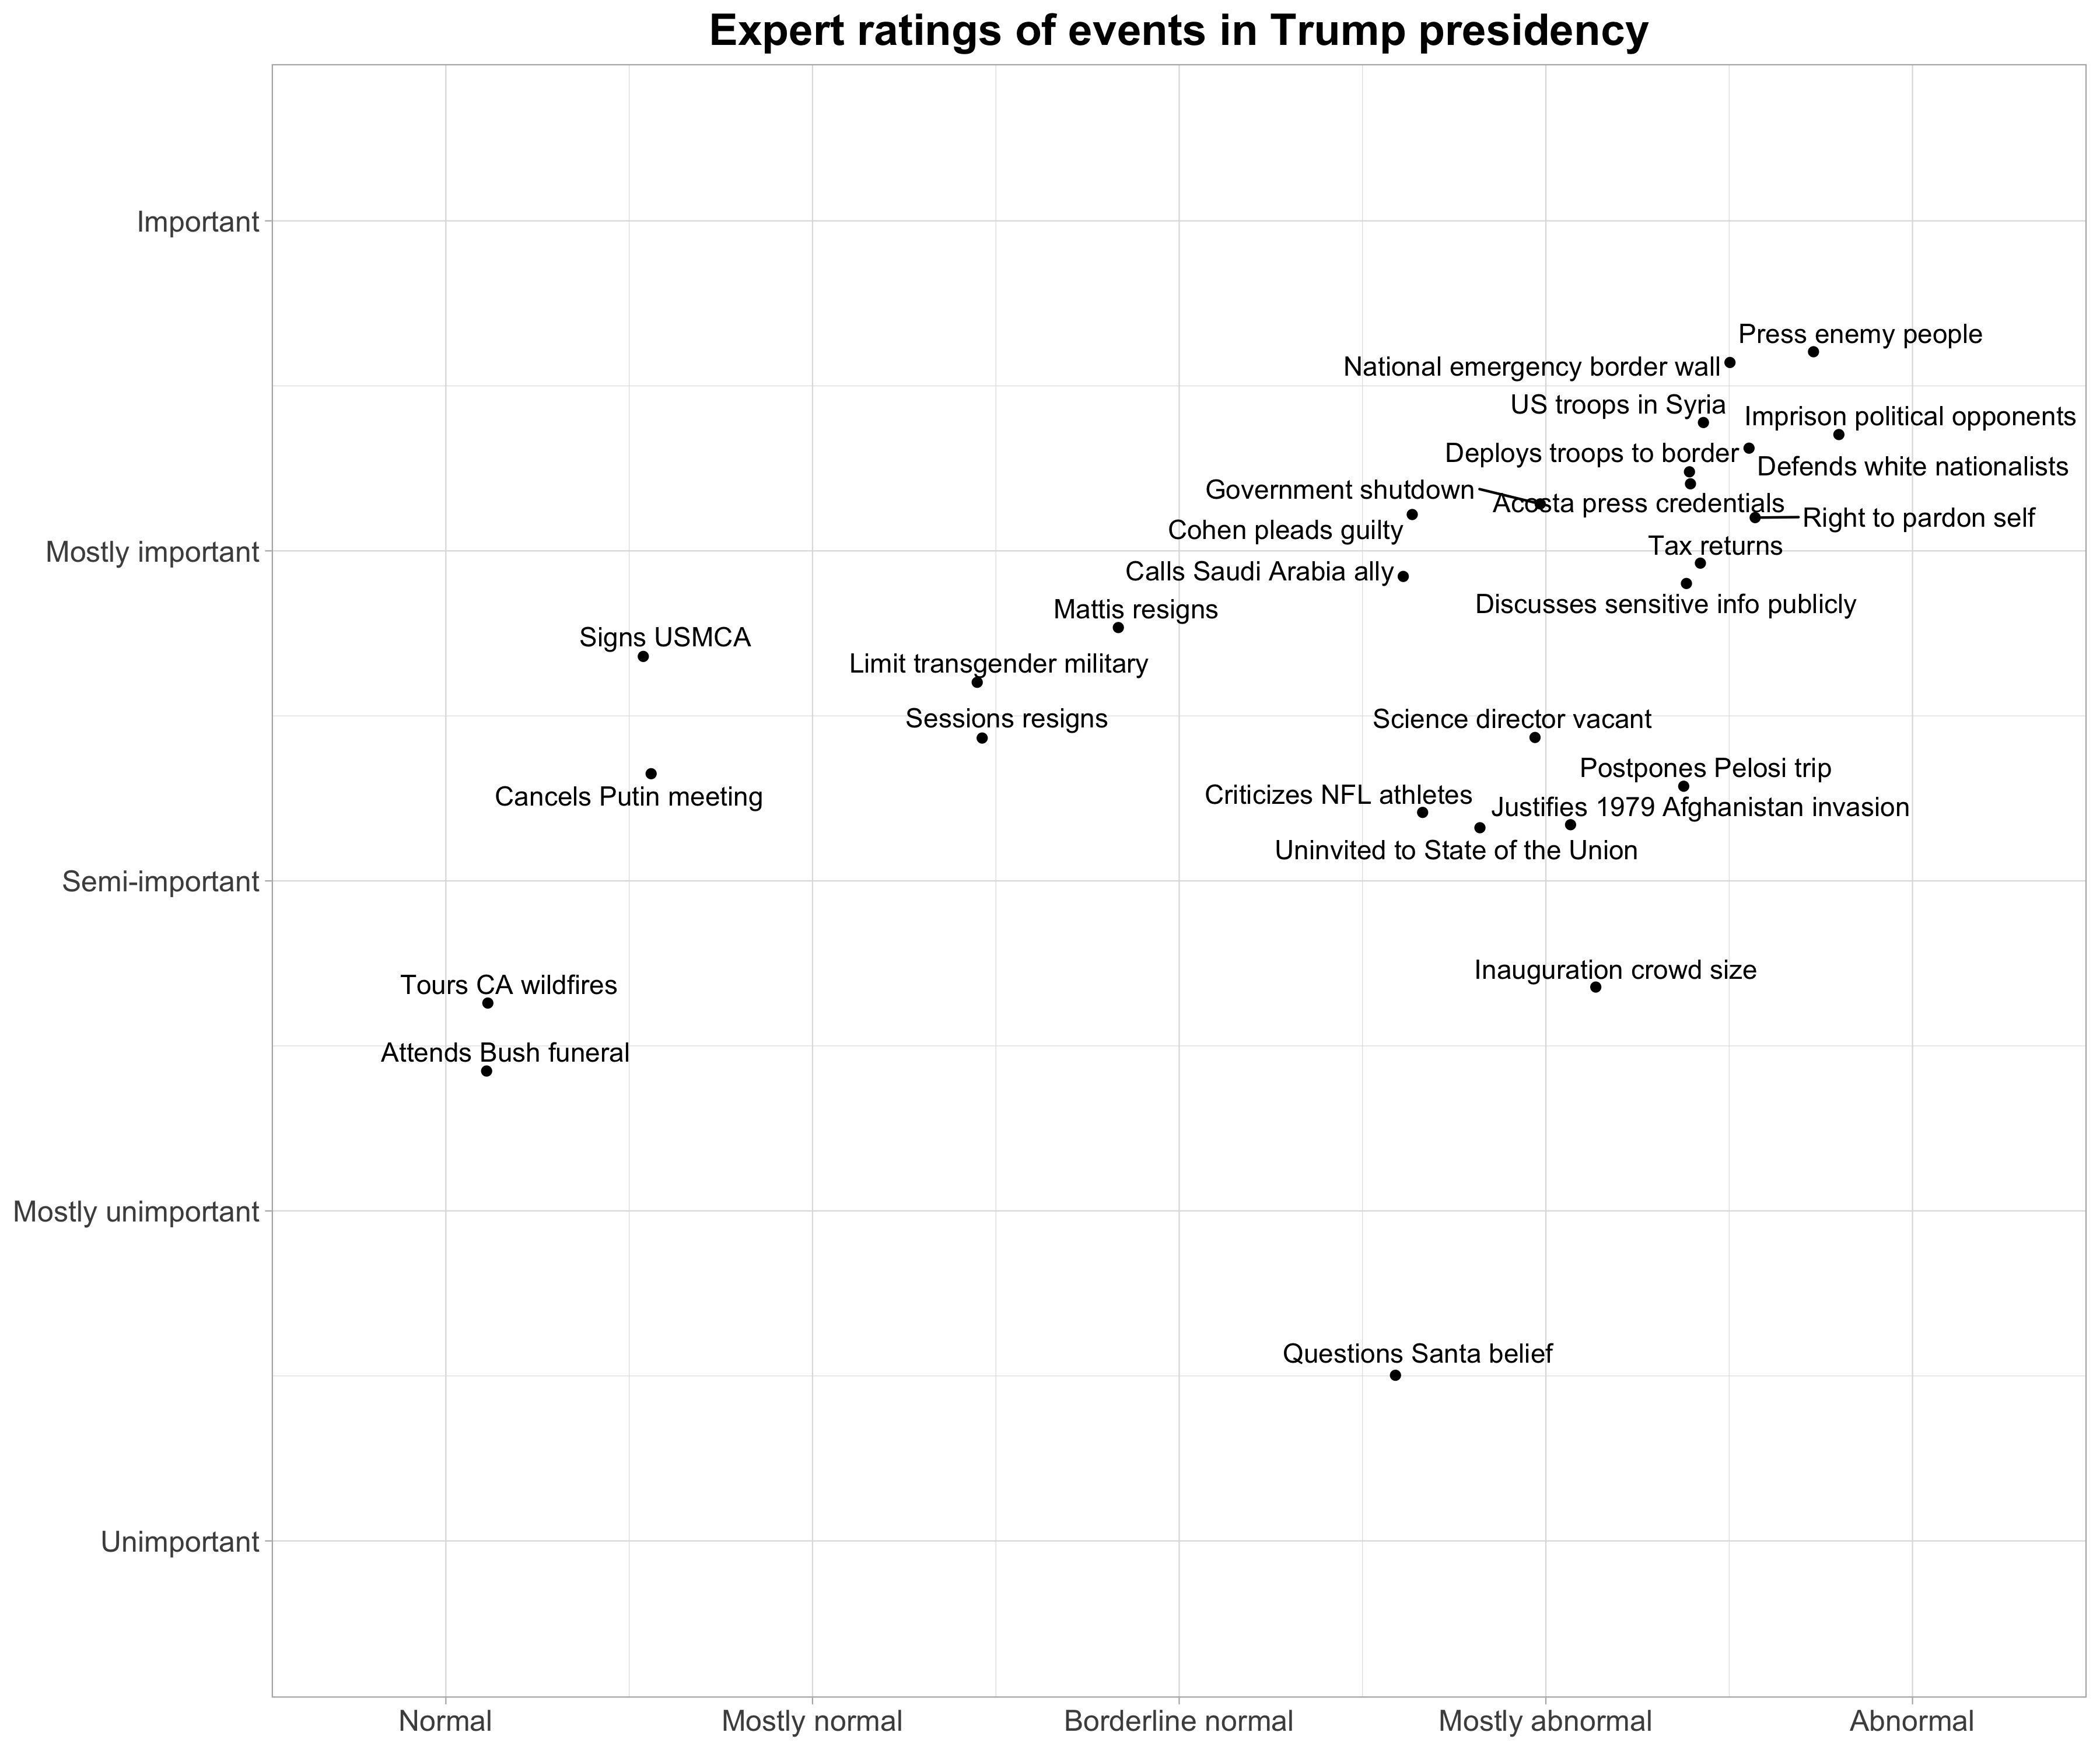
In general, events that were rated by our experts as important were also rated as more abnormal. Many of Trump’s most prominent actions and positions were specifically identified as abnormal and important, including the following:
- Calling the press an “enemy of the people”
- Declaring a national emergency to fund his border wall
- Calling for political opponents to be imprisoned for treason
- Announcing that US troops will be removed from Syria without consulting his aides
- Deploying troops to the southern US border as midterm elections approached
- Defending white nationalists protesting in Charlottesville
- Trying to revoke Jim Acosta’s press credentials
- Tweeting that he has the “absolute right to pardon himself”
- Refusing to release his tax returns
- Discussing sensitive papers at Mar-a-Lago
Exceptions exist, however. Experts rated Trump questioning a seven-year-old’s belief in Santa during the Christmas 2018 season and his claims about the size of the crowds at his inaugural as abnormal but not particularly important. In addition, other events were rated as normal, including those that were rated as important (signing the USMCA trade deal that revises NAFTA) and unimportant (attending George H.W. Bush’s funeral).
Looking ahead
With concerns about the rule of law and threats to democracy growing in the wake of the Mueller report, it is important to measure where public and expert opinion stood at the beginning of the period of divided government under President Trump. Assessments of democratic performance in the United States improved between October 2018 and March 2019 among both academic experts and the public. However, the gains we identified in the brief interregnum between the 2018 midterms and the Mueller report should not be interpreted to mean that American democracy is back on track. First, evaluations of democracy generally declined in previous surveys; the increase observed in March 2019 only returned us to levels observed in 2017 (a period that experts rate as worse than 2015). Second, consistent with our previous surveys, deep polarization over the state of our democracy persists. The overall increase in the quality of democracy we detected in early spring masks sustained differences in perceptions between supporters and opponents of President Trump. Such divides threaten to undermine the potential for public consensus about threat to democracy, a key factor securing political accountability and the rule of law. Finally, the delivery of the Mueller report and subsequent clashes over its interpretation and impact are likely to reduce the levels of optimism we observed among respondents before the report was released. With battles looming over presidential oversight (possibly including impeachment) and concerns already appearing about Trump’s willingness to accept an unfavorable election outcome in 2020, the recent upturn in perceived democratic performance may be poised for reversal.
Appendix
Figure A1
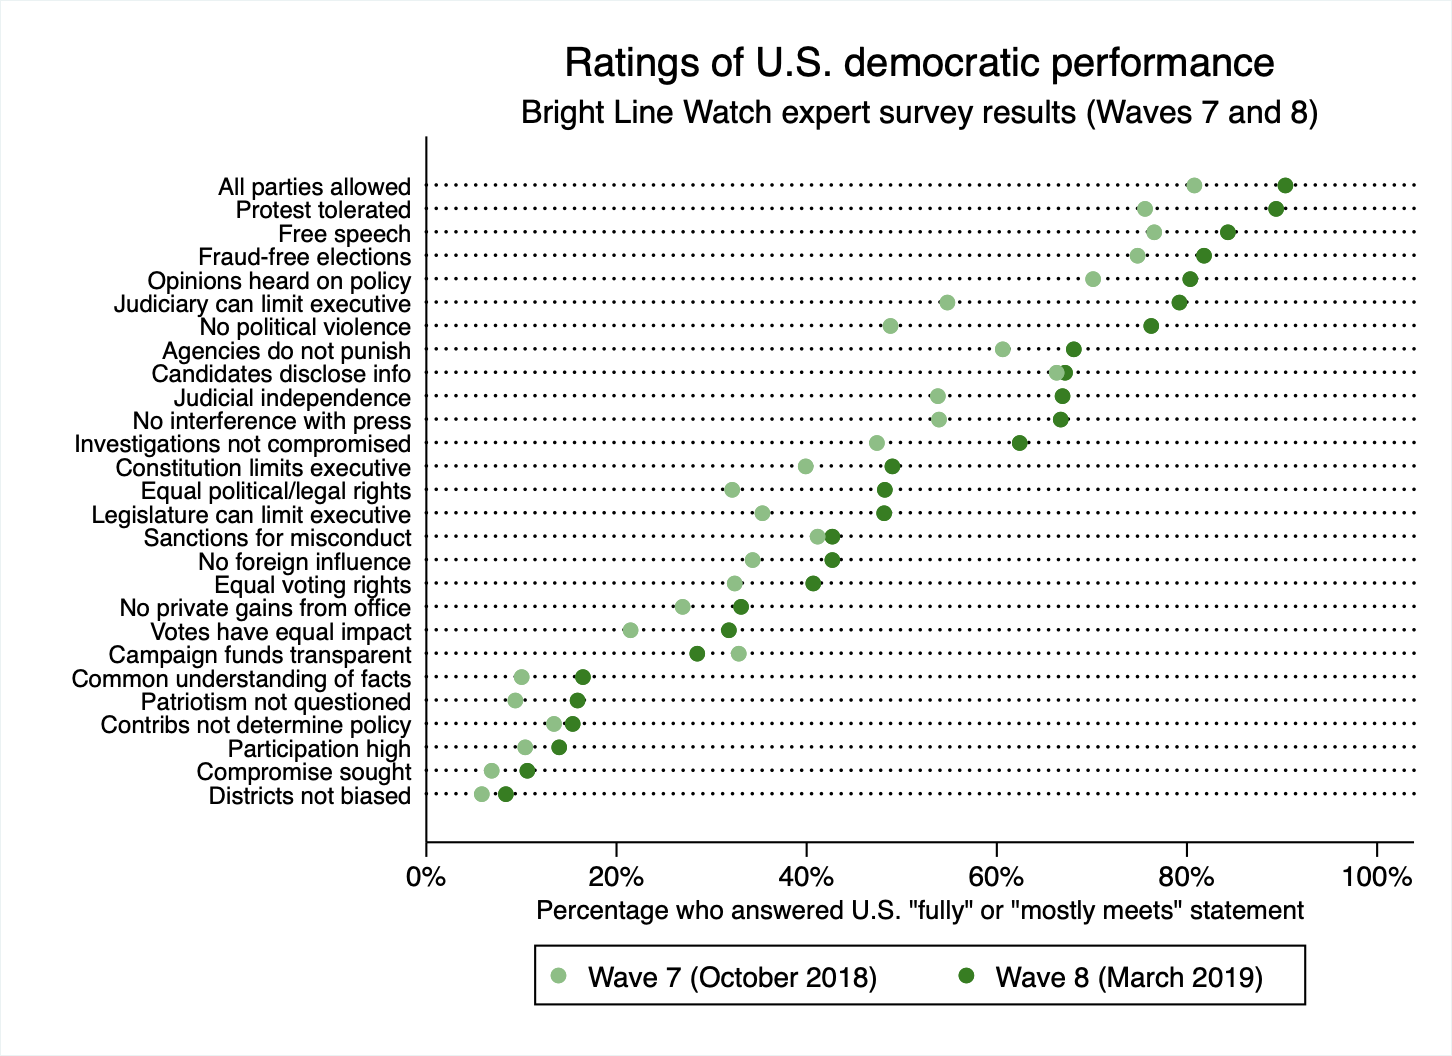
Figure A2
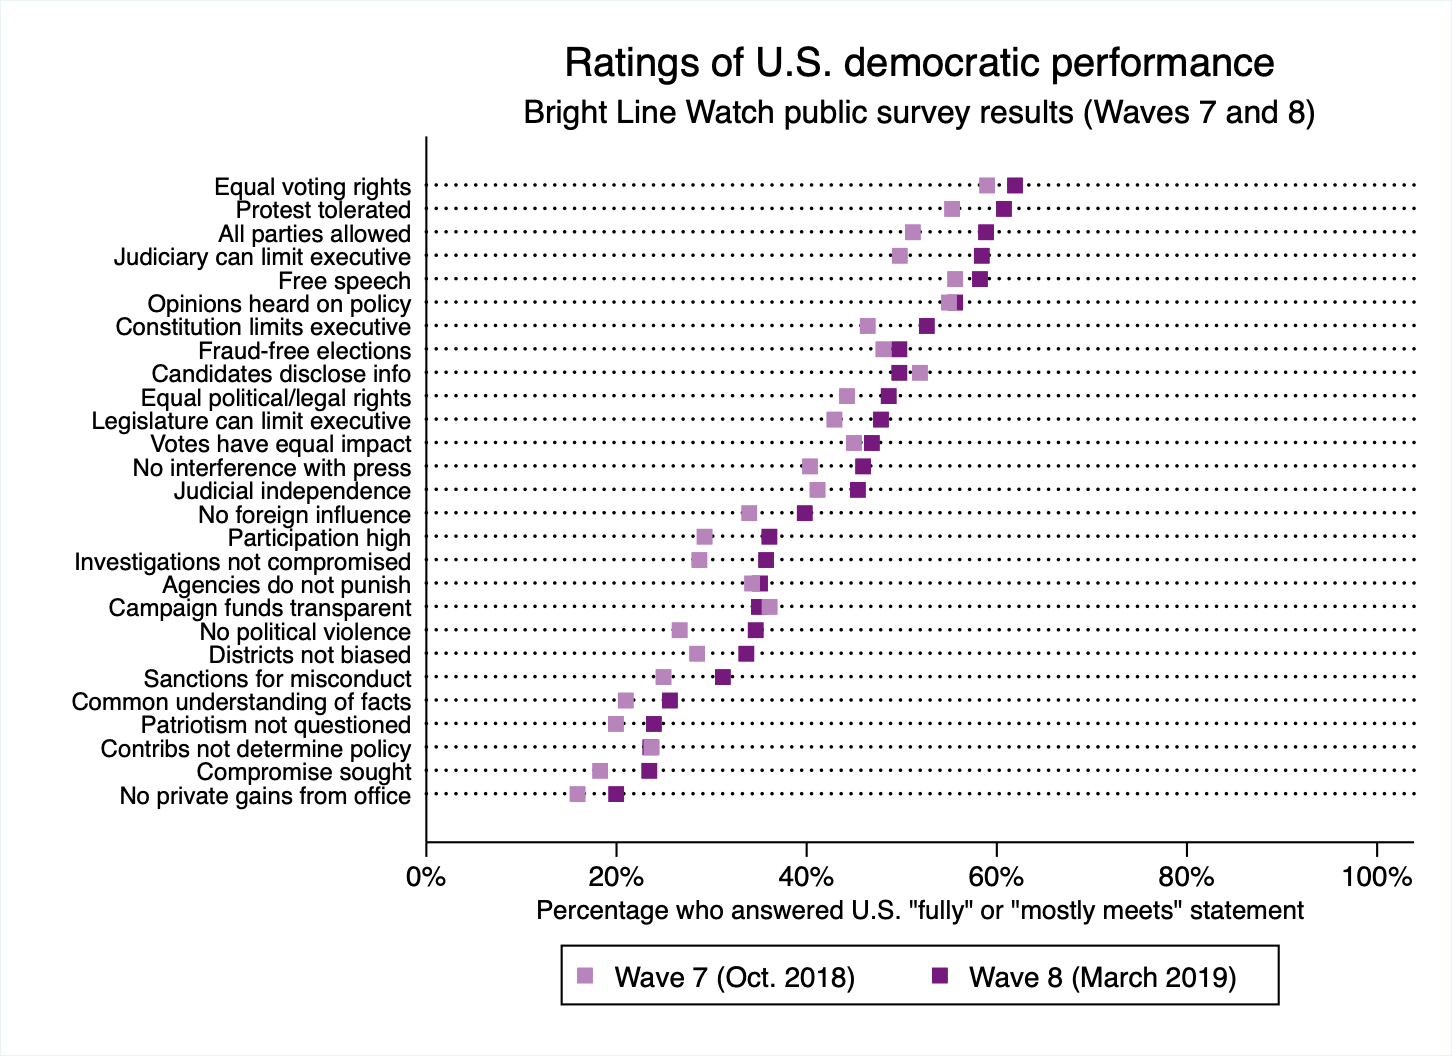
Figure A3

Figure A4
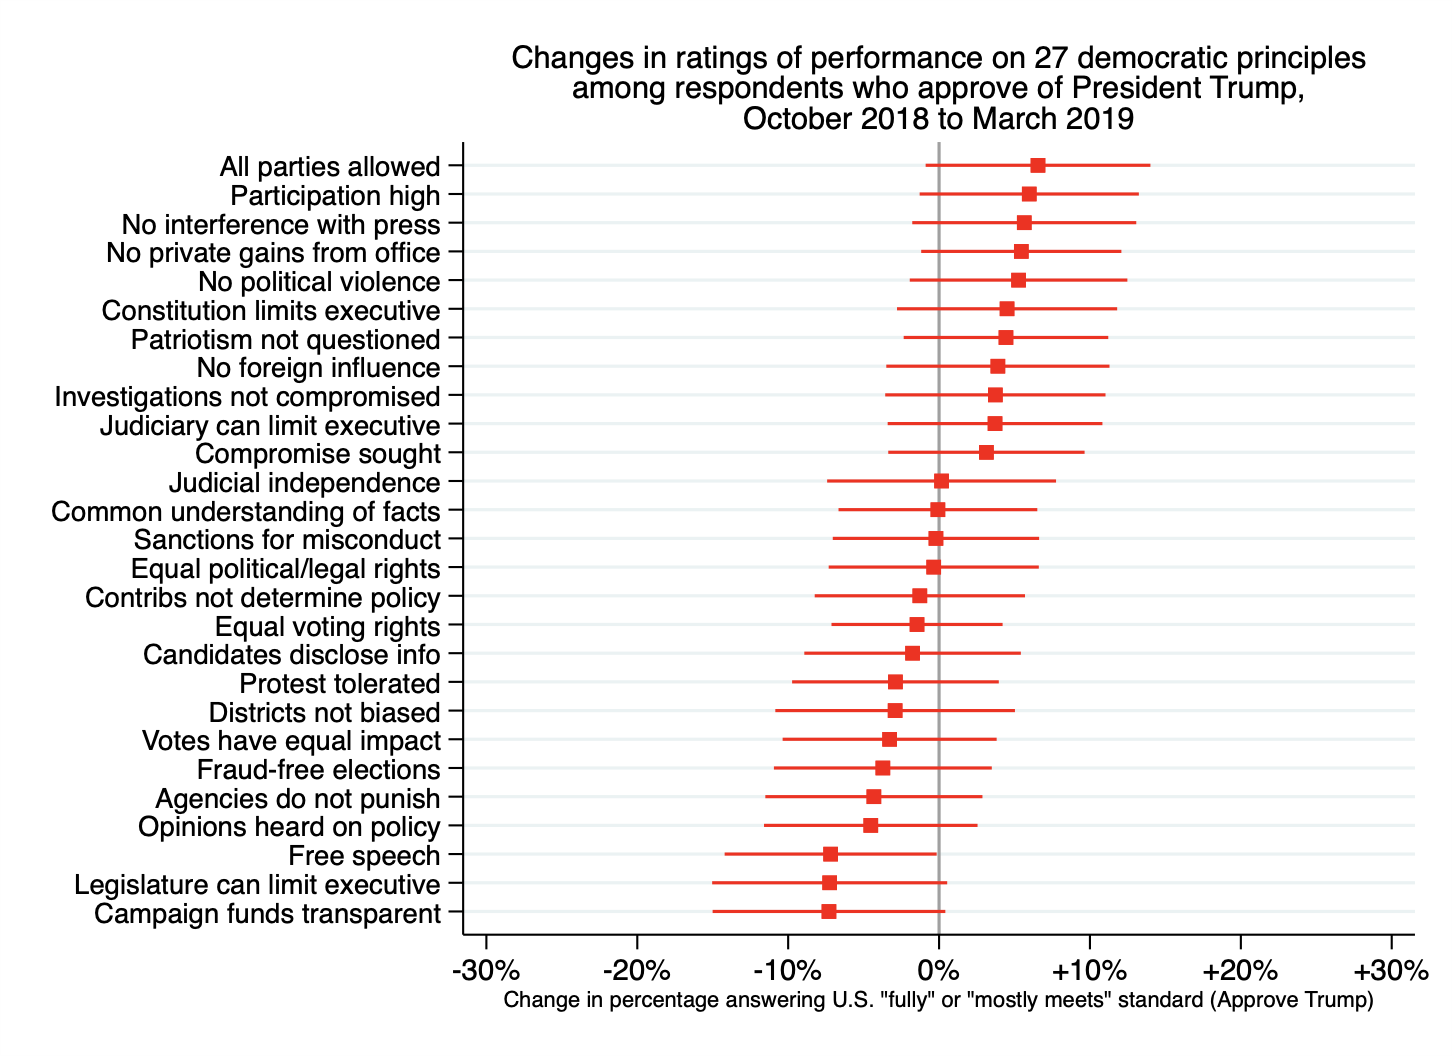
Figure A5
Bright Line Watch surveys on the state of America’s democracy, March 2019
From March 12–26, 2019, Bright Line Watch conducted its eighth survey on the state of democracy in the United States. We conducted previous surveys in February (Wave 1), May (Wave 2), and September (Wave 3) of 2017, and in January (Wave 4), April (Wave 5), July (Wave 6), and October (Wave 7) of 2018. Waves 1 and 2 targeted expert respondents only. Waves 3–8 have paired the expert survey with a representative survey of the American public. Details on the Wave 8 survey are provided below:
Expert: Between March 12, 2019 and March 21, 2019, we sent an email invitation and two reminders to 10,992 political science faculty at universities in the United States. By March 26, 2019 our sampling process had yielded 677 complete responses, for a response rate of 6.2%.
Public: YouGov fielded the public survey from March 12–18, 2019, producing 2,000 complete responses.
Both the expert and public samples in Wave 8 responded to a battery of questions about democratic performance in the United States. Afterward, they were asked to evaluate the quality of American democracy overall on a 100-point scale. Experts were also asked to evaluate the quality of democracy in their state, on the same 0–100 scale.
Expert respondents were then asked to respond to a second battery in which they were presented with a series of statements about current political events and asked to rate them on normalcy and importance. Both the performance battery and the (ab)normality and (un)importance battery are described in more detail above.
The data from both the expert and public surveys are available here. All analyses of the public data from YouGov incorporate survey weights.
Performance battery
The foundation of Bright Line Watch’s surveys is a list of 27 statements expressing a range of democratic principles. Democracy is a multidimensional concept. Our goal is to provide a detailed set of measures of democratic values and of the quality of American democracy. We are also interested in the resilience of democracy and the nature of potential threats it faces. Based on the experiences of other countries that have experienced democratic setbacks, we recognize that democratic erosion is not necessarily an across-the-board phenomenon. Some facets of democracy may be undermined first while others remain intact, at least initially. The range of principles that we measure allows us to focus attention on variation in specific institutions and practices that, in combination, shape the overall performance of our democracy.
Bright Line Watch’s Wave 1 survey included 19 statements of democratic principles. Based on feedback from respondents and consultation with colleagues, we expanded that list to 29 statements in Wave 2. We then reduced that set to what we intend to be a stable set of 27 statements for the Wave 3 through Wave 8 surveys. 17 of those 27 statements were included in Wave 1, and all 27 were included in Wave 2.
The full set of statements is presented below and grouped thematically for clarity. In the surveys, the principles were not categorized or labeled. Each respondent was shown a randomly selected subset of 14 statements and asked to first rate the importance of those statements and then rate the performance of the United States on those dimensions.
27 statements of democratic principles
Elections
- Elections are conducted, ballots counted, and winners determined without pervasive fraud or manipulation
- Citizens have access to information about candidates that is relevant to how they would govern
- The geographic boundaries of electoral districts do not systematically advantage any particular political party
- Information about the sources of campaign funding is available to the public
- Public policy is not determined by large campaign contributions
- Elections are free from foreign influence
Voting
- All adult citizens have equal opportunity to vote
- All votes have equal impact on election outcomes
- Voter participation in elections is generally high
Rights
- All adult citizens enjoy the same legal and political rights
- Parties and candidates are not barred due to their political beliefs and ideologies
- Government protects individuals’ right to engage in unpopular speech or expression
- Government protects individuals’ right to engage in peaceful protest
- Citizens can make their opinions heard in open debate about policies that are under consideration
Protections
- Government does not interfere with journalists or news organizations
- Government effectively prevents private actors from engaging in politically-motivated violence or intimidation
- Government agencies are not used to monitor, attack, or punish political opponents
Accountability
- Government officials are legally sanctioned for misconduct
- Government officials do not use public office for private gain
- Law enforcement investigations of public officials or their associates are free from political influence or interference
Institutions
- Executive authority cannot be expanded beyond constitutional limits
- The legislature is able to effectively limit executive power
- The judiciary is able to effectively limit executive power
- The elected branches respect judicial independence
Discourse
- Even when there are disagreements about ideology or policy, political leaders generally share a common understanding of relevant facts
- Elected officials seek compromise with political opponents
- Political competition occurs without criticism of opponents’ loyalty or patriotism
To measure perceived democratic performance, the survey asked, “How well do the following statements describe the United States as of today?” Each respondent was then presented with 14 statements of principle, randomly drawn from the set above, and offered the following response options:
The U.S. does not meet this standard
The U.S. partly meets this standard
The U.S. mostly meets this standard
The U.S. fully meets this standard
Not sure
The order in which statements were presented in the battery was randomized for each respondent so there should be no priming or ordering effects in how they were assessed.
Notes
[1] The first survey of academic experts was in February 2017 and the first wave to include a representative public sample was in September 2017. Experts perceive an even greater decline over time. During a May 2017 survey, we asked the academic experts to rate the quality of U.S. democracy in past years. Experts retrospectively rated the U.S. at 76 in 2015, much higher than the 69 rating they provided in February 2017.
[2] We suspect the perceived increase in the rights of protest are the result of a dip during the previous survey, which was conducted in a period when the Trump administration had proposed regulations to limit the rights of protesters near the White House and conservative media outlets were tarring political protesters with the meme “Jobs not mobs.”
[3] Figure A4 in the appendix shows that Trump supporters registered declines on 15 items and improvements on 12 from October 2018 to March 2019. Across 27 items, it is not surprising to find one on which the change falls outside the 95% confidence interval even if there is no systematic pattern to the results.
[4] The correlation coefficient is 0.007; see Figure A5 in the appendix for a visualization.
[5] The marker sizes correspond to a log transformation of the number of responses from each unit of government to accommodate the wide range, and the skew, of values. We received no responses from experts in three states (Alaska, Hawaii, and North Dakota) and the next thirteen states with the fewest responses returned just 32 responses among them. Our estimates for many smaller states are thus imprecise and should be interpreted cautiously.
[6] We note that states where reforms to adopt ranked-choice voting (RCV) have flourished in recent in recent years tend to rate high on democratic quality. The one state that has adopted RCV for all statewide offices, Maine, ranks 12th, whereas other states where RCV had been adopted at the municipal level are ranked fifth, sixth, seventh, eighth, ninth, and 28th.