America Looks Ahead to a Second Trump Term
Bright Line Watch November 2024 survey
In November 2024, Donald Trump defeated Kamala Harris to win the presidency for the second time. In contrast to Trump’s previous campaigns, the election itself was relatively unremarkable. Unlike in 2016, when Trump won the presidency while losing the popular vote to Hillary Clinton, he prevailed this time both in vote share (50% to 48%) and in the Electoral College (312 to 226). Unlike in 2020, when Joe Biden’s win over Trump depended on victories in swing states that took days to call, Trump’s 2024 win was called not long after midnight on election night. Also unlike Trump in 2020, Harris quickly conceded defeat, enabling a peaceful transition of power.
Since the election, Trump has moved quickly to staff his second administration, naming controversial picks for some high-profile positions, including (initially) Congressman Matt Gaetz (R‑FL) for Attorney General, Robert F. Kennedy, Jr. for Secretary of Health and Human Services, Fox News personality Pete Hegseth for Defense Secretary, former Congresswoman Tulsi Gabbard (D‑HI) for Director of National Intelligence, and former National Security Council staffer Kash Patel for FBI Director.
In the aftermath of the election, we fielded parallel surveys of 539 political scientists and a representative sample of 2,750 Americans from November 13–27, 2024.
Our key findings are the following:
Public confidence in elections
-
Public faith in the integrity of American elections is higher than at any time since before the 2020 election. Confidence that votes are counted as intended at the local, state, and national levels is up overall.
-
This shift in election confidence was driven by the GOP. After Trump’s win, Republican beliefs about election integrity dramatically reversed from previous years, with confidence in the national vote soaring from 59% before the election to 90% afterward.
-
Americans are much more likely to recognize Trump’s victory in the 2024 election as legitimate (89%) than they were to recognize Biden’s victory in 2020 (65%). In particular, 83% of Democrats rate the 2024 outcome as legitimate versus 27% among Republicans in 2020.
-
Beliefs in the prevalence of election and voter fraud are down overall, with large decreases in perceptions of fraud among Republicans more than offsetting slight increases among Democrats.
Interpretations of Trump’s victory
-
Experts, Democrats, and Republicans agree that dissatisfaction with the economy was the most important factor contributing to Trump’s victory. Beyond those items, Republicans place greater weight on Trump’s appeal as a candidate and Democratic positions on identity policies, whereas Democrats were more likely to blame racial and gender discrimination against Harris and Biden’s late withdrawal from the campaign.
-
Both experts and the public are more likely to say that Trump should compromise with his opponents than that he has a mandate. Across issues, Trump’s strongest perceived mandate is on immigration policy, with high levels of agreement across partisan groups that his election indicates support for deporting undocumented immigrants.
Threats to democracy
-
Many experts view Trump’s nominees and associates such as Matt Gaetz (before withdrawing), Pete Hegseth, and Stephen Miller as threats to democracy.
-
Experts expect that Trump will pardon January 6 rioters and initiate investigations of Biden and leading Democrats — actions that Republicans say they support.
-
An examination of past expert forecasts shows that they tend to be too pessimistic except for the events rated as most likely to occur. However, aggregate forecasts are quite accurate when corrected for these tendencies.
Public confidence in elections
Four years of Republican doubts about election integrity seemingly vanished after Trump’s victory, driving a sharp rebound in electoral confidence in the American public.
We asked respondents to report their confidence that their own vote, votes in their state, and votes nationwide were counted as voters intended in the November election. We also asked people how confident they were that election administrators nationwide counted votes fairly and accurately in the presidential election and that everyone who was legally entitled to vote and sought to do so was able to cast a ballot. The figure below reports how many people said they were very or somewhat confident in each of these aspects of the 2024 election by party.
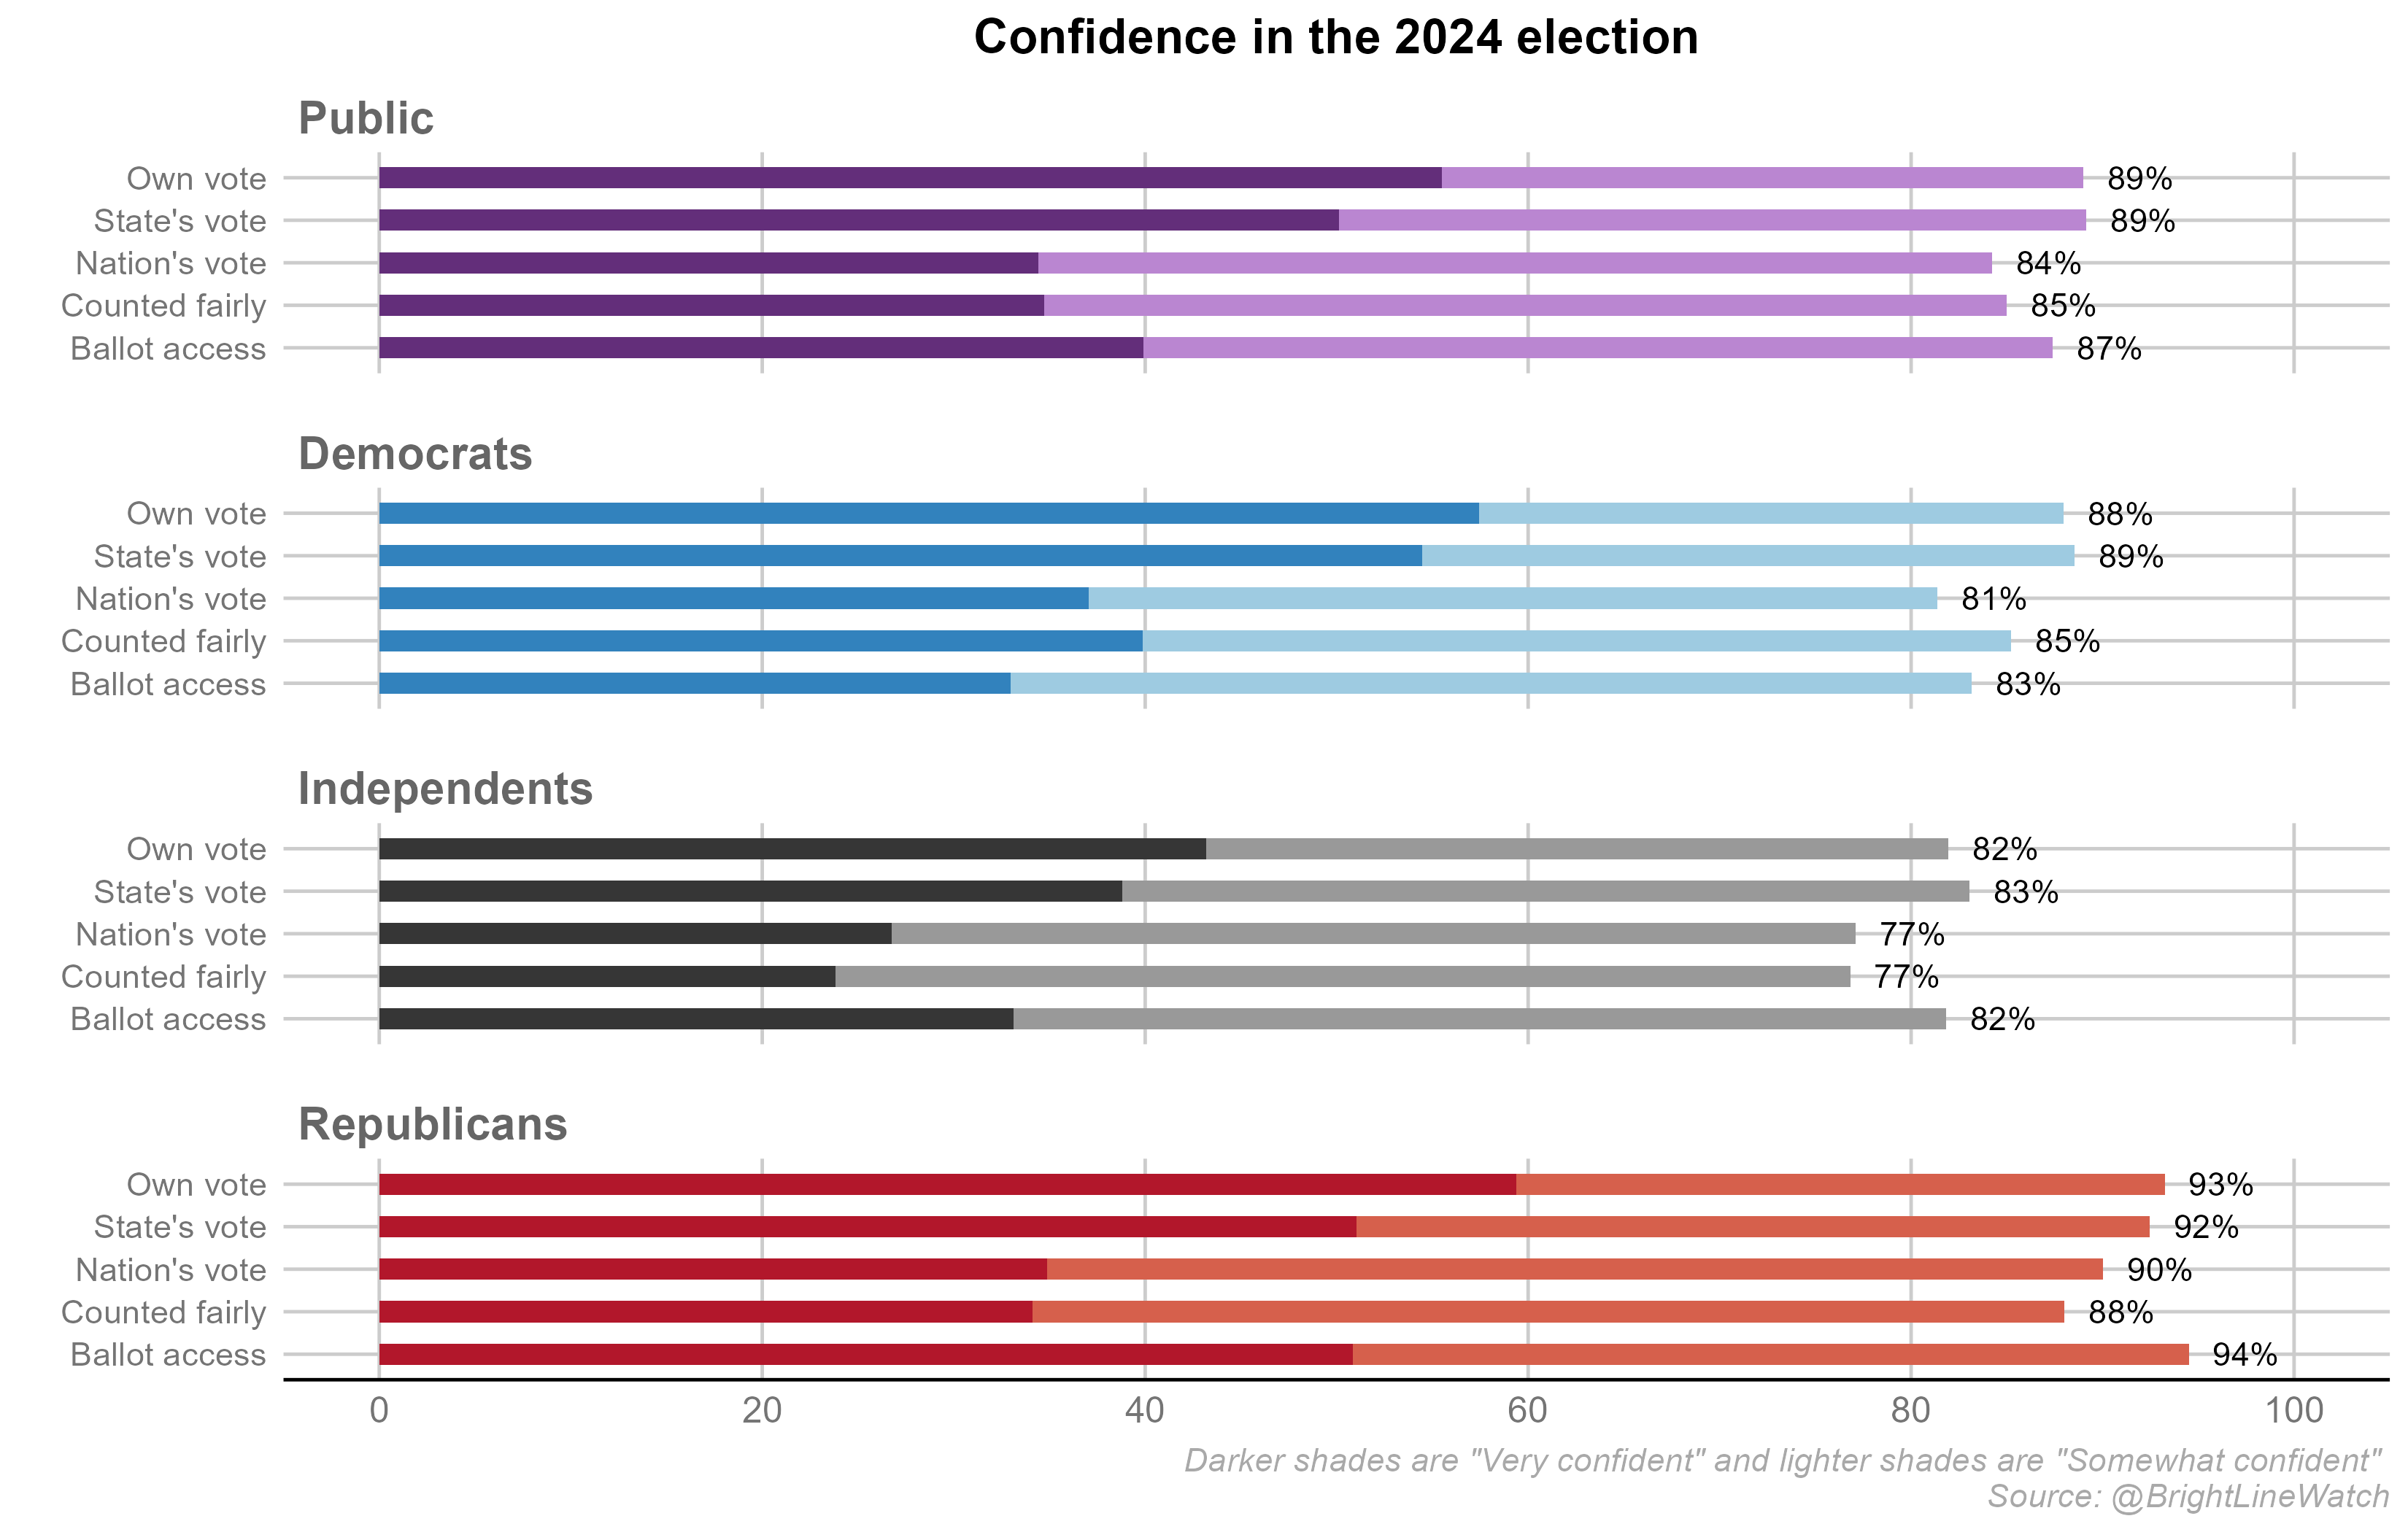
Confidence in the election was high among all groups across all questions. As in previous surveys, respondents expressed greater confidence in their local vote count and in the vote count in their state than in the national count, but the difference between state- and national-level confidence was much smaller after the election (2–6 percentage points by group) after the election compared to before the election (7–21 percentage points by group).
The over-time data shows how dramatic of a reversal these patterns were.
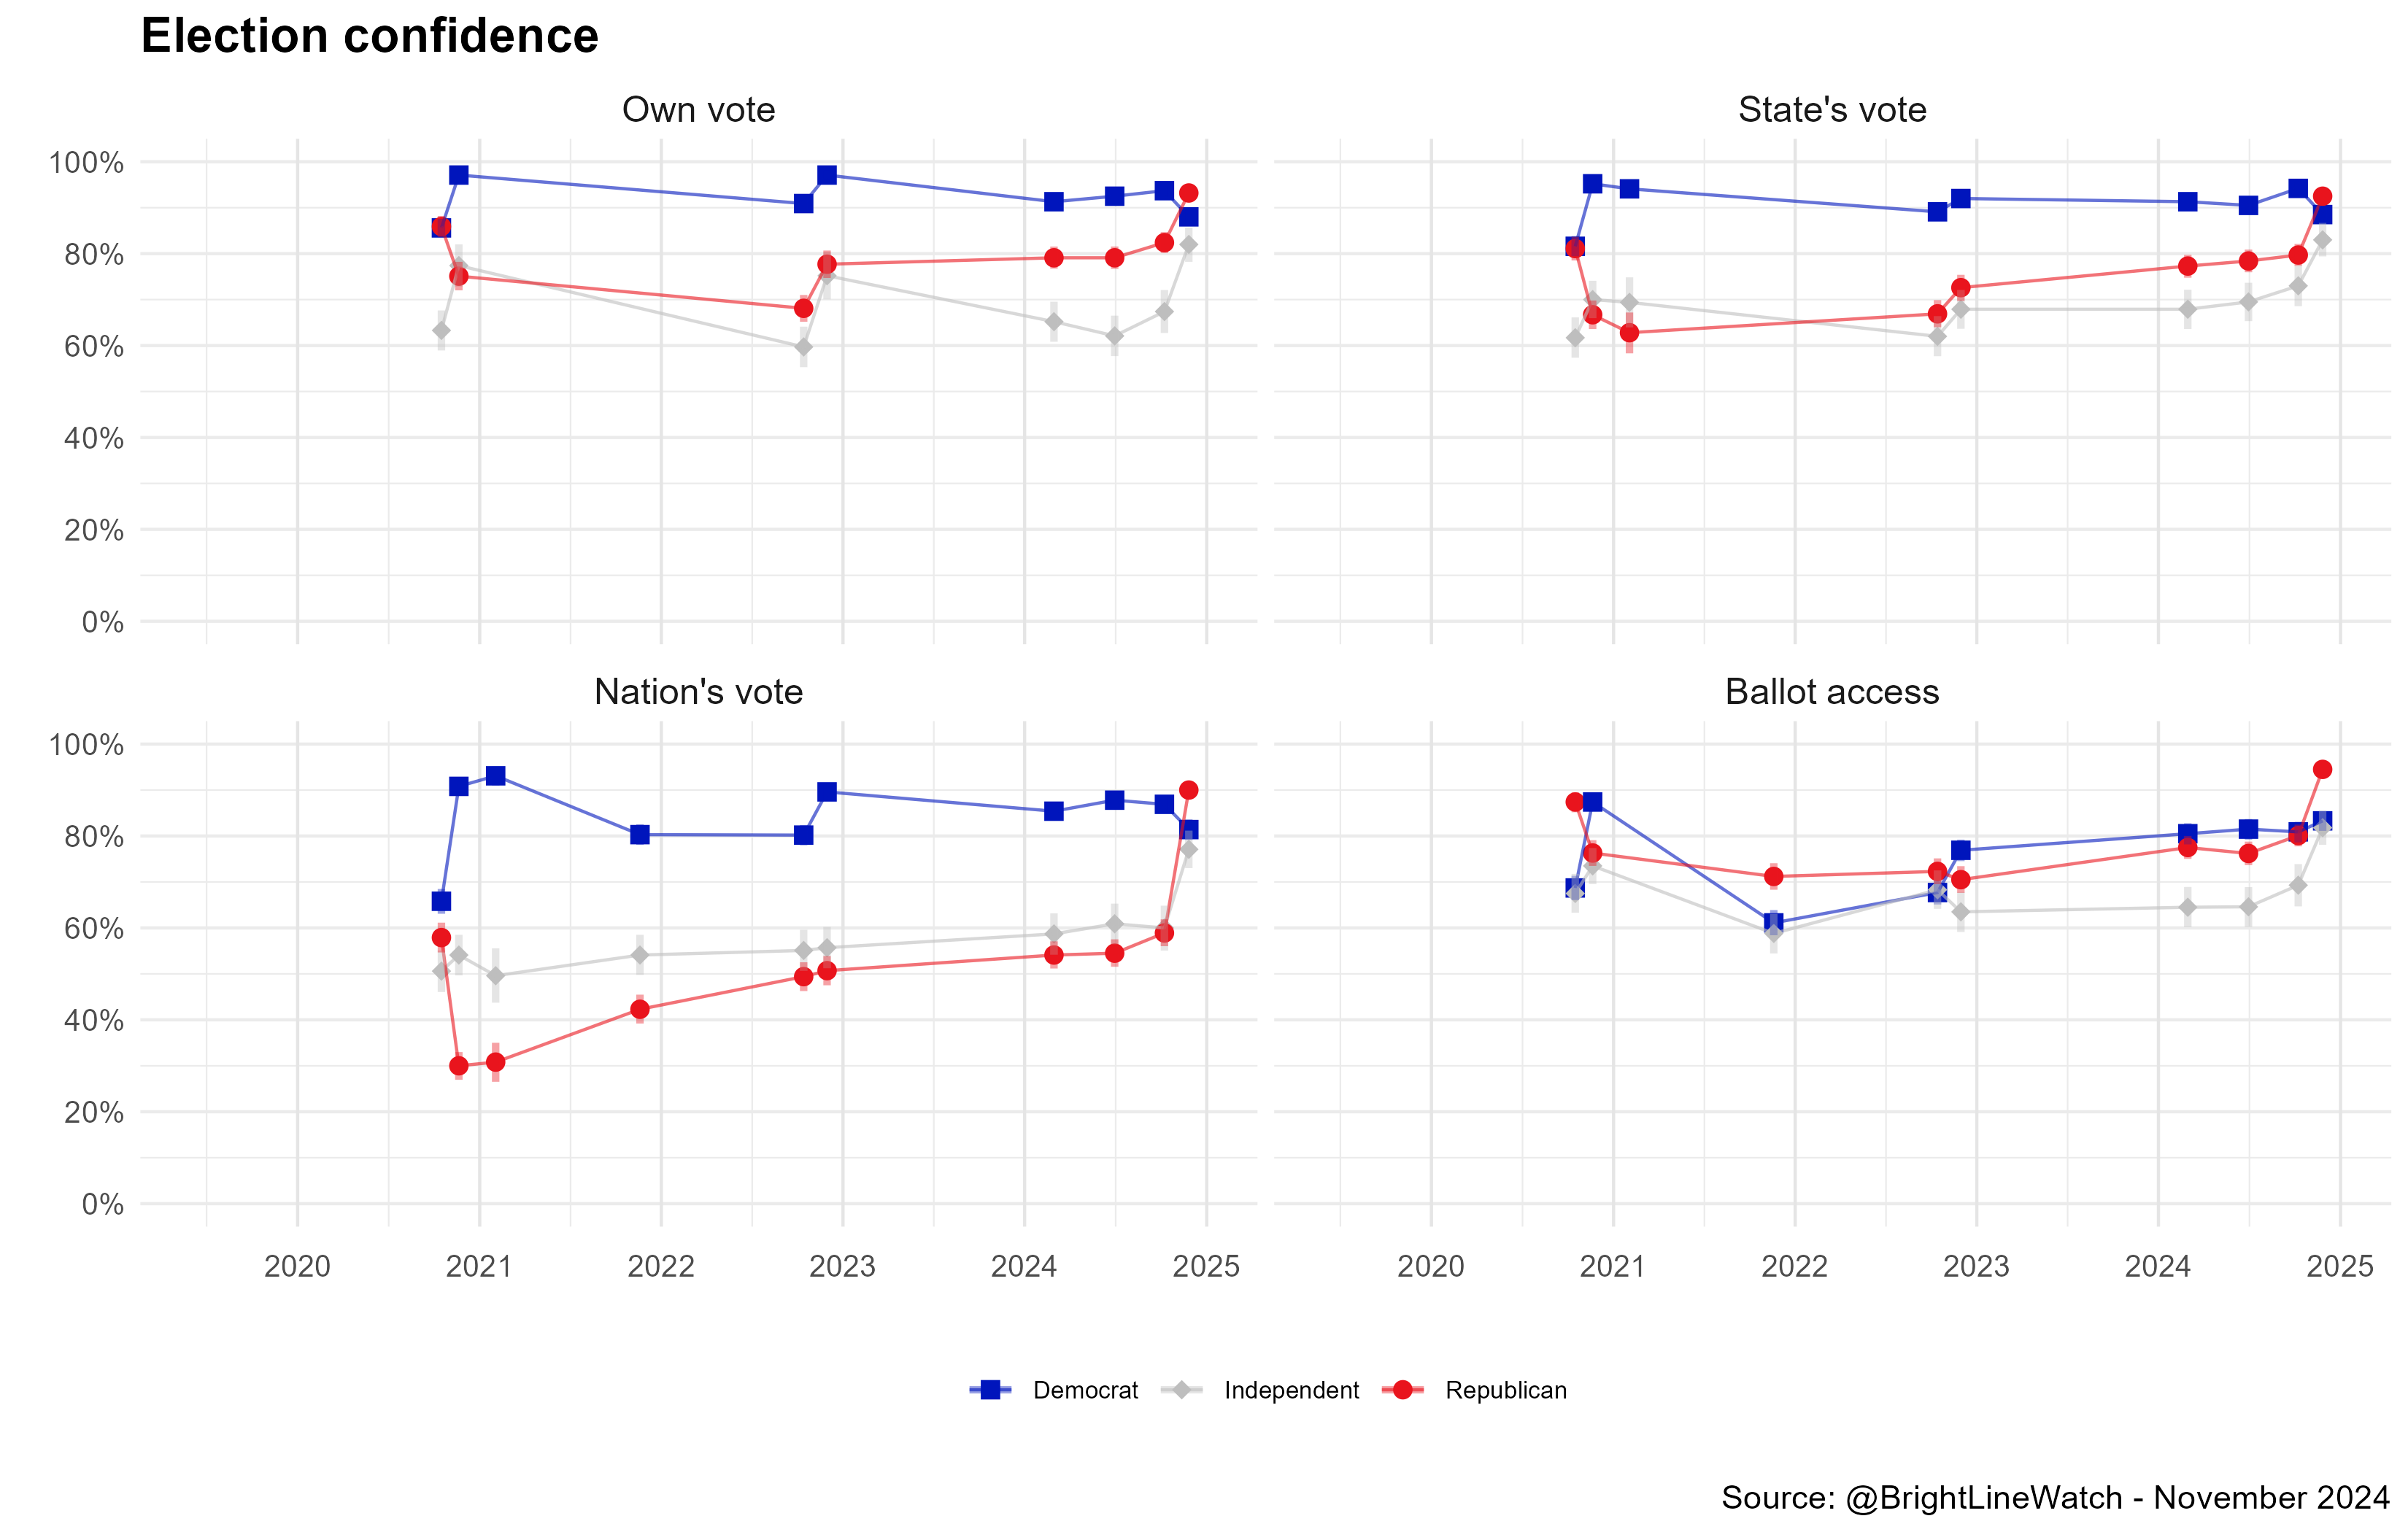
Confidence in the election was higher among Republicans than Democrats for the first time since our pre-election survey in 2020, when Republicans expressed higher confidence in their local and state counts (although lower confidence in the national count) than did Democrats. But since Trump refused to accept the outcome of the 2020 election, Republicans have expressed less confidence in elections than Democrats across ten consecutive surveys. Republicans have expressed somewhat more confidence in the national vote over time since 2021, reaching 59% before the election but soaring to 90% after Trump’s win. Democratic confidence, by contrast, declined, but only from 87% just before the election to 81% after Harris’s defeat. The net result is that overall election confidence is at its highest since we began asking the question in 2020, with 85% of the public saying they are very or somewhat confident in the count nationwide. (These results are consistent with other polling; we note that confidence may vary by state.)
Acceptance of Trump and Biden as the rightful winner
For the past four years, we have asked Americans whether Joe Biden was the rightful winner of the 2020 presidential election.1 In our November post-election survey, we also asked whether respondents regarded Donald Trump as the rightful winner in 2024. The figure below shows the share of respondents across different partisan groups who state that Biden and Trump, respectively, were “definitely” or “probably” the rightful winners in each election.
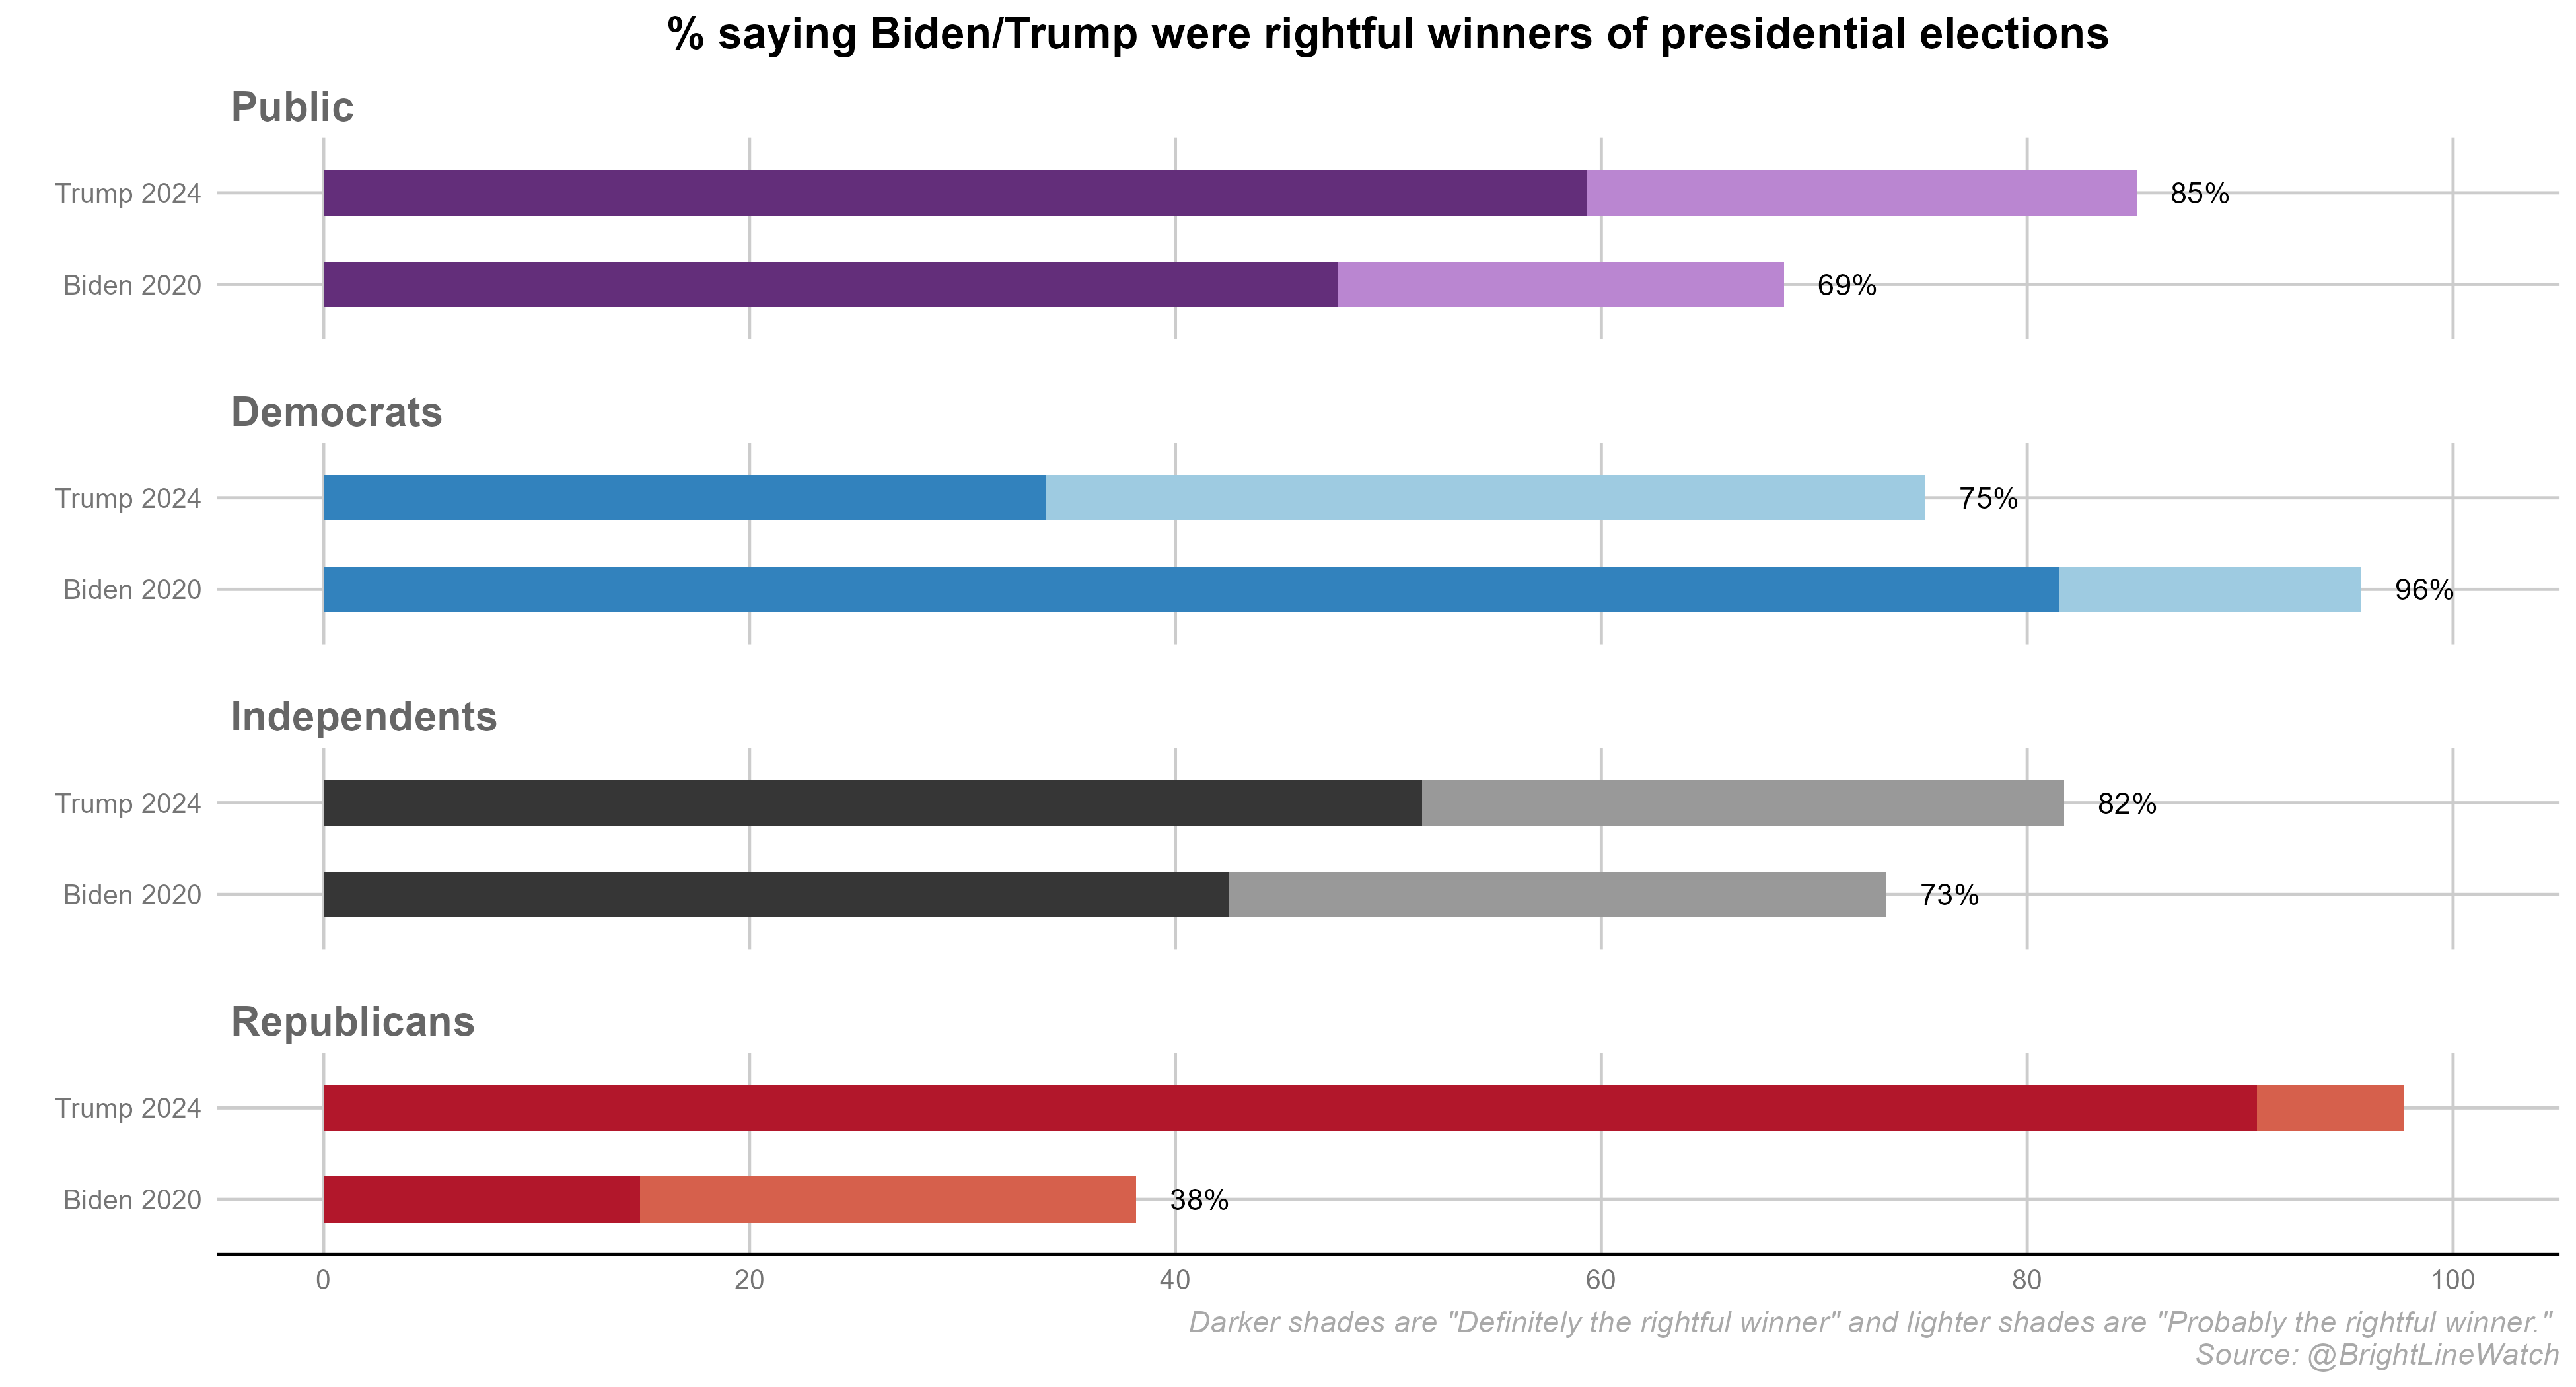
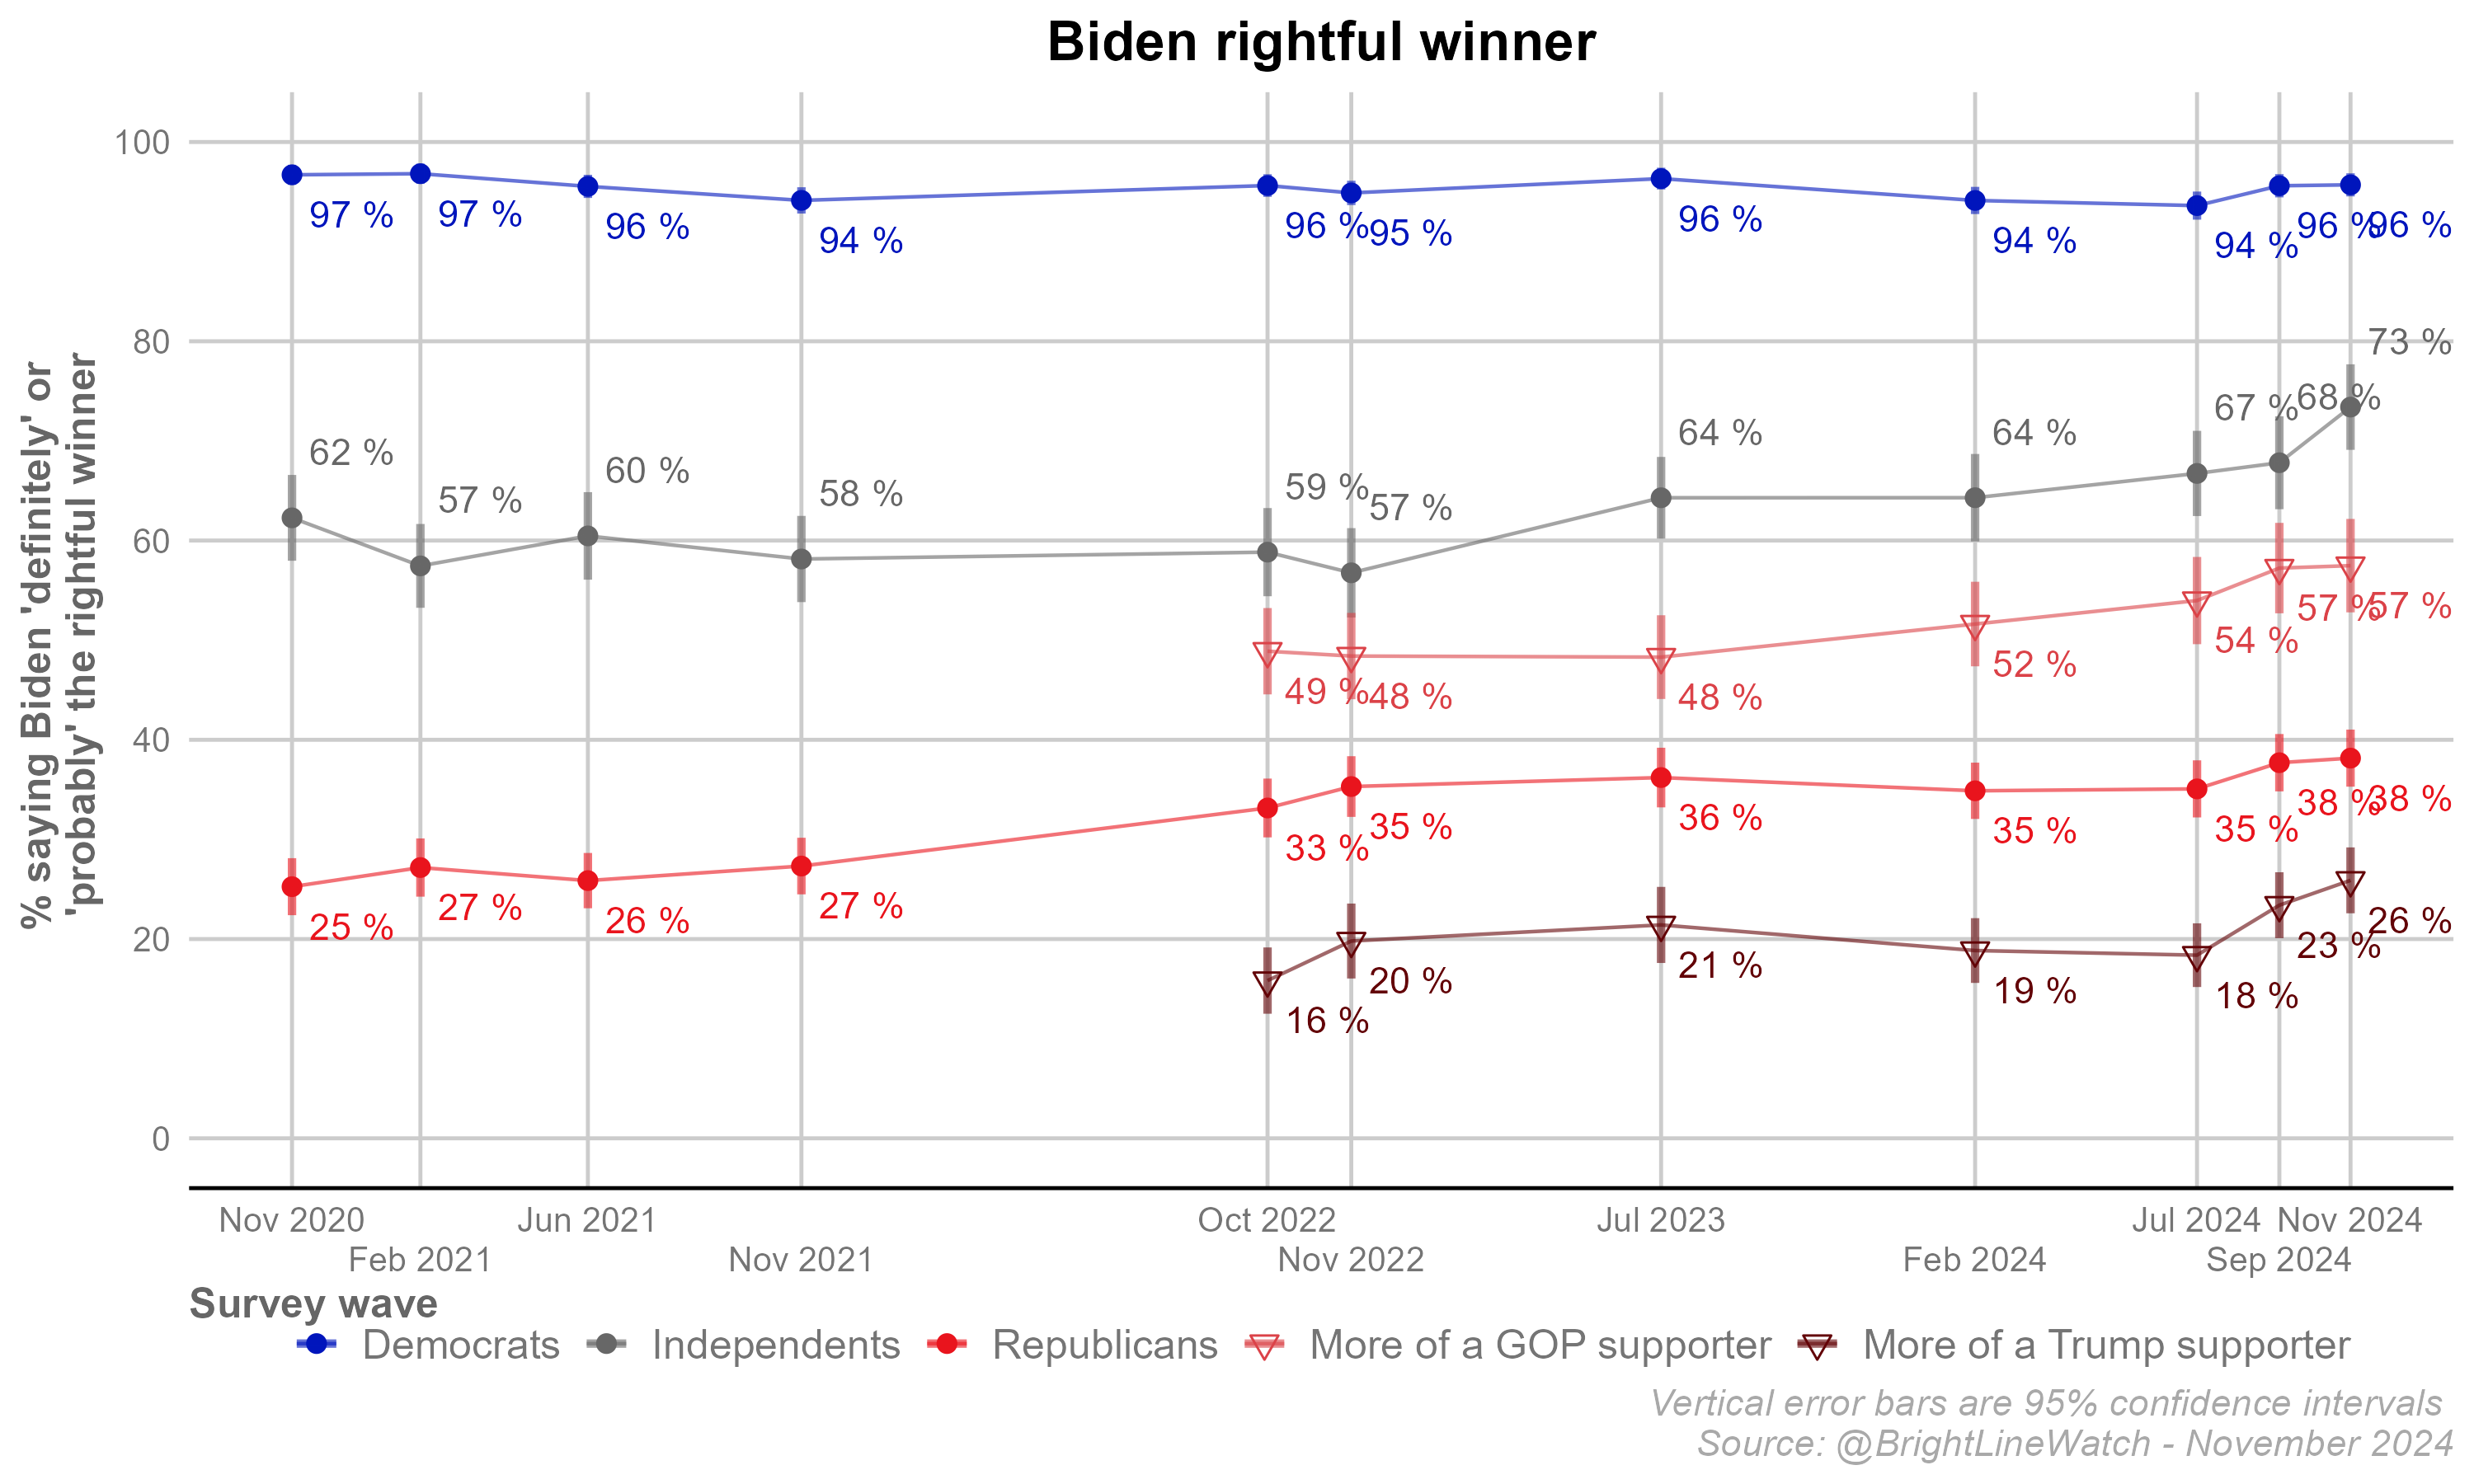
Trump’s 2024 win is regarded as rightful by a larger proportion of the public overall (85%) than is Biden’s in 2020 (69%). That difference tracks closely with attitudes among partisan independents (82% rightful for Trump, 73% for Biden). Attitudes among partisans are highly polarized. Both sides see their own candidate’s victory as legitimate at very high rates — 96% of Democrats view Biden as the rightful winner in 2020 and 98% of Republicans say the same about Trump’s victory in 2024. However, the parties are decidedly asymmetric in their acceptance of the other party’s victory. Three in four Democrats accept Trump as the rightful winner immediately after the 2024 election compared to just 38% of Republicans who accept Biden’s win four years after it took place. The key difference, seemingly, is that Kamala Harris immediately conceded and acknowledged the outcome of the race, while Trump made false claims that the election was stolen and sought to overturn the result, leading a process that culminated in the January 6 insurrection, his impeachment, and criminal charges filed by Department of Justice special counsel Jack Smith.
This asymmetry is even more apparent when we compare November post-election surveys from 2020 and 2024 asking respondents whether they viewed the outcomes of those presidential elections as legitimate. The figure below shows the percentages of Democrats, Republicans, and independents who regarded each election as entirely or somewhat legitimate (as opposed to not very or not at all legitimate).
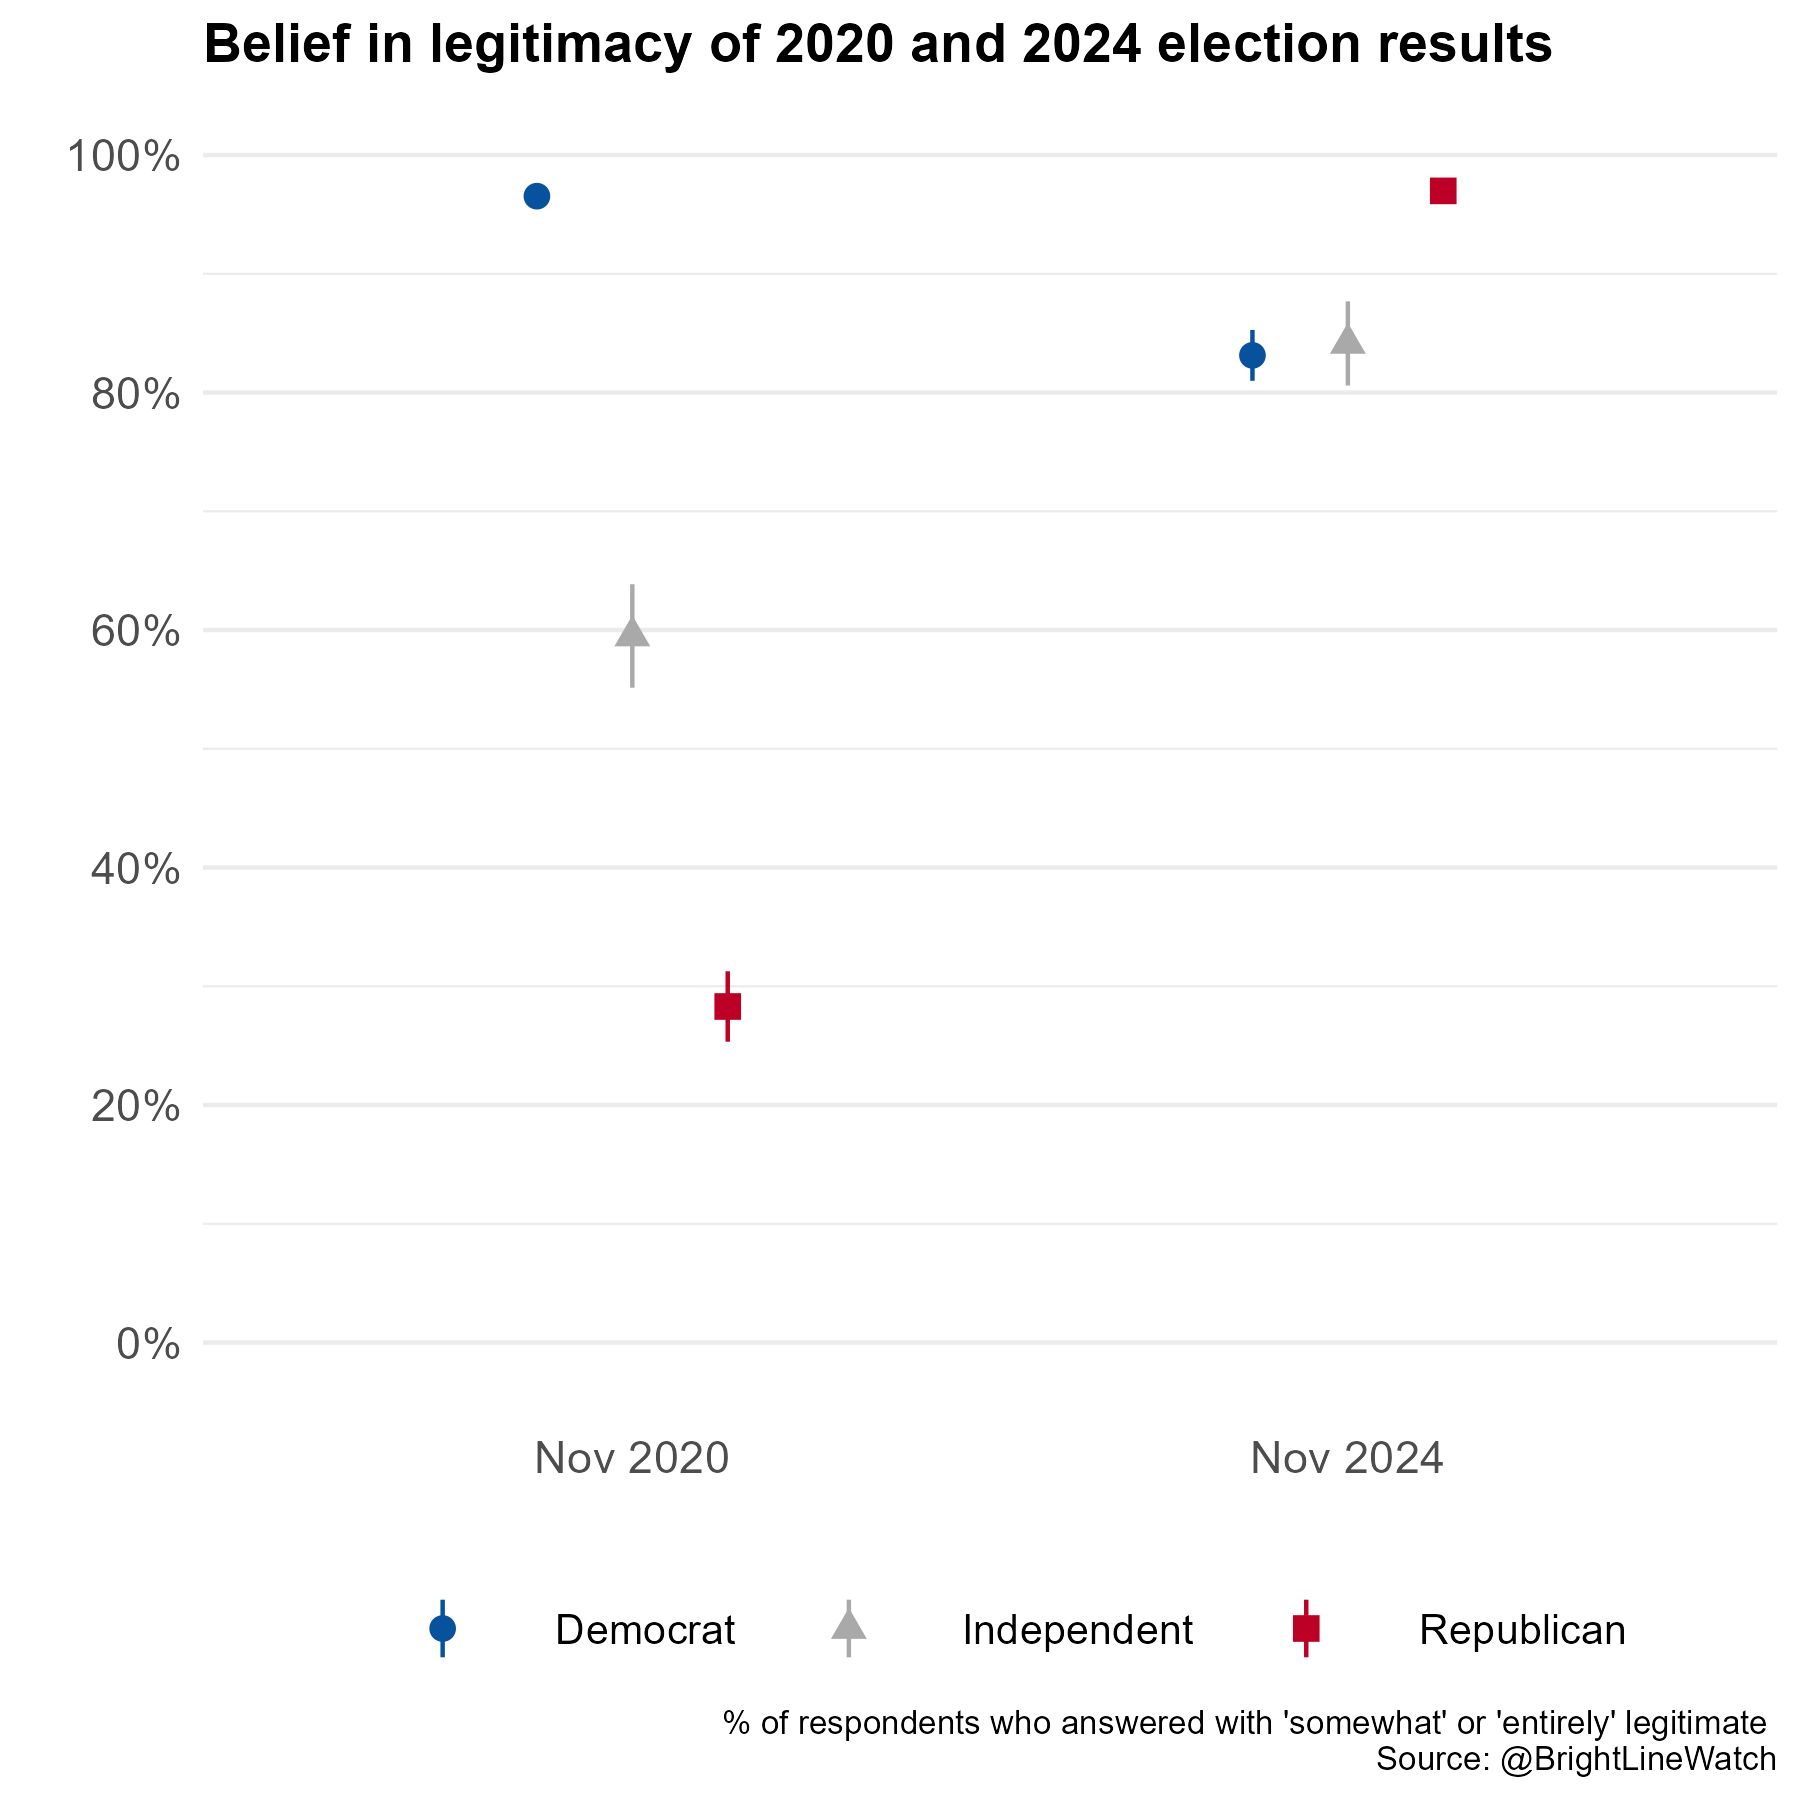
Among Democrats, the legitimacy of the outcome decreased from 97% in 2020 to 83% in 2024, but this decrease is more than offset by the increases in perceived legitimacy from 27% to 97% among Republicans and from 60% to 84% among independents, respectively. The net effect of these changes is that overall public belief in the legitimacy of the presidential election outcome (not shown in the figure) is up substantially from 65% to 89%.
The question going forward is whether these gains in election confidence are durable. Supporters of winning parties and candidates tend to express greater confidence in the electoral process than do supporters of losing candidates and parties. In that sense, the surge in Republican confidence in elections that we observe is not surprising, but it may be an artifact of Trump’s win. Will Republicans accept the results of the next election that they lose or turn back to election denial? This question is critical for the stability of democracy, which requires the losers to recognize the other side’s right to hold power.
Beliefs about the prevalence of fraud
We also asked respondents about the prevalence of six different forms of voter and election fraud: voting by non-citizens, voting under a false identity, stealing or tampering with ballots, voting more than once, voting with another person’s absentee ballot, and changing votes by manipulating voting machine software. For each type of fraud, respondents were asked how many times it took place in the November election, using a seven-point scale ranging from “Never” to “A million or more.” The figure below compares current public beliefs in the prevalence of fraud in the 2024 election with beliefs about the prevalence of fraud in the 2020 and 2022 elections from pre- and post-election surveys conducted in November 2020 and a post-election survey from 2022. For each election and for each type of fraud, the figure shows the percentages of Democrats, Republicans, and independents who estimated that thousands of votes or more were affected in each election.
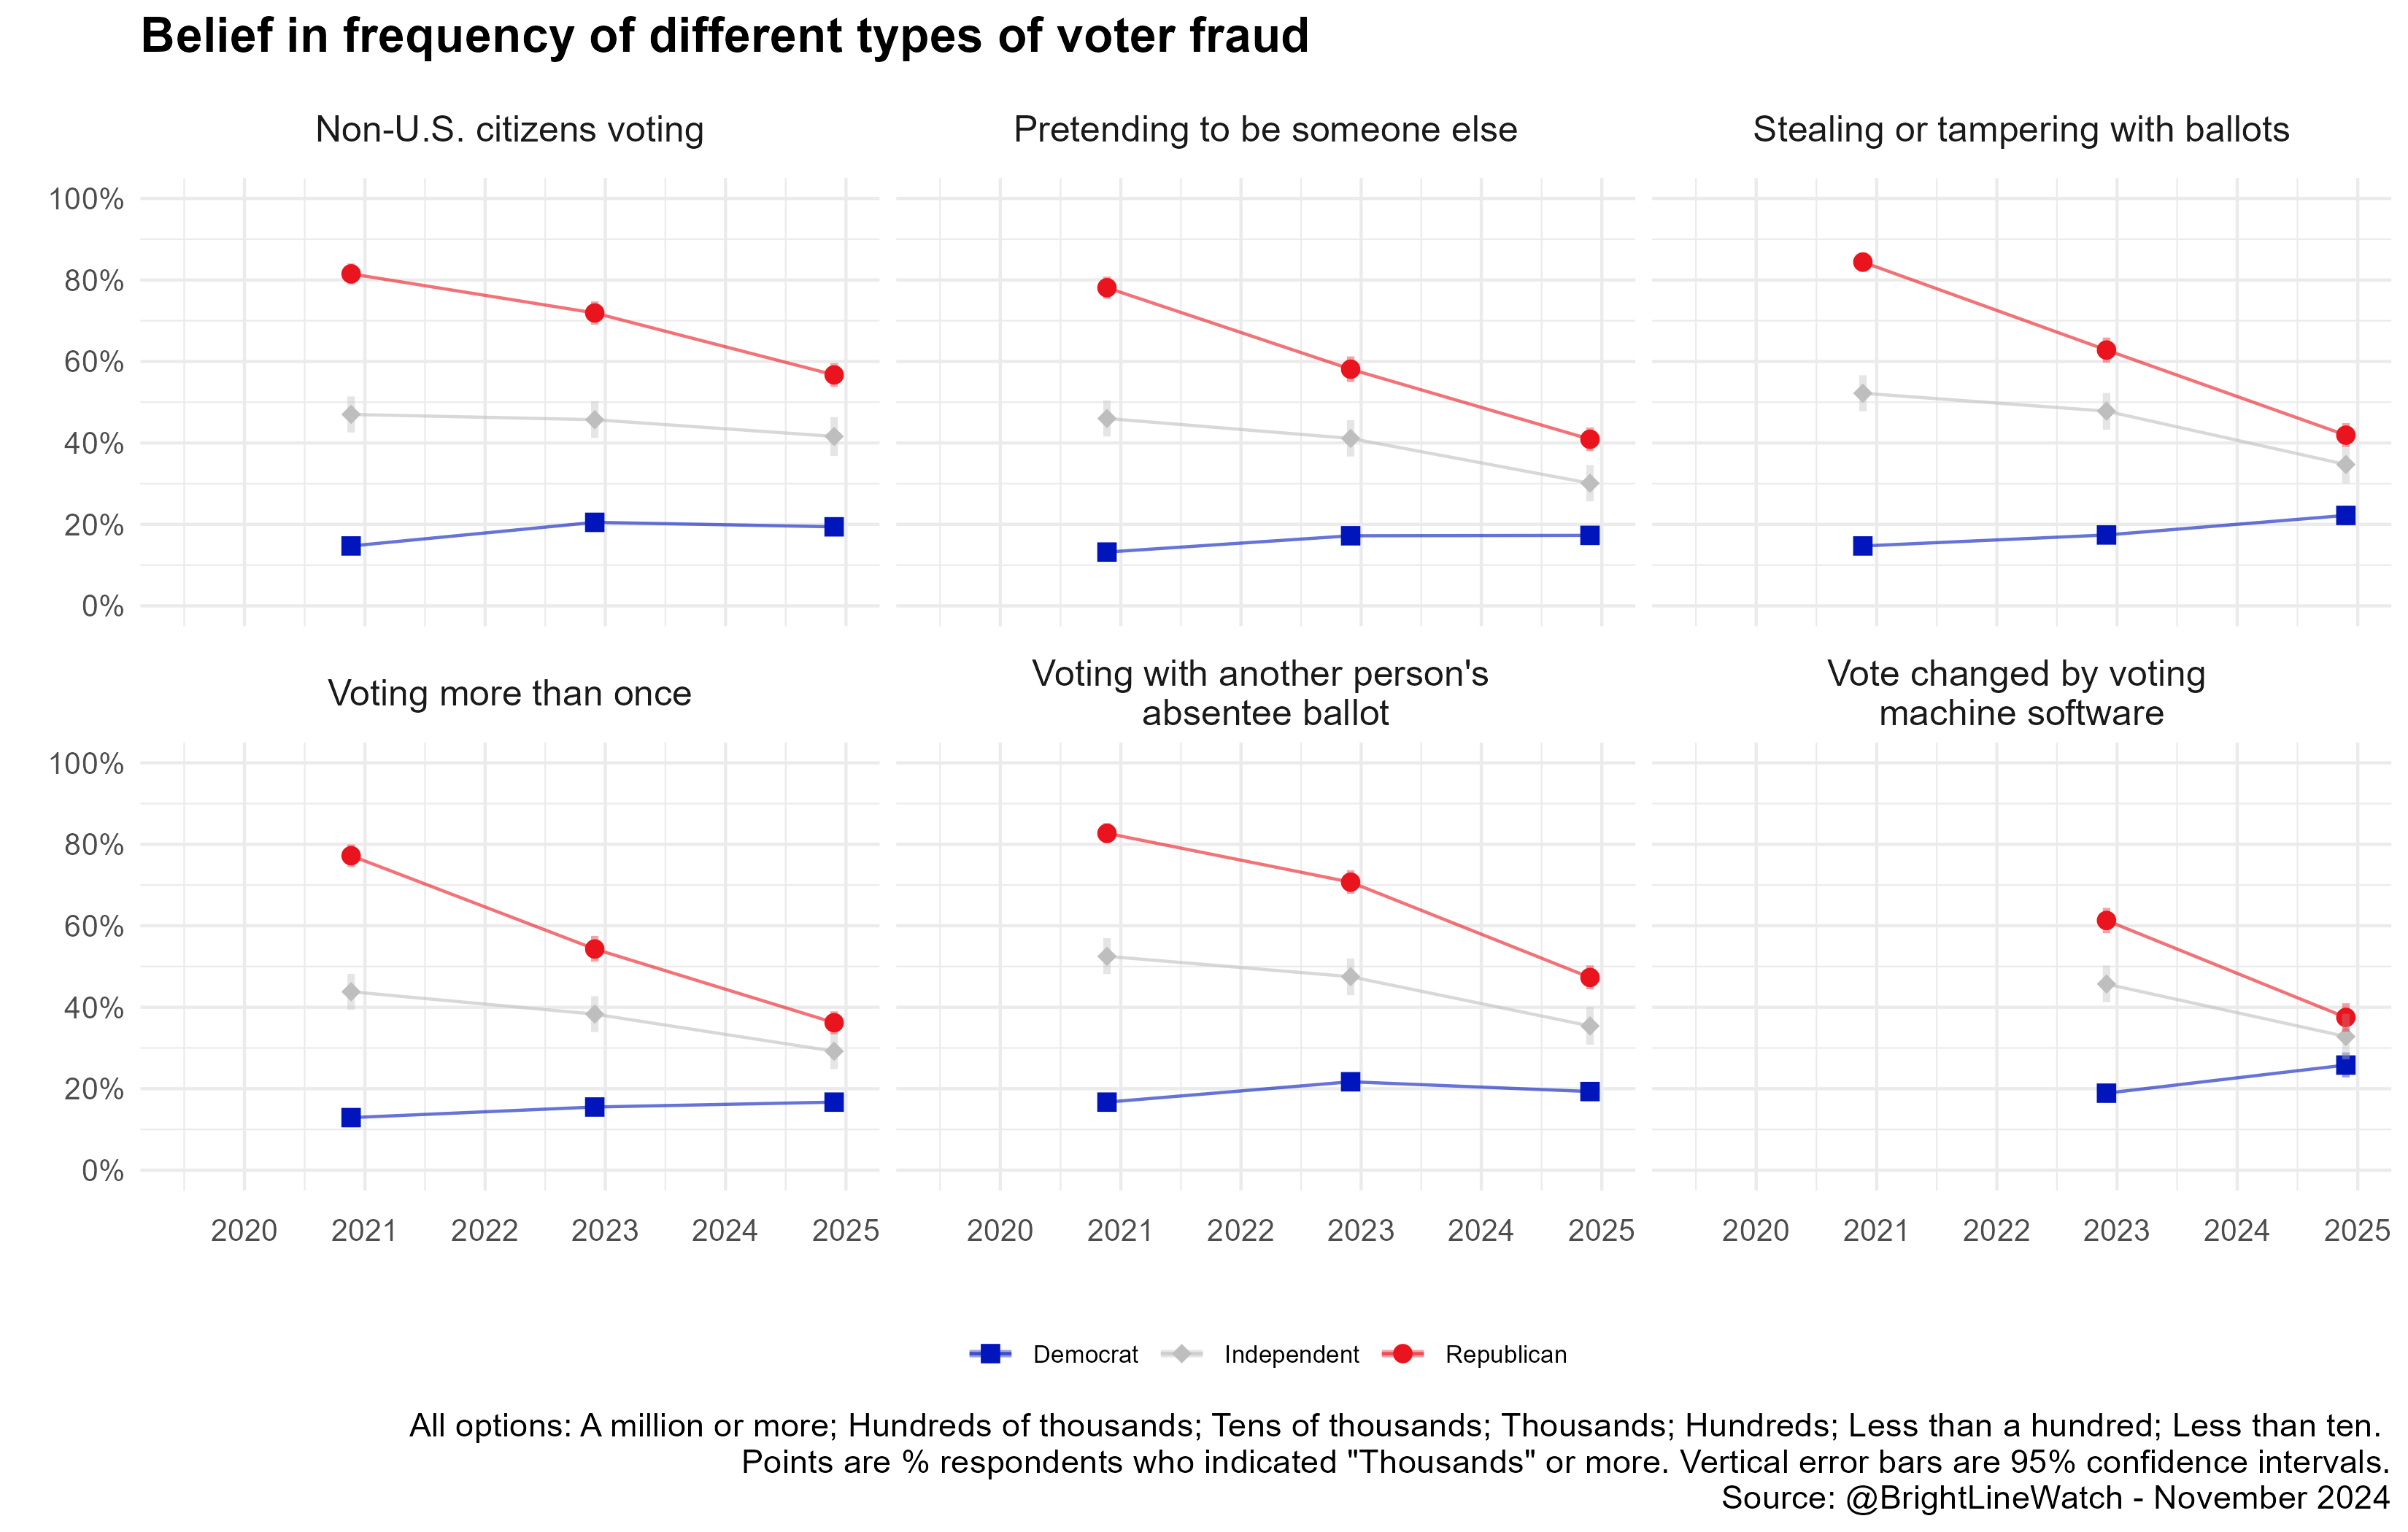
Most notable in the figure is the sharp drop in expressed fraud beliefs among Republicans and the corresponding (much smaller) increases among Democrats. Across all six items, the share of Republicans estimating “thousands” or more cases of that type of fraud fell by 13–24 percentage points between November 2020 and November 2024. By contrast, fraud belief rose among Democrats on all six items, although the changes were smaller and fraud beliefs remain higher among Republicans across the board.2
Why did Trump win?
We asked both our expert and public samples to assess the relative importance of seven factors in explaining why Trump won. The set of options included:
- Americans were unhappy with the economy
- Americans were unhappy with immigration
- Americans preferred Trump to Harris as a candidate
- The Democratic Party moved too far to the left on identity issues
- Harris focused too much on threats to democracy
- Biden refused to withdraw until it was too late for a primary
- Harris’s racial and gender identity
Respondents were presented with five pairs of items drawn randomly from this list and, for each pair, asked to select which of the two items better explains Trump’s victory3 The figure below shows the estimated relative importance of each item as evaluated by experts (green) and the public, broken out by partisanship (red for Republicans and Republican leaners, blue for Democrats and Democrat leaners).
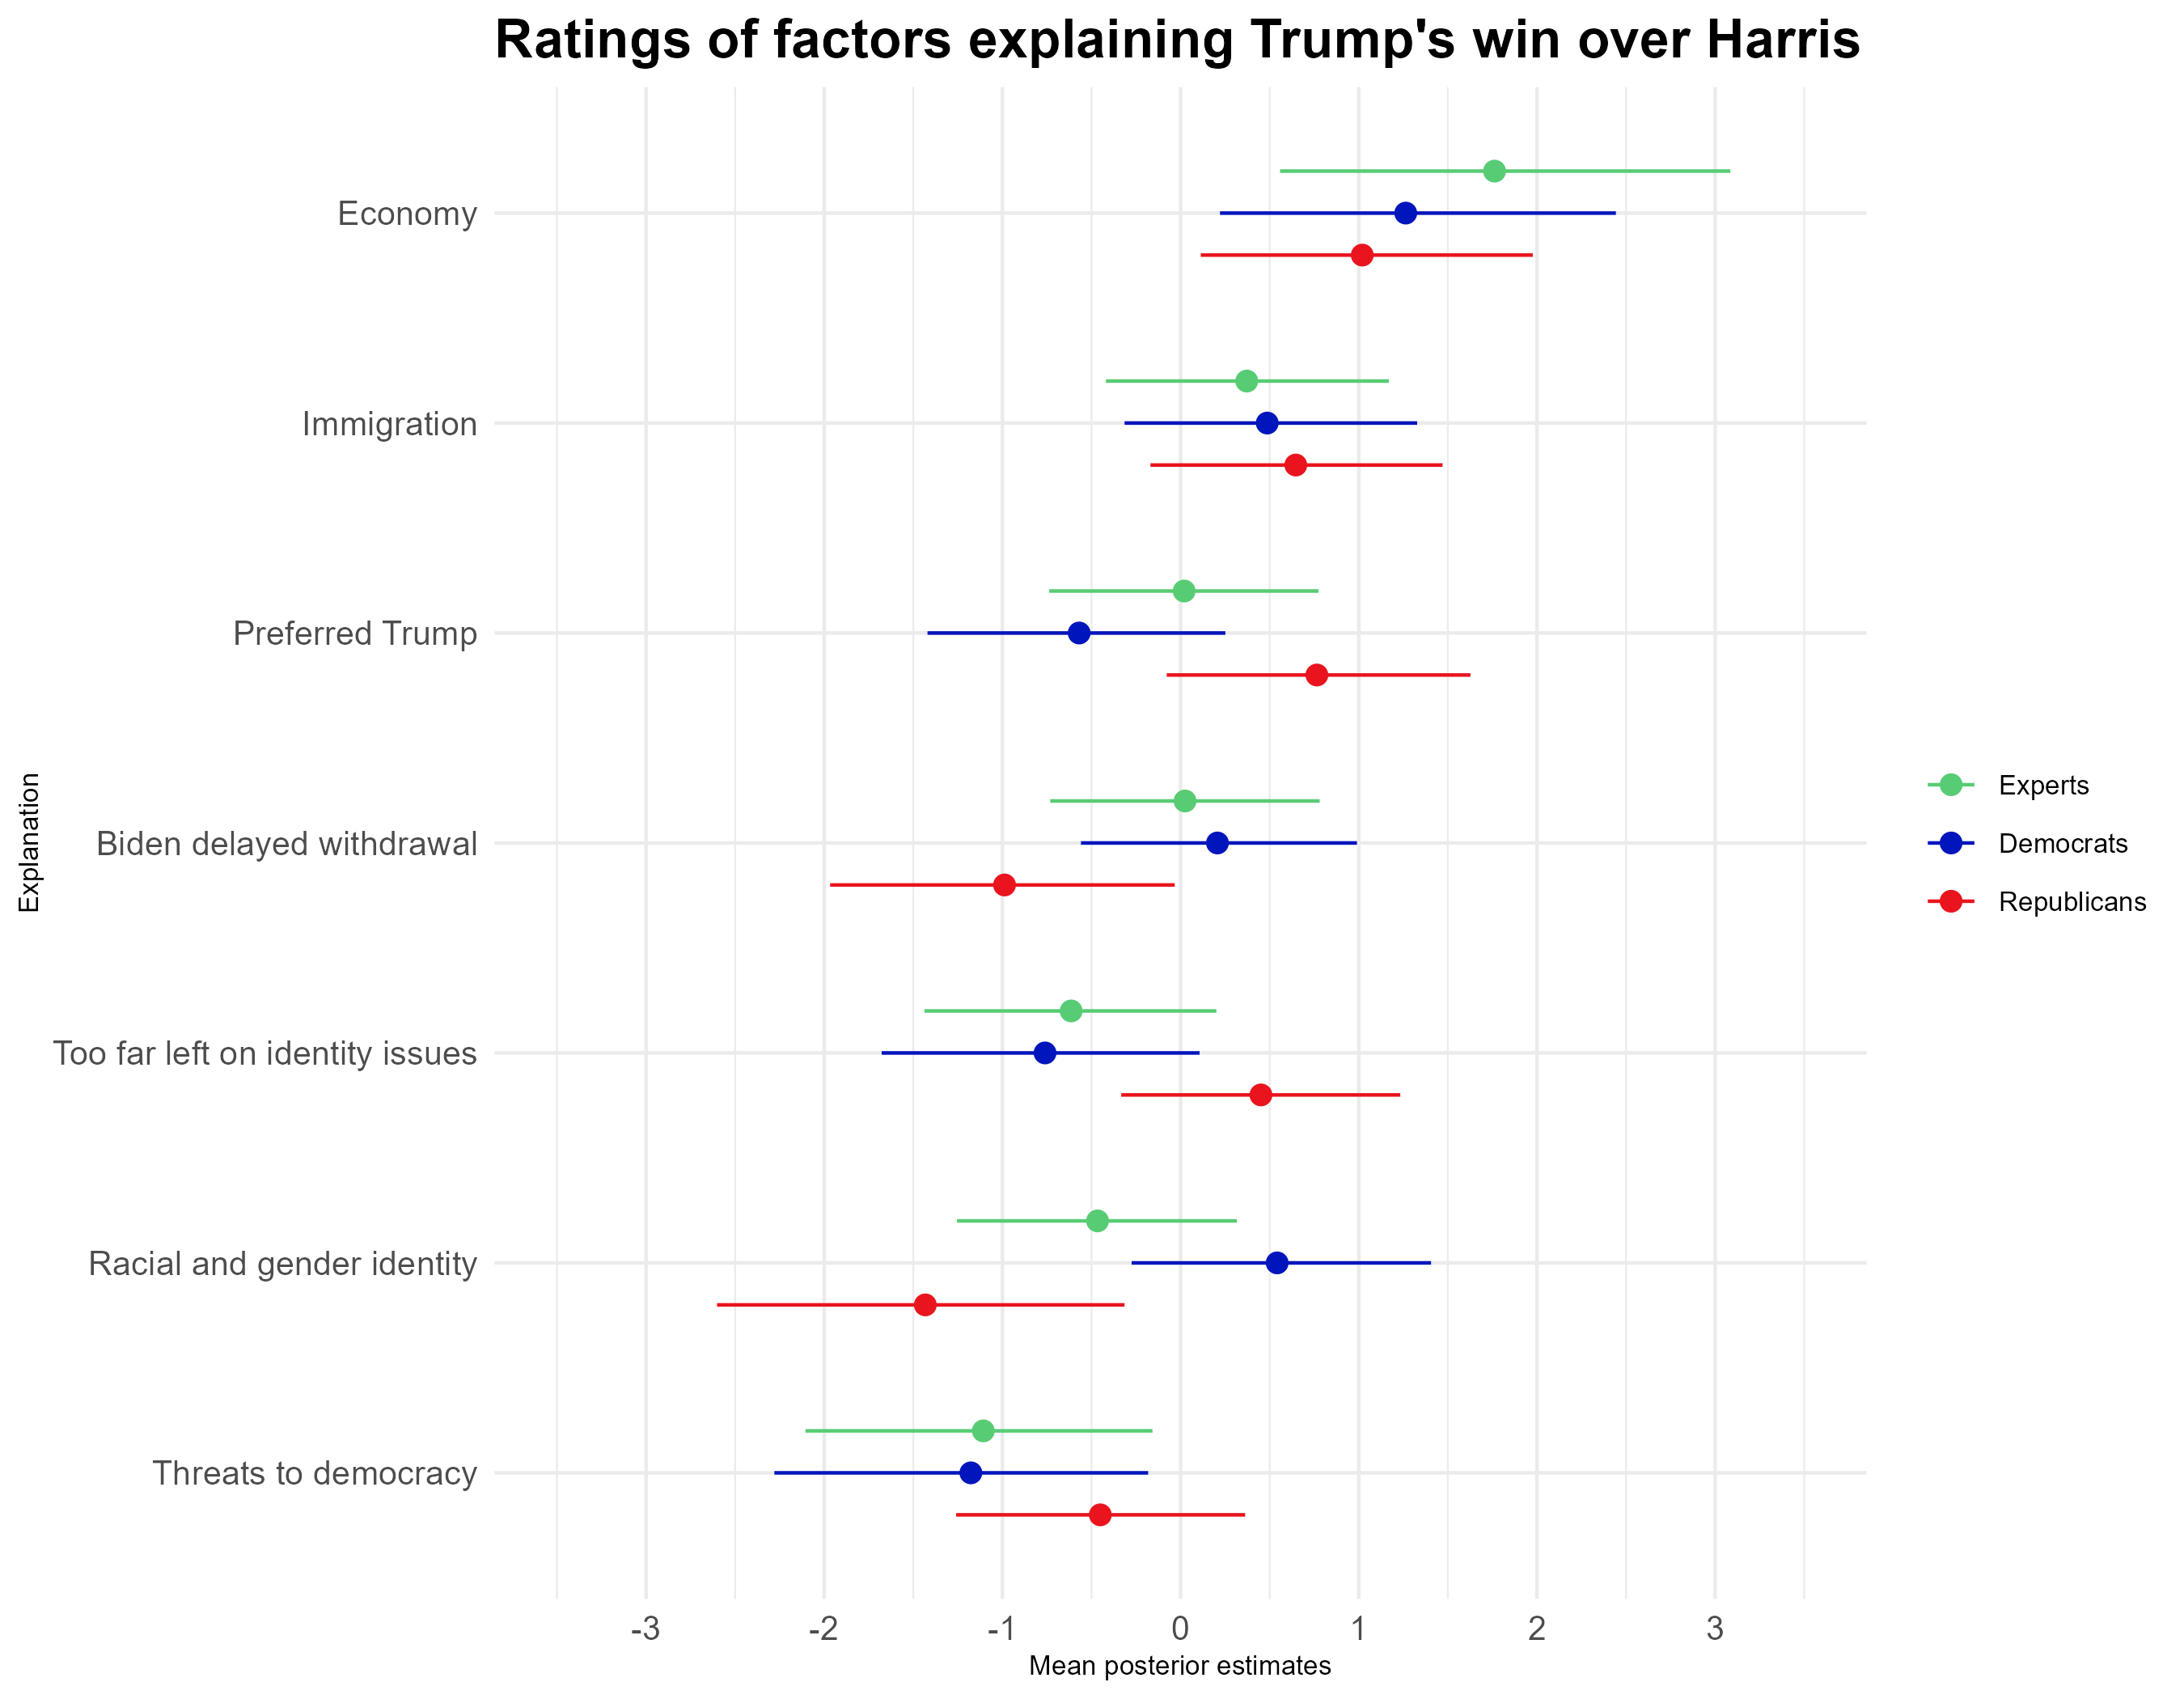
Both experts and partisans on both sides rated unhappiness with the economy as the most important explanation for Trump’s win. Experts also said Harris putting too much emphasis on threats to democracy was the least important factor in her defeat, with other factors falling somewhere in between. Members of the public tended to lean toward the factors that are most congenial to their party. Republicans were more likely to attribute Trump’s win to his being a more appealing candidate than Harris and to the Democrats having moved too far left on identity issues, whereas Democrats were more likely to blame Biden’s delayed withdrawal from the race and racial and gender bias against Harris.
Interpreting Trump’s victory
Much of the debate after Trump’s win concerned the extent to which he received a “mandate” from the public. We therefore first asked both public and expert survey participants if they think Trump has a mandate or should compromise. Only Republicans say Trump has a mandate (81%); many more Democrats (74%), independents (54%), and experts (84%) say he does not and should compromise instead.
To better understand how the public and experts viewed the policy implications of Trump’s victory, we asked both to assess the accuracy of statements saying “Donald Trump’s victory in the 2024 presidential election means Americans support Trump’s plans to _________” using policy proposals randomly drawn from the following list:
- impose tariffs on most imported goods,
- detain and deport millions of undocumented immigrants,
- pardon rioters who entered the Capitol on January 6, 2021,
- withdraw U.S. support for Ukraine,
- fire thousands of federal civil service employees,
- stop government support for transgender health care.
The figure below shows the percentage of respondents who assessed each statement as very or somewhat accurate (as opposed to not very or not at all accurate), with public respondents broken out by partisanship. In general, Republicans read Trump’s mandate across issues as stronger than other groups, and experts view it as weaker than other groups.
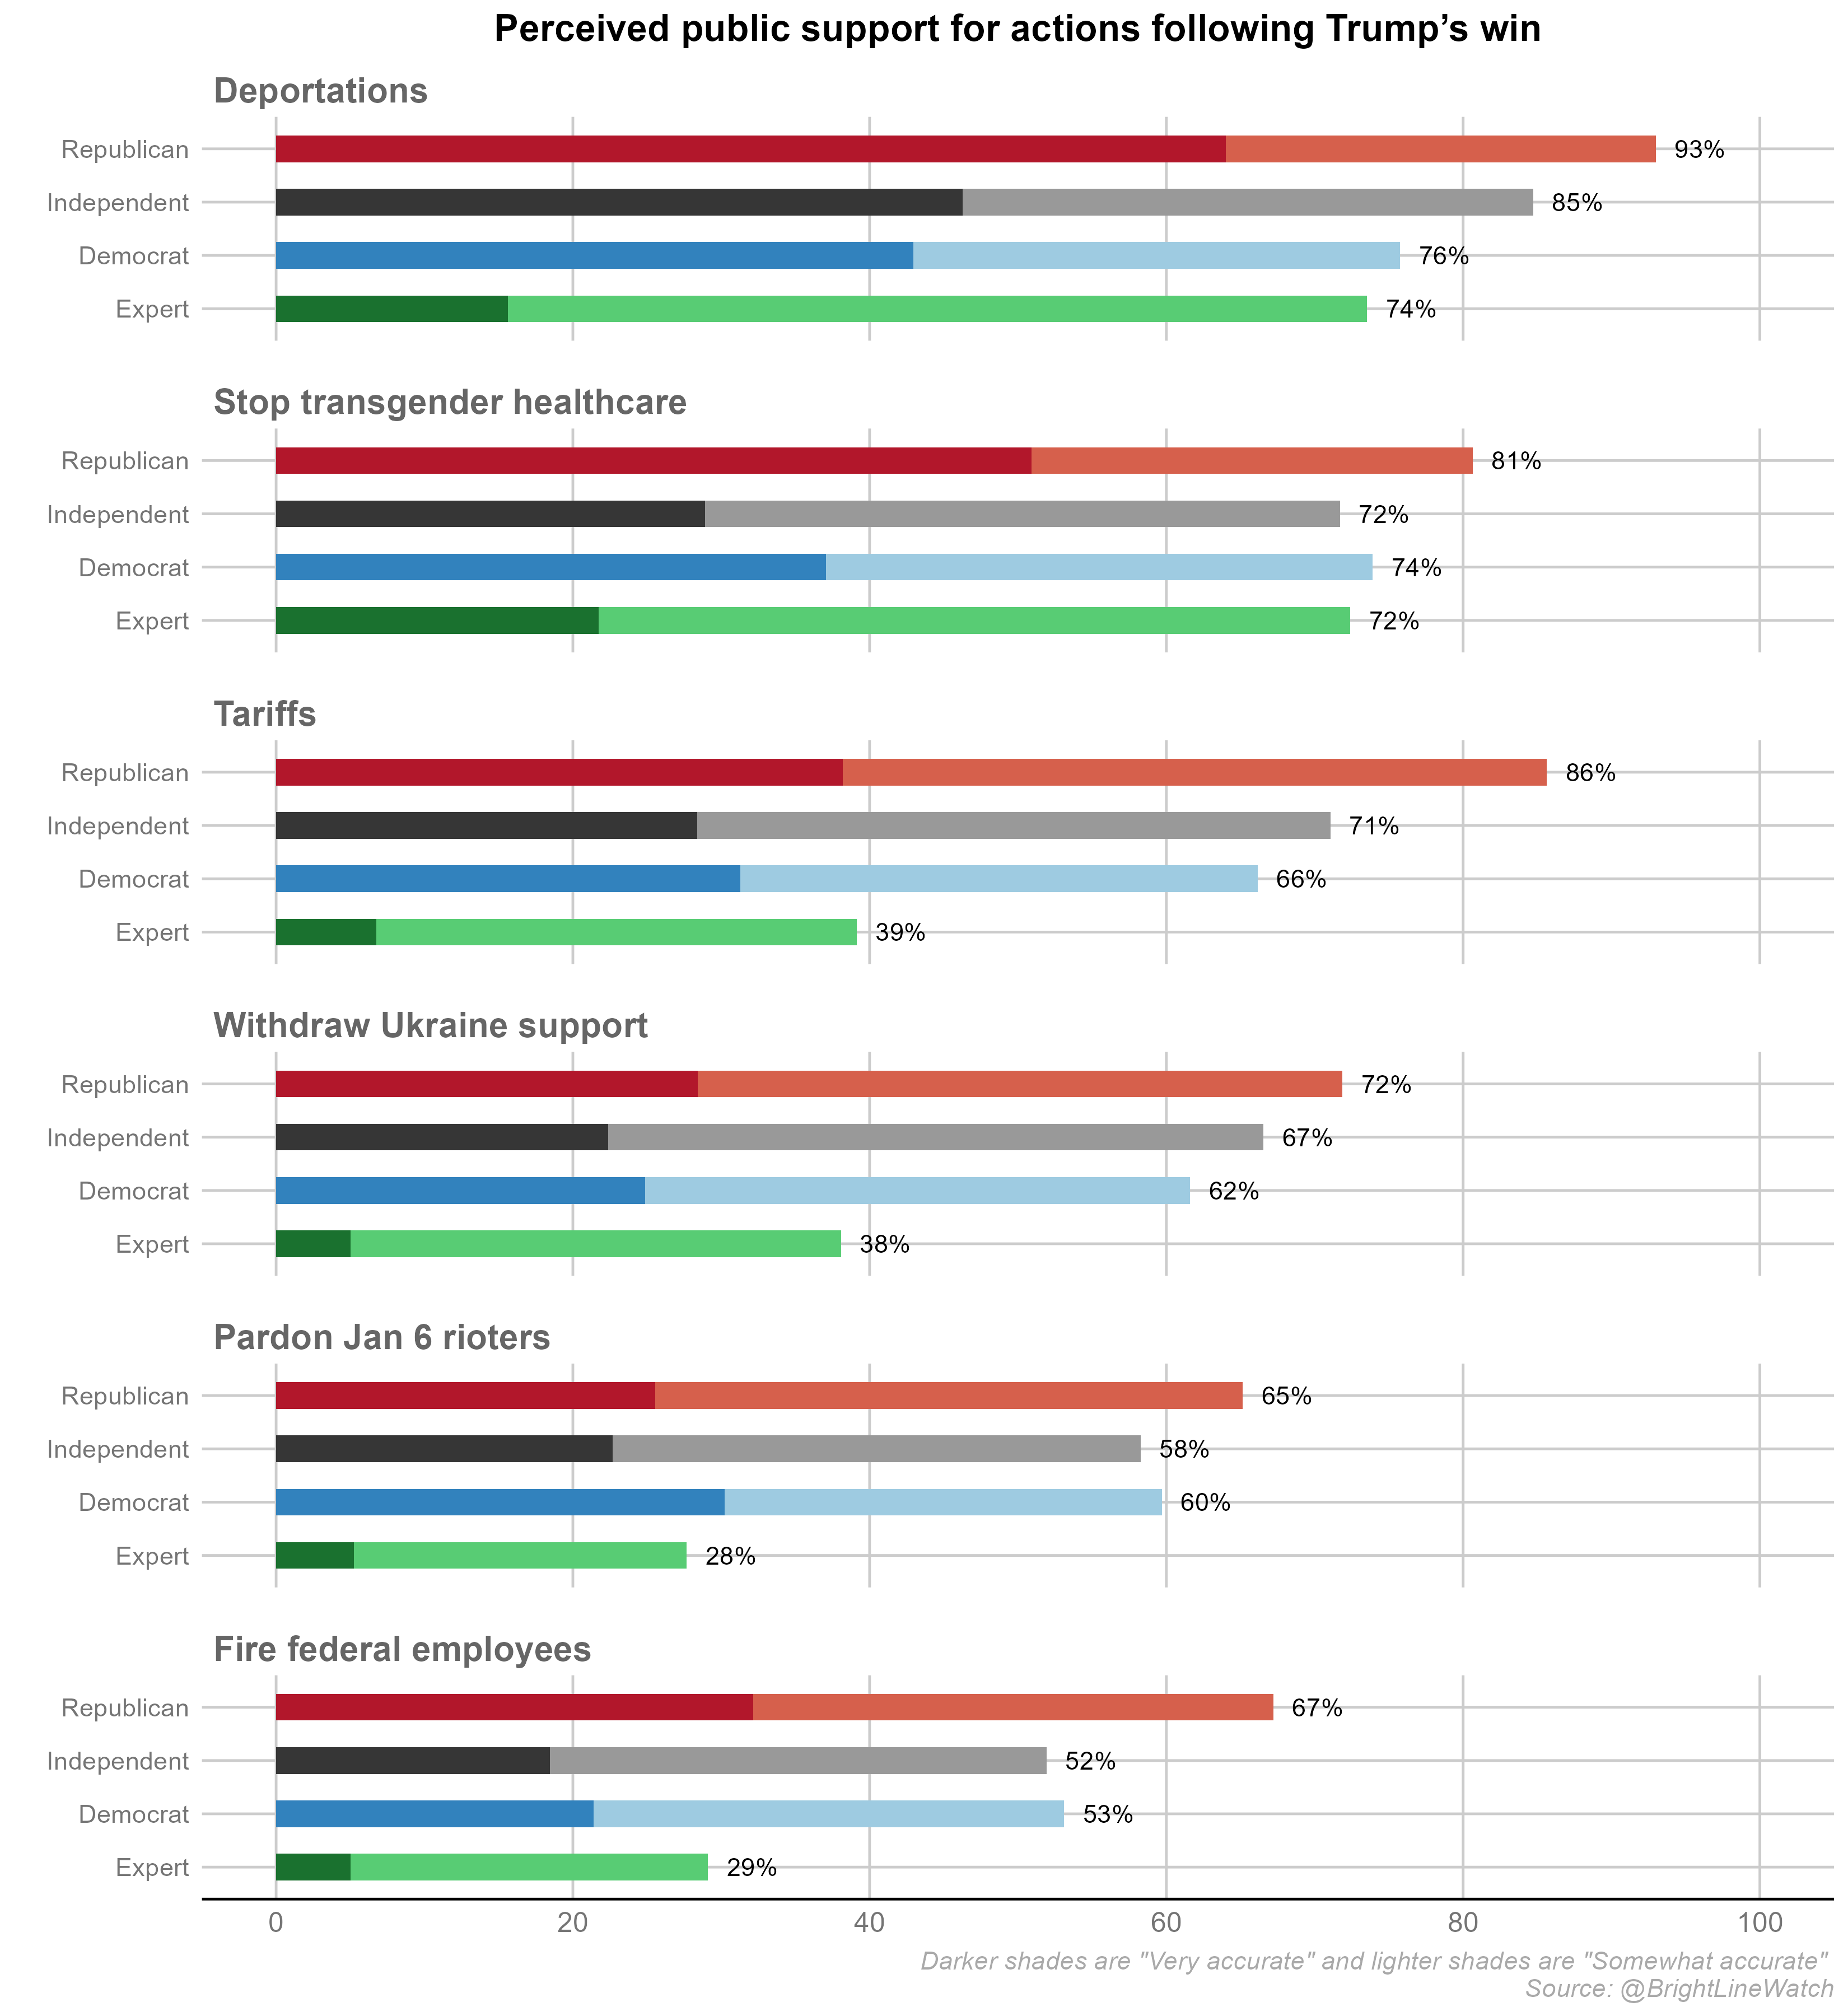
Trump’s strongest perceived mandate is on immigration policy. In total, 74% of our experts and 85% of the public overall (including 96% of Republicans, 85% of independents, and 76% of Democrats) interpret the election as conferring support for Trump’s plans to deport large numbers of undocumented immigrants.
Beyond immigration, the strongest perceived mandate is for stopping government support for transgender health care. Overall, 72% of experts, along with 81% of Republicans, 72% of independents, and 74% of Democrats said Trump’s election means Americans support that proposal. Most of the public interprets Trump’s win as indicating public support for imposing tariffs on most imported goods (86% of Republicans, 71% of independents, and 66% of Democrats), but only 39% of experts agree.
Narrower public majorities also regard the election as implying public support for withdrawing support from Ukraine (72% of Republicans, 67% of independents, and 62% of Democrats versus only 38% of experts), pardoning January 6 rioters (65%, 58%, 60%, and 28%, respectively), and firing thousands of federal workers (67%, 52%, 53%, and 29%).
Threats to democracy
We asked our experts to assess the impact of a series of recent events on democracy in the U.S. Respondents were first asked whether the event would benefit, threaten, or not affect American democracy. Those who selected benefit or threat were then asked about the extent of such an effect. The set of events that experts were asked to consider was the following:
- Elon Musk’s role as a supporter of and adviser to Trump.
- Trump asks candidates for Senate majority leader to commit to using recess appointments.
- Stephen Miller named Trump’s deputy chief of staff for policy.
- Trump announces he is nominating Pete Hegseth for Secretary of Defense.
- Trump announces he is nominating Matt Gaetz for Attorney General.
(Gaetz withdrew after the survey was fielded. Other controversial nominees were named too late to be considered such as Kash Patel, Trump’s pick for FBI Director, and Tulsi Gabbard, his nominee to be Director of National Intelligence.)
The left panel of the figure below shows expert ratings of the perceived benefits and threats to democracy from these events in descending order based on their overall perceived threat to democracy. (The right panel shows the percentage of respondents who rated the scenario as neither a threat nor a benefit to democracy).
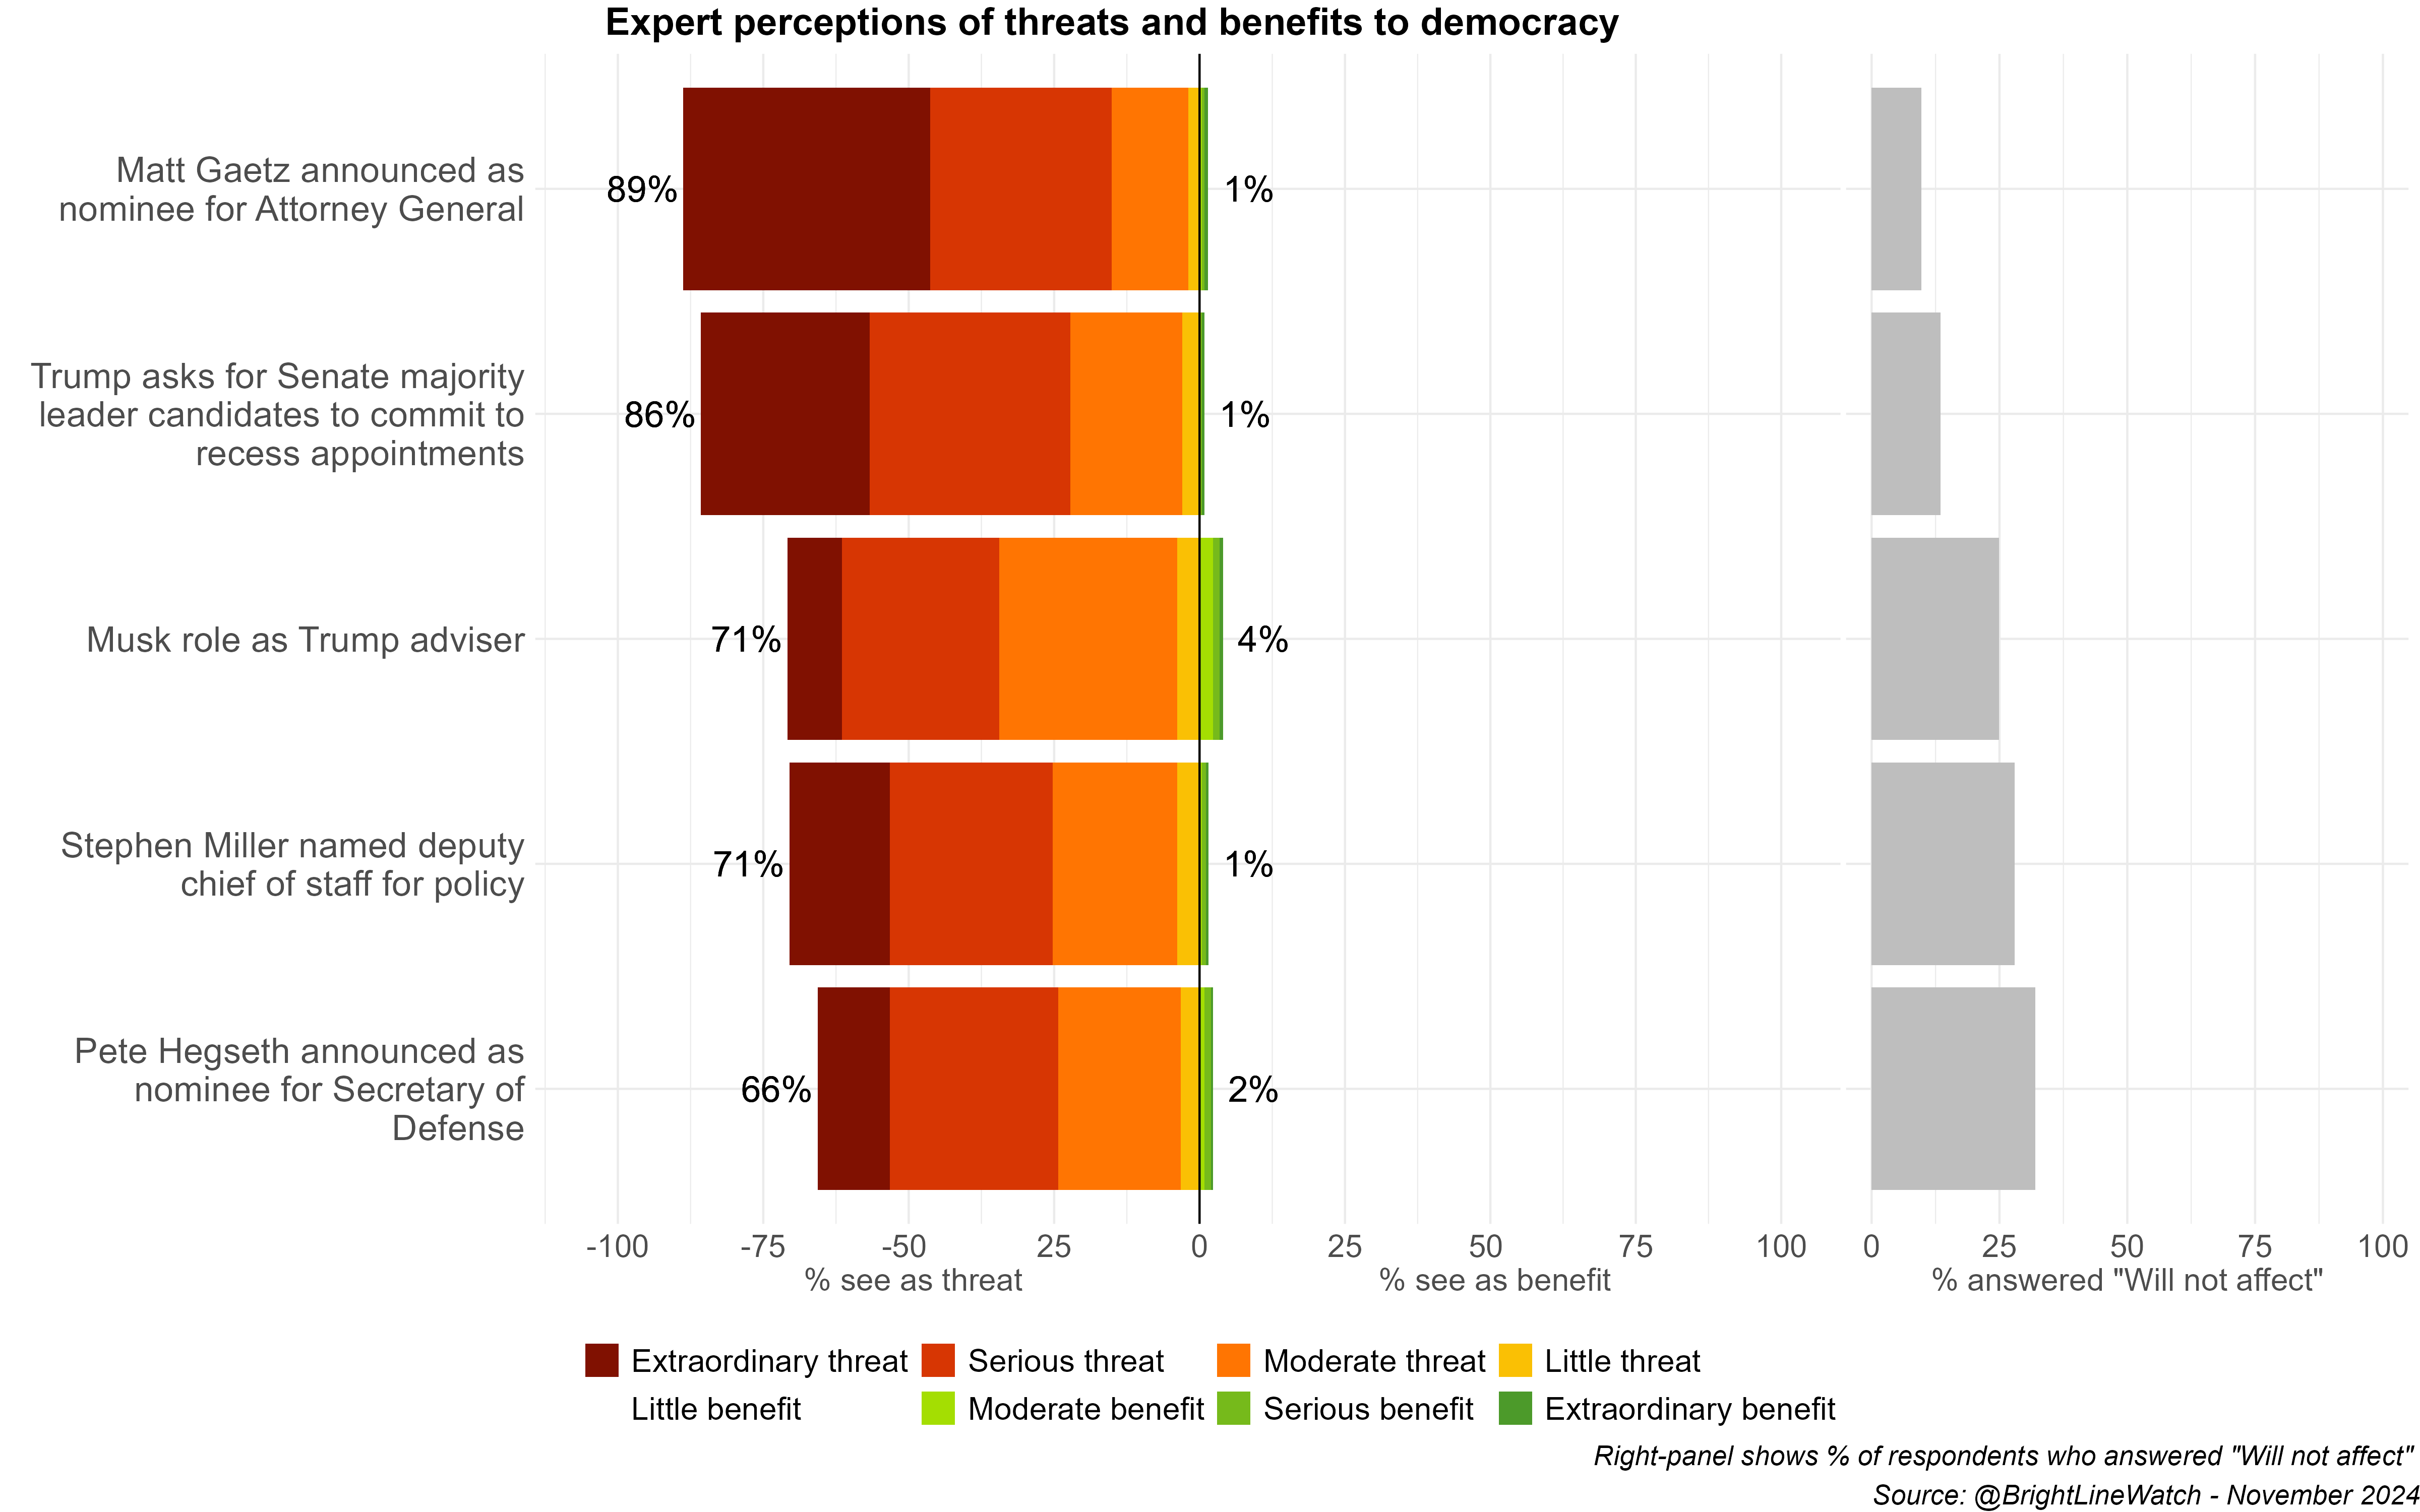
Experts expressed the greatest concern about Gaetz’s nomination as Attorney General, with 89% identifying it as a threat to democracy, including 74% who said it poses an extraordinary or serious threat. These concerns may partially explain why Gaetz was withdrawn in favor of Pam Biondi. Concerns were nearly as grave about Trump’s request for recess appointments, which 86% of experts said poses a threat to democracy (64% extraordinary or serious). It is not known yet to what extent new Senate Majority Leader John Thune will go along with Trump’s demands. Concerns were also widespread about Pete Hegseth’s nomination as Secretary of Defense, Stephen Miller’s role as deputy chief of staff for policy, and Elon Musk’s role as an informal Trump advisor; 66–72% of experts rate these appointments as threats to democracy, but fewer see the threats as extraordinary or serious. (We note, however, that the survey was fielded before concerns about Hegseth became widespread.)
Assessing the likelihood of future events
We also asked our expert sample to rate the probability of future events and to assess their potential consequences for American democracy:
- The Trump administration directs the Department of Justice to suspend the prosecution of at least one person accused of crimes related to the 2020 election or the events of January 6, 2021.
- Trump issues a pardon to himself for any federal charges he faces.
- Trump attempts to stay in power beyond the end of his term in office in January 2029.
- The Trump administration directs the Department of Justice to investigate Joe Biden or another leading Democrat.
- The Trump administration seeks to repeal and replace the Affordable Care Act (Obamacare).
- The Trump administration withdraws the U.S. from NATO.
- The Trump administration detains and deports millions of undocumented immigrants.
- The Trump administration fires tens of thousands of civil servants who work for federal government agencies.
- Trump’s appointees use the powers of the Federal Communications Commission to challenge the broadcast license of one or more media outlets.
- The Senate parliamentarian is removed by June 30, 2025.
- An anti-Trump rally or protest attracts more than 100,000 people to Washington, DC by January 31, 2025.
- Trump creates a board with the power to review generals and admirals and to recommend removals of them.
- Before Trump takes office, the Justice Department drops the case against him for allegedly retaining classified documents after leaving the presidency in 2021.
- Before Trump takes office, the Justice Department drops the case against him for allegedly participating in criminal conspiracies in his efforts to overturn the 2020 presidential election.
The figure below reports the median estimate and the distribution of estimates for each scenario among our expert respondents on a 0–100% scale. Items are listed in descending order of estimated median probability.
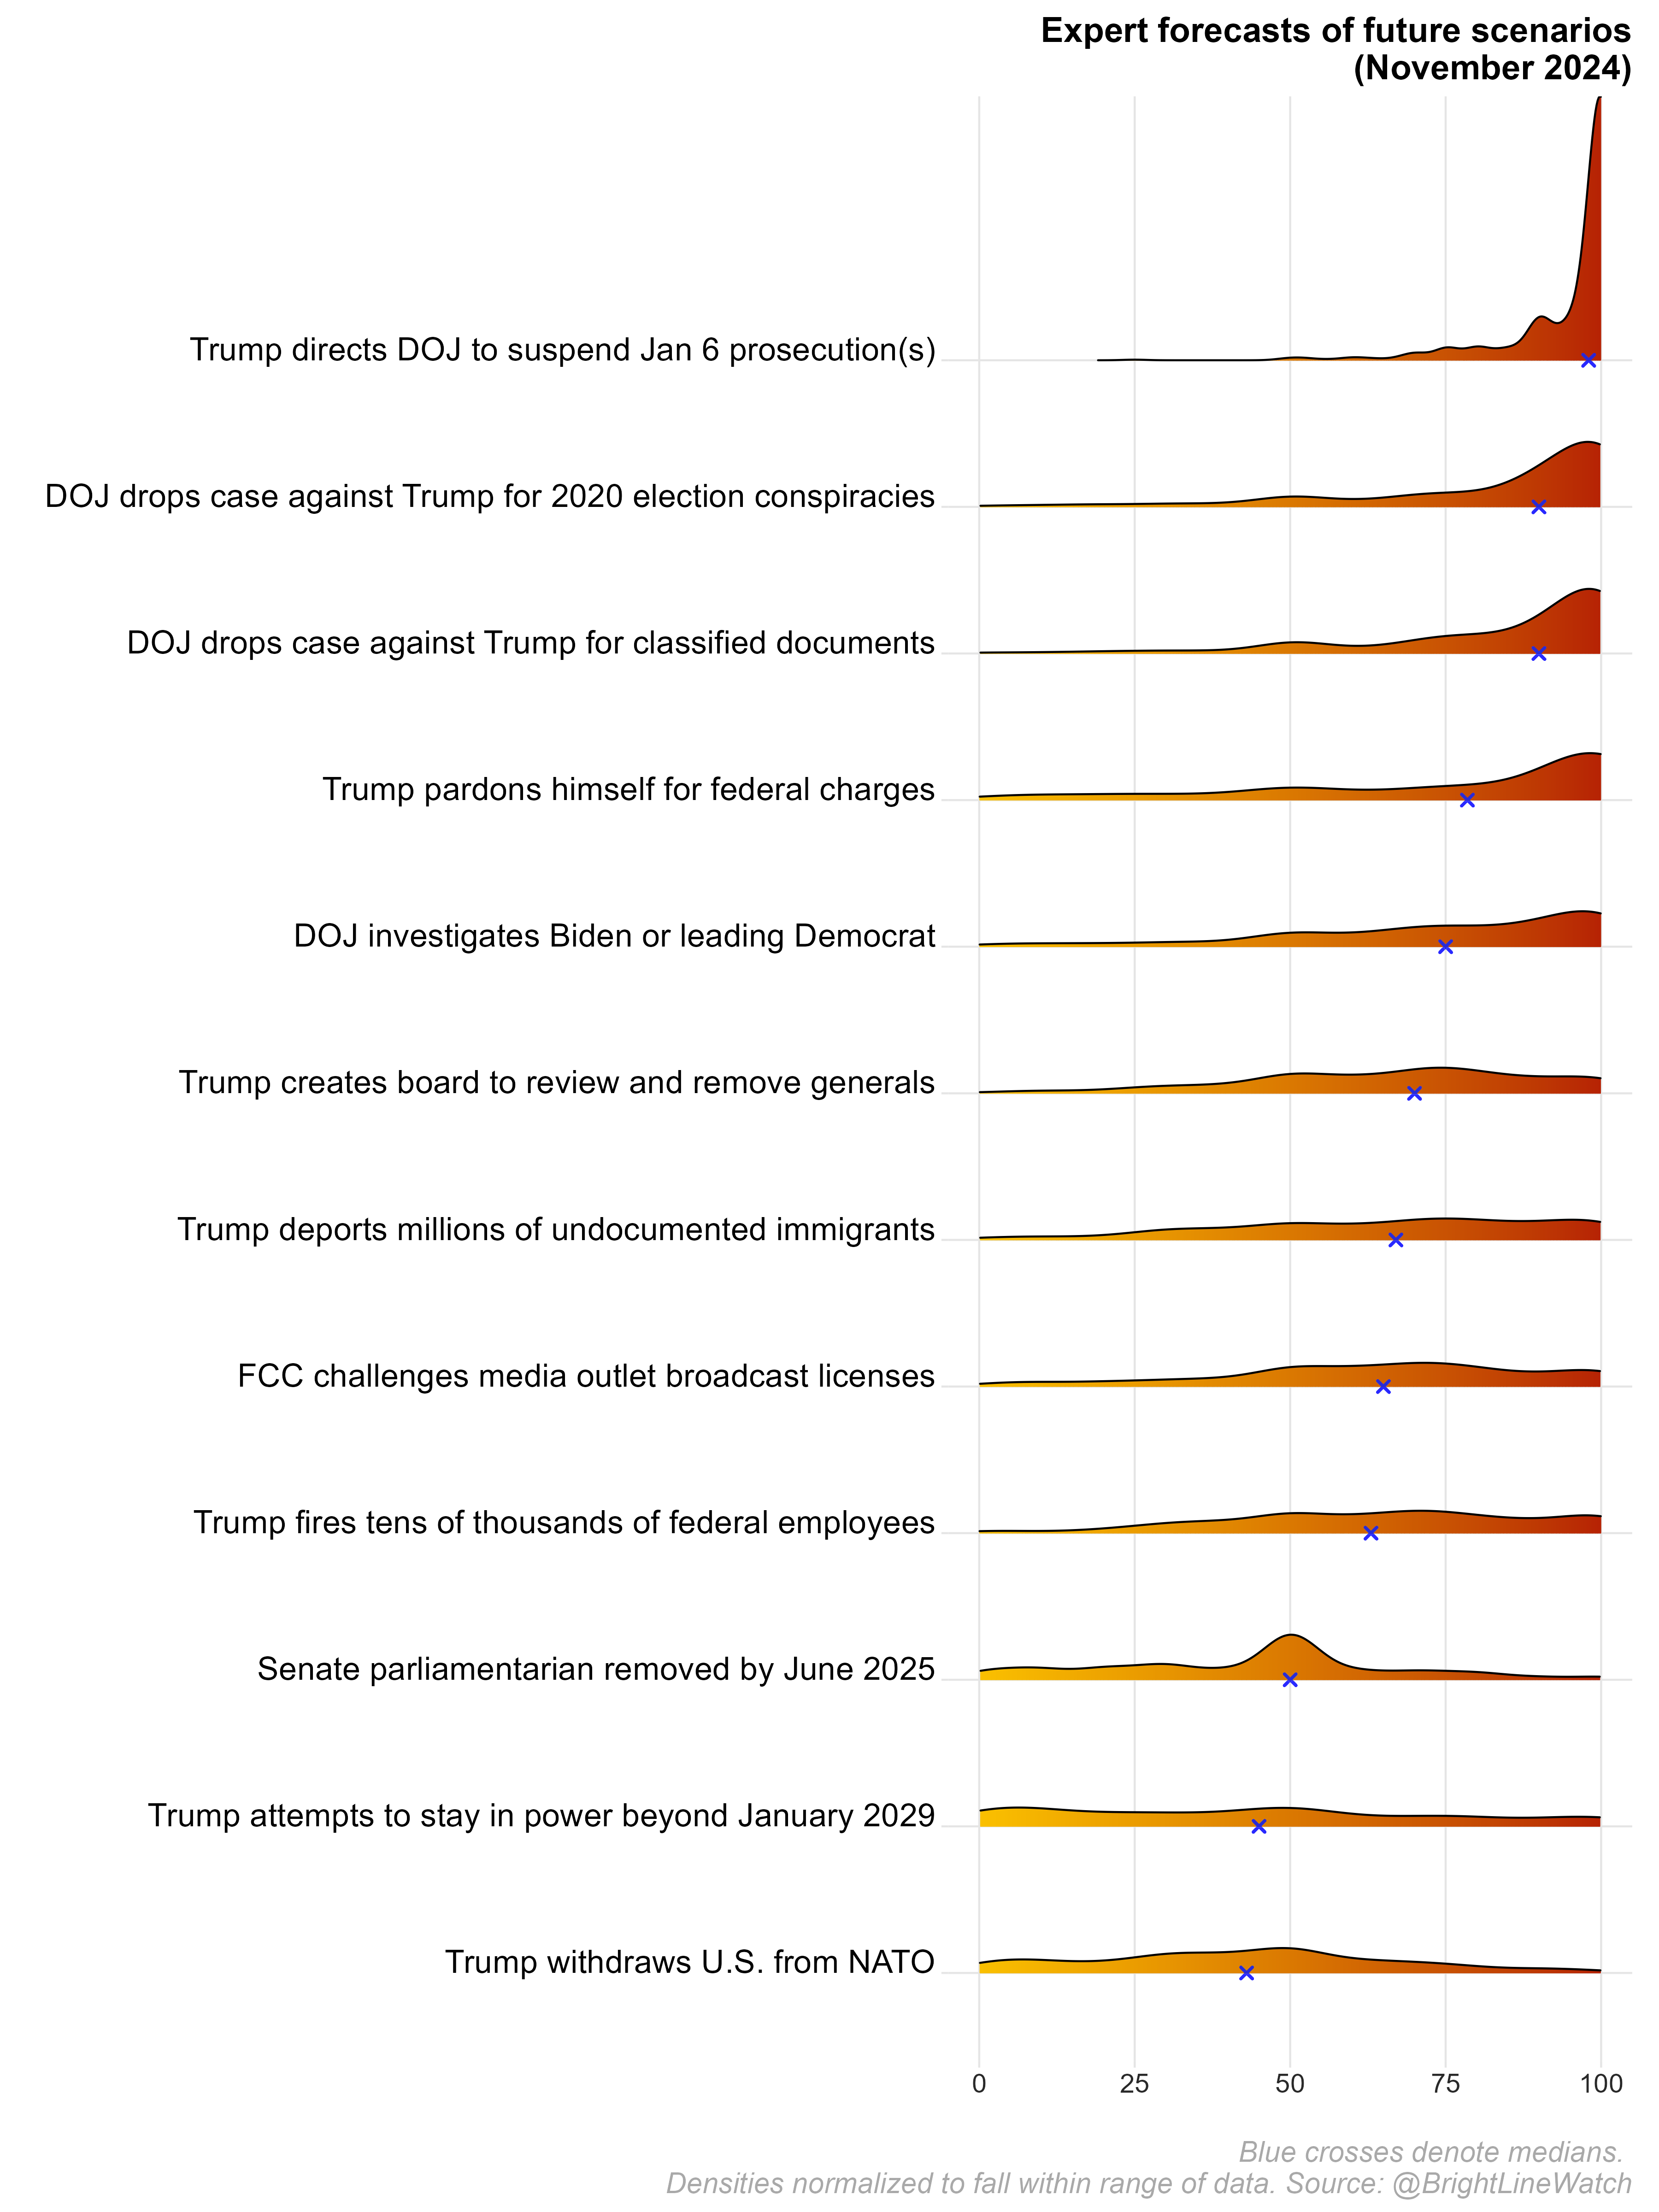
The actions that experts see as most likely all relate to prosecutions and judicial authority. It is almost universally expected that Trump will suspend prosecutions for actions related to January 6, 2021 (median estimate 98%) and that the Department of Justice to drop the cases brought by special counsel Jack Smith against him and his co-conspirators for efforts to overturn the 2020 election and for mishandling of classified documents (both 90%; both already took place so we exclude them from analyses of forecast data below). Experts also think it is very likely that Trump will use the presidential pardon authority to pardon himself (79%, down from 90% in February 2024), and that he will instruct the DOJ to investigate Joe Biden or other leading Democrats (75%, down from 90% in February).
The next group of items consists of the other events that experts think are as likely to happen or not or more (meaning they assign a median estimate of 50% or greater). These include creating a board to review and remove generals (70%), deporting millions of undocumented immigrants (67%), Trump appointees challenging media broadcast licenses at the FCC (65%), Trump firing tens of thousands of federal employees (63%), and the Senate parliamentarian being removed by June 2025 (50%).
Finally, experts think there is slightly less than a 50% chance Trump will try to stay in power beyond a second term (45%, down from 60% in February) or withdraw the U.S. from NATO (43%, down from 50% in February).
However, as we show in a new report with Andrew Little, experts tend to be overly pessimistic in these forecasts, exaggerating the frequency of negative events relative to the rate at which they actually occur. Across four prior expert surveys, we find that experts rated negative events as having a 44% chance of happening but only 22% of them took place. At the aggregate level, expert forecasts are more predictive but still too pessimistic. Forecasts with a median of less than 75% overstated the likelihood of negative events (only one event with a median forecast of less than 50% took place), but those with a median greater than 75% were very accurate (all but two occurred). When we adjust median expert forecasts for these tendencies, however, they are highly accurate (a 58% reduction in error versus random chance).
The figure below shows how the median forecasts above change when using this adjustment procedure to correct for excess pessimism.
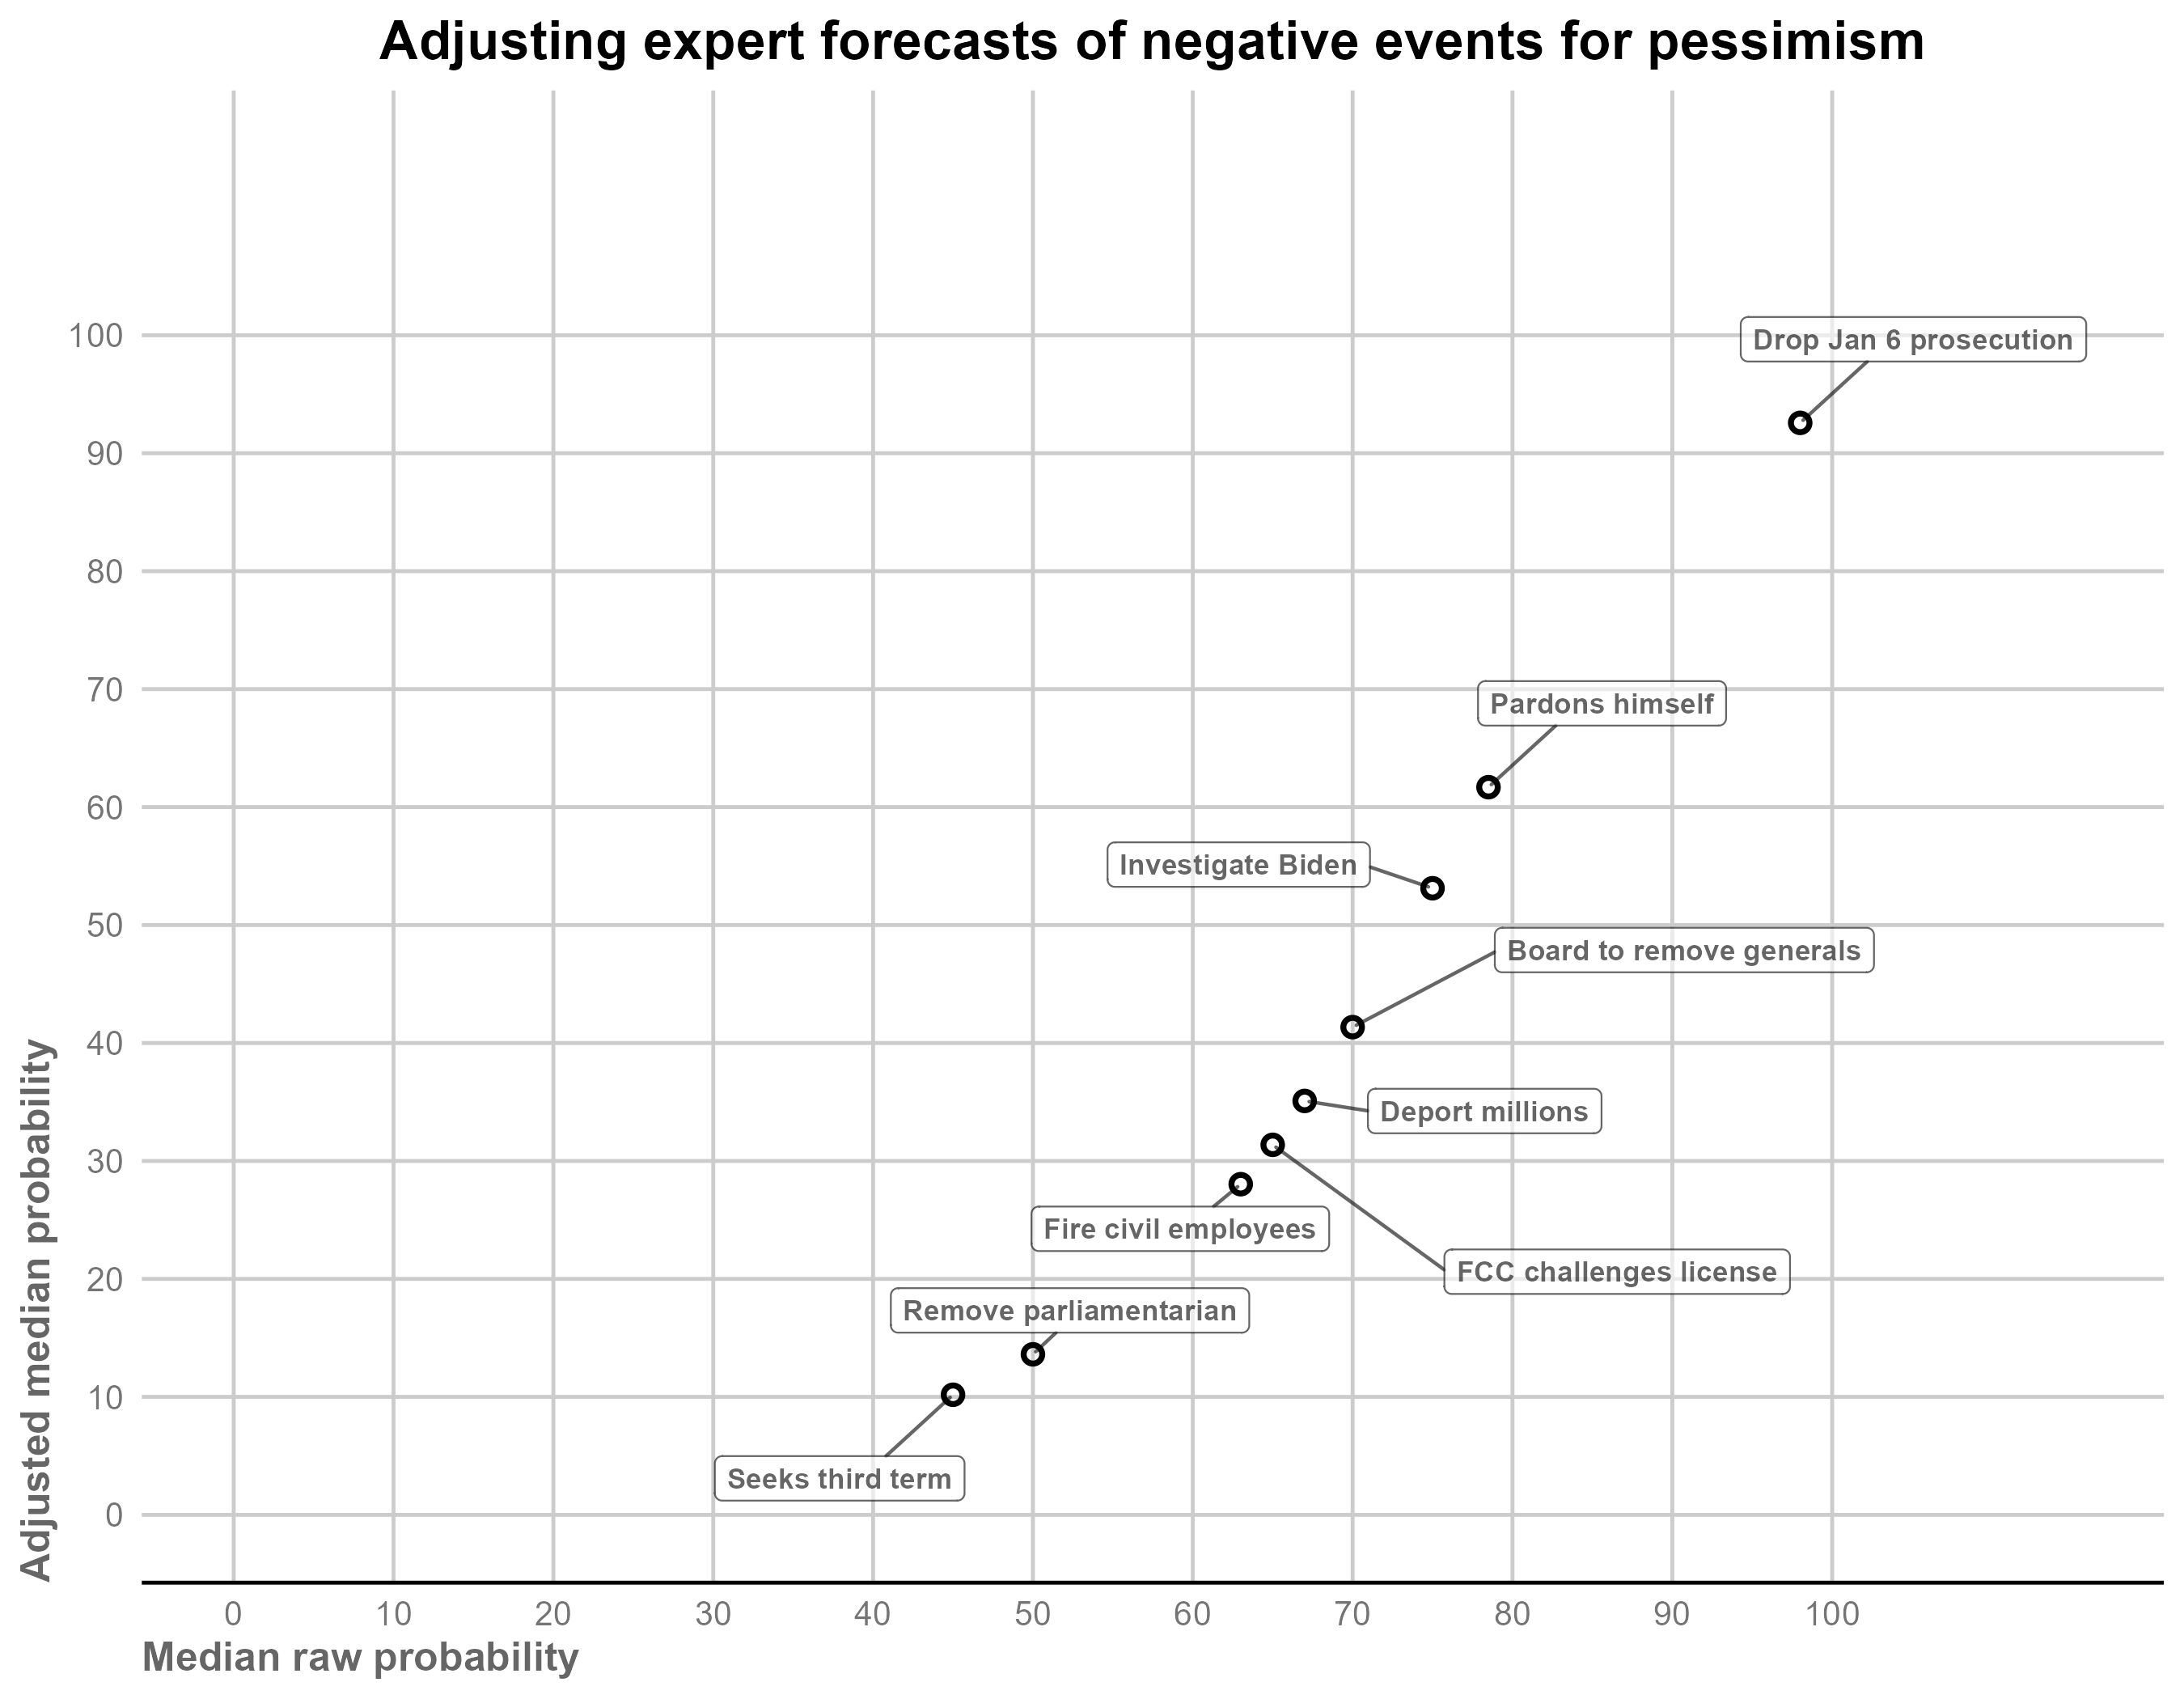
For events assigned a very high median probability (e.g., Trump directing the Department of Justice to suspend at least one prosecution related to the 2020 election or January 6), the adjusted forecast is essentially the same as the raw median. However, other events are adjusted downward substantially. For instance, the probability of Trump creating a board to review and remove generals decreases from 70% to 41% and the Senate parliamentarian being removed by June 2025 goes from 50% to 14%. We use these adjusted forecasts in the analysis below.
The threats and benefits to democracy of possible future events
We next consider how experts assess the threats or benefits to American democracy posed by the possible future events described above. We first note that two took place since our survey was fielded. In total, 75% of experts said the Department of Justice dropping the 2020 election case against Trump would be a threat to democracy and 69% said dropping the classified documents case would be a threat to democracy. These events already occurred — Special Counsel Jack Smith is dropping both before Trump takes office.
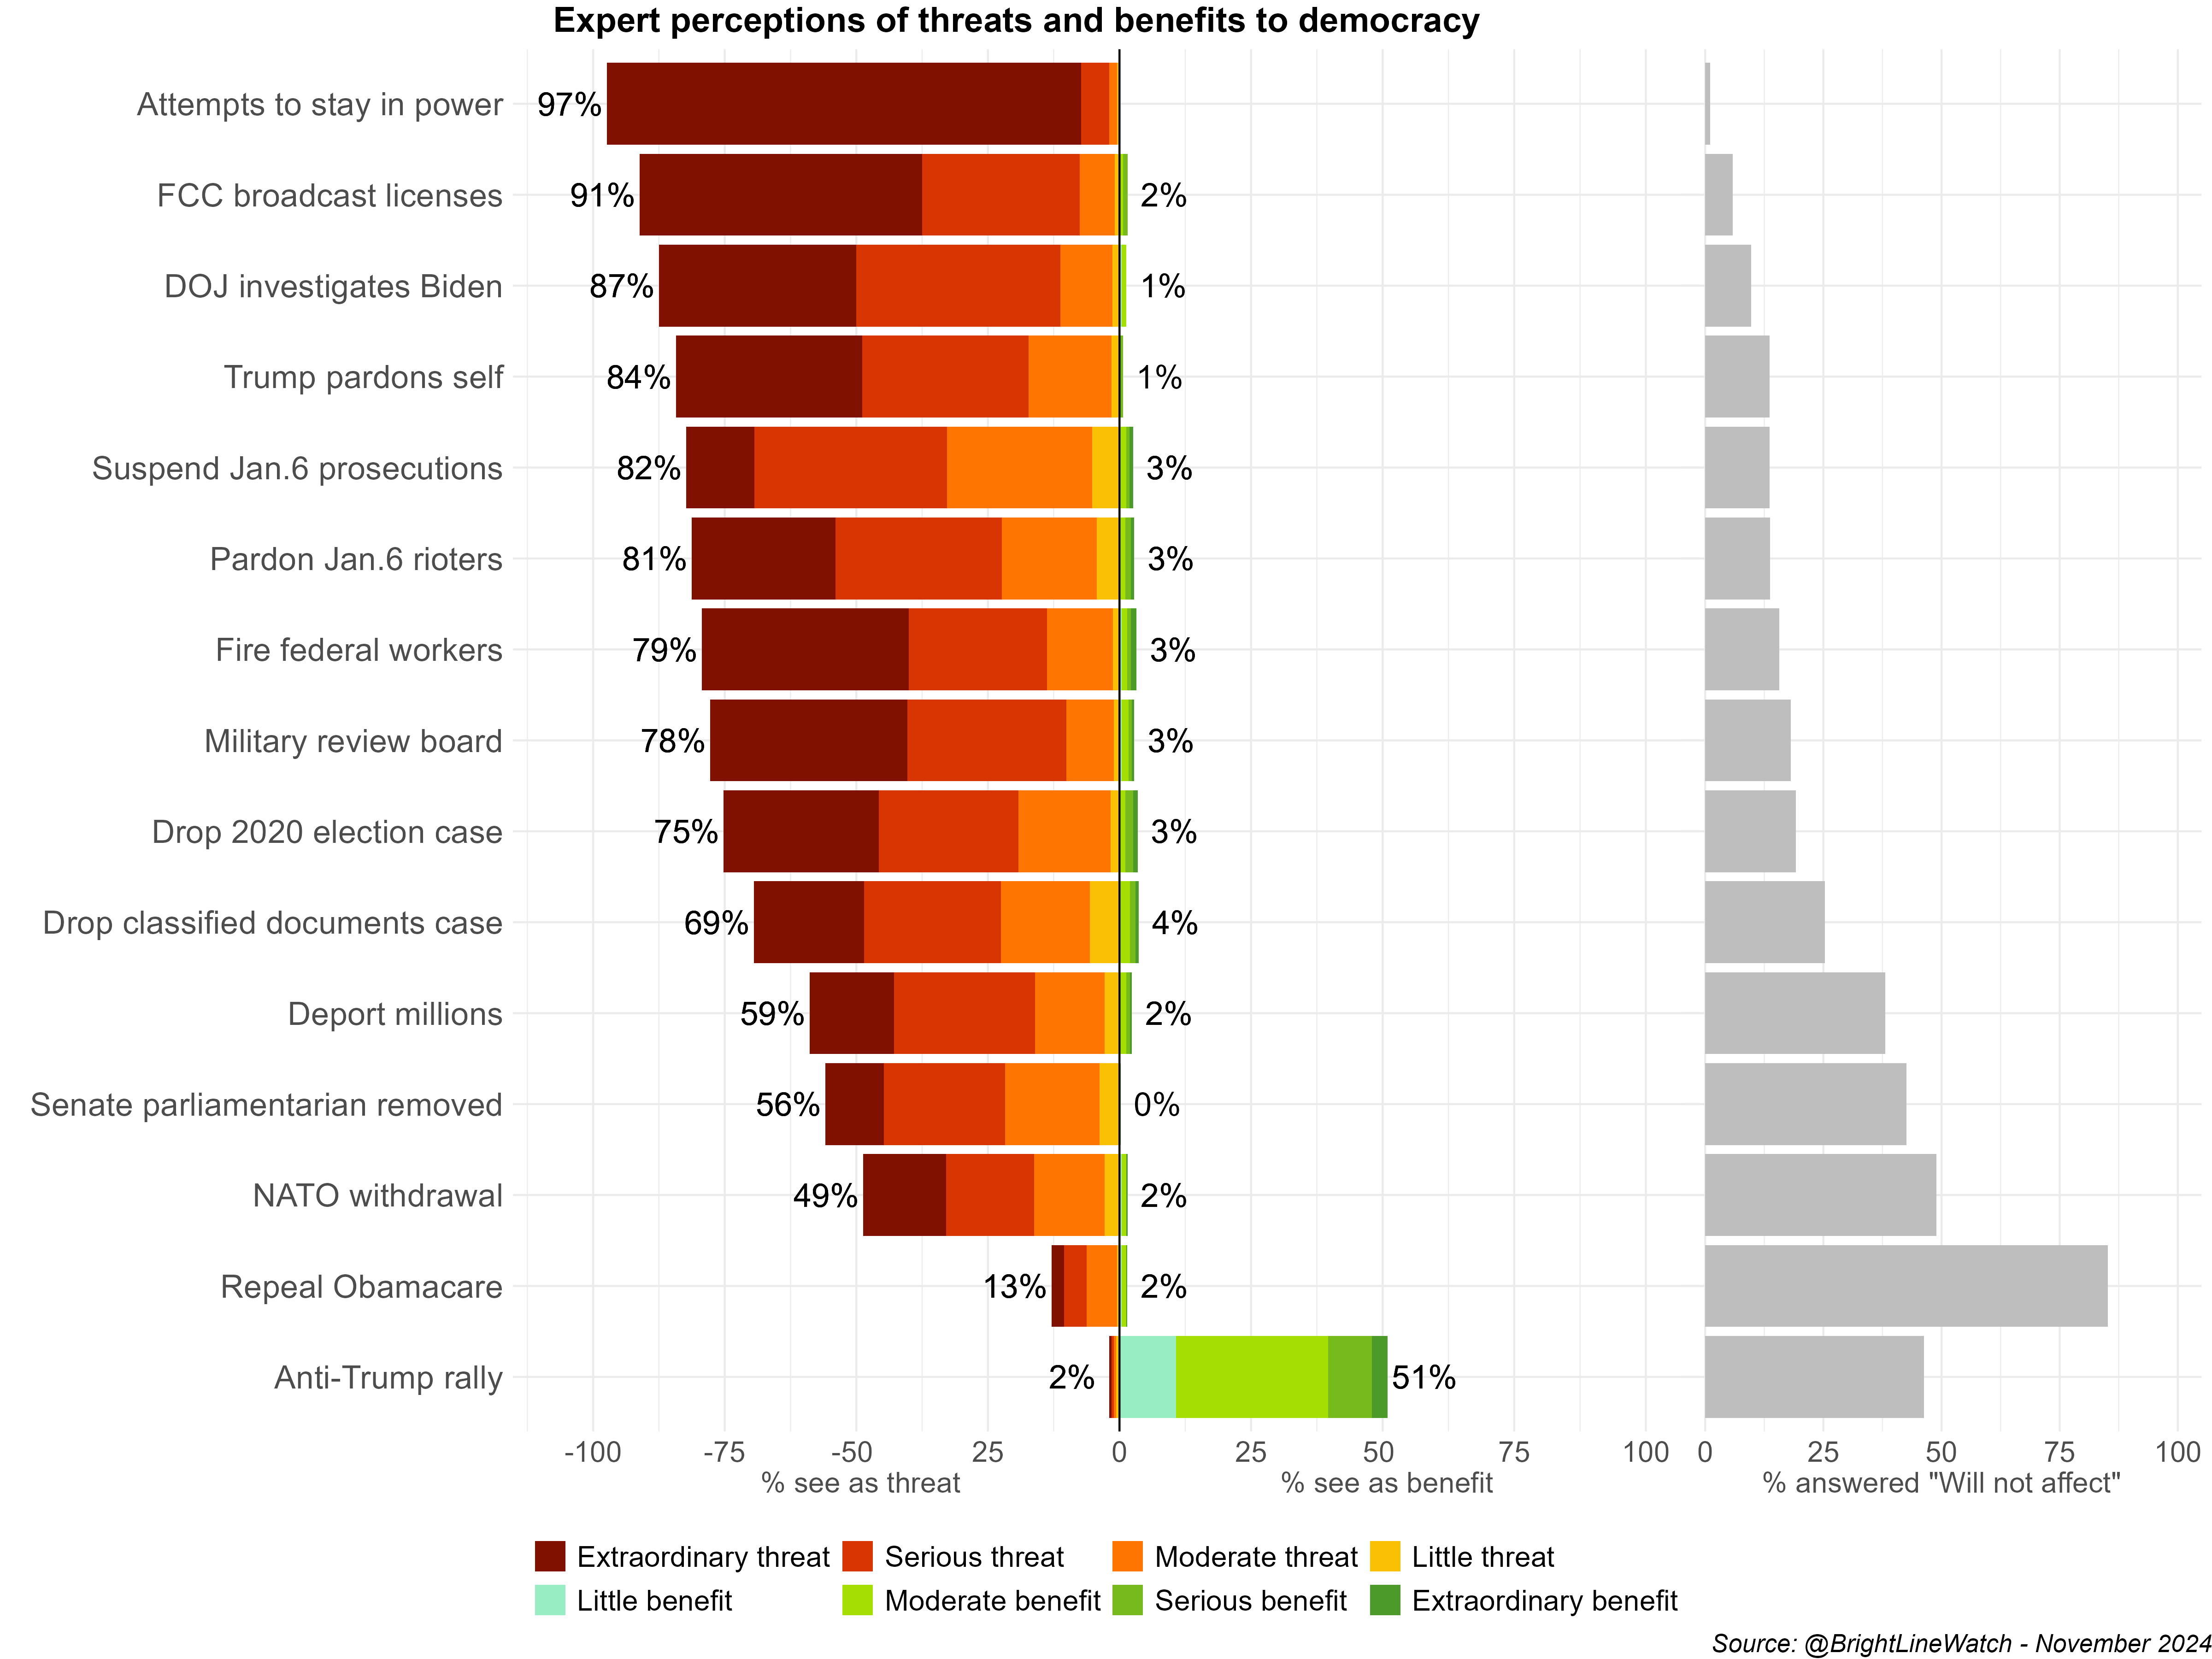
Among possible future events, the most concerning to experts is Trump attempting to stay in power beyond the end of his term in January 2029, which was universally rated as a threat to American democracy, including nine in ten who said it would be an extraordinary threat. Experts are greatly concerned about a number of other possible events, including the threats posed by possible events such as challenges to media licenses (91%), DOJ investigations of leading Democrats (87%), and pardons of January 6 rioters (81%). In total, eight are rated as a threat to democracy by 75% of experts or more. Experts are more divided over whether deportation (59%), removal of the Senate parliamentarian (56%), or NATO withdrawal (49%) would threaten democracy. Finally, very few rate repeal of the Affordable Care Act as a threat (13%).
We directly juxtapose expert assessments of the probability of events with the proportion who rate the event as posing a serious or extraordinary threat to American democracy.
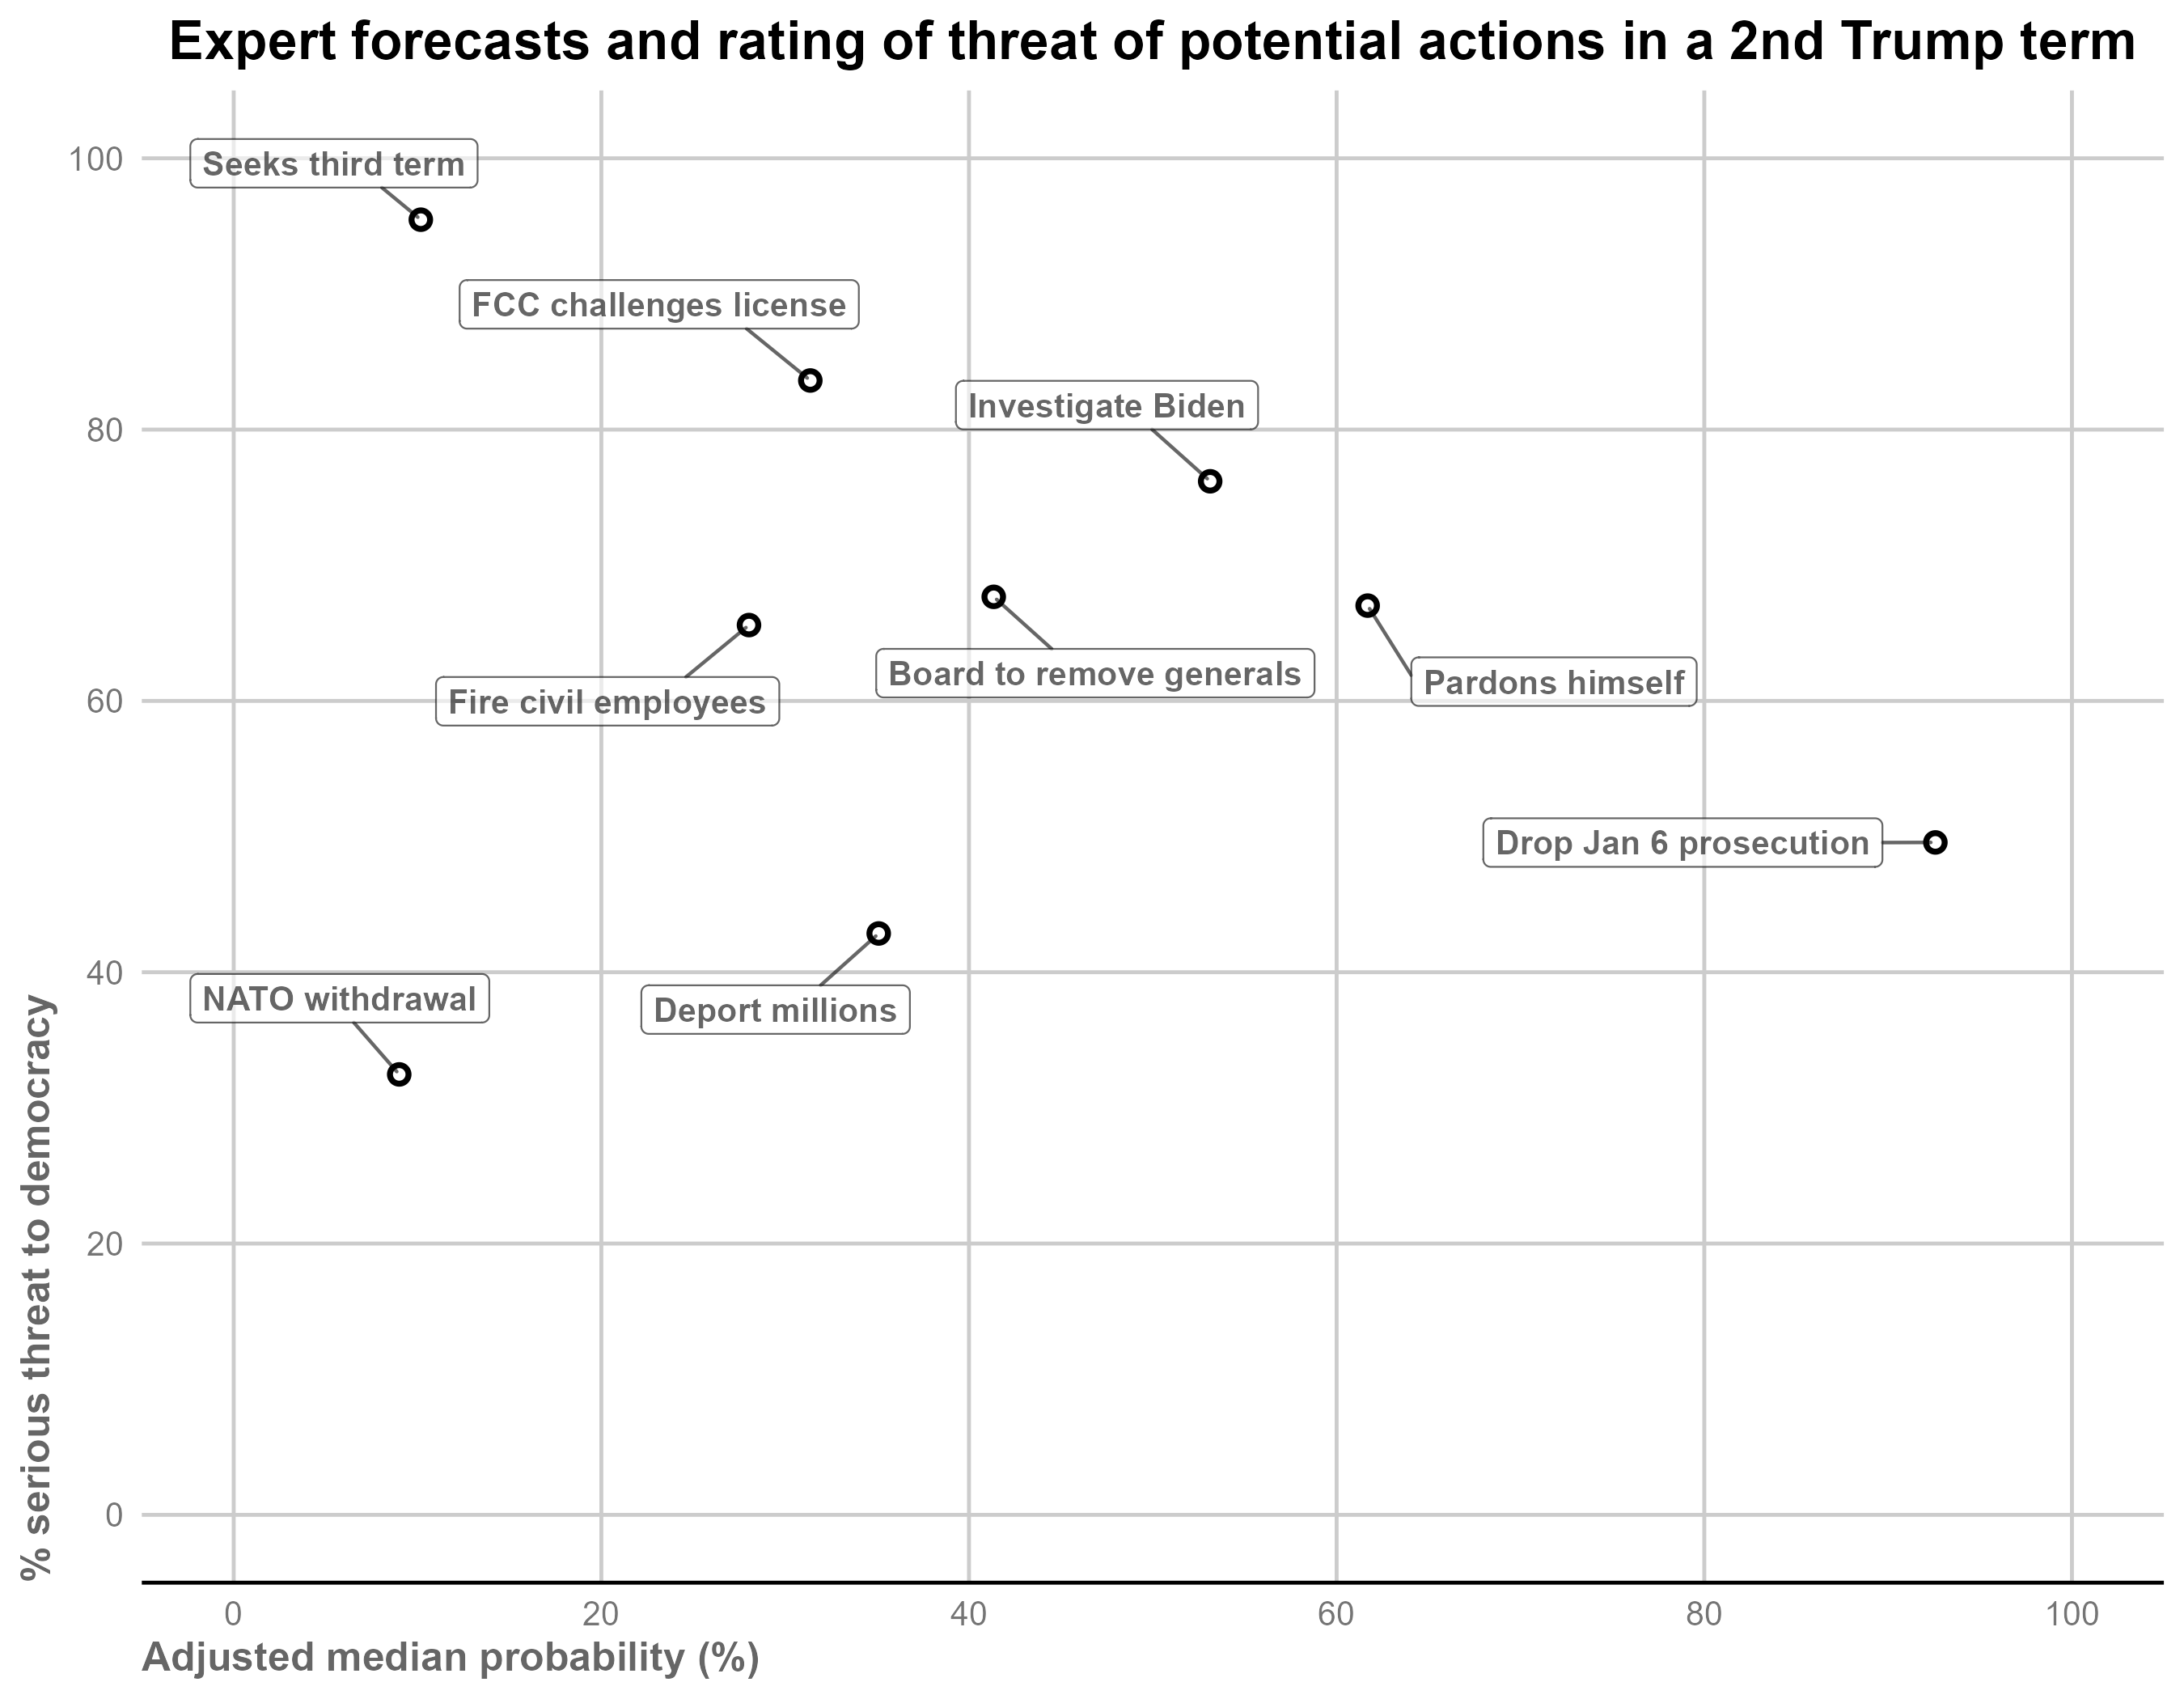
We note three events that our adjusted expert forecasts suggest are more likely than not which more than half of experts rate as serious or extraordinary threats to democracy: dropping prosecutions related to efforts to overturn the 2020 election or January 6, a Trump self-pardon, and investigating Biden or other leading Democrats.
Finally, we consider the incentives to engage in these actions by seeing the support they attract among Republican identifiers and leaners, the partisan constituency whose preferences are most likely to affect Trump’s behavior, as well as Democratic identifiers and leaners.4
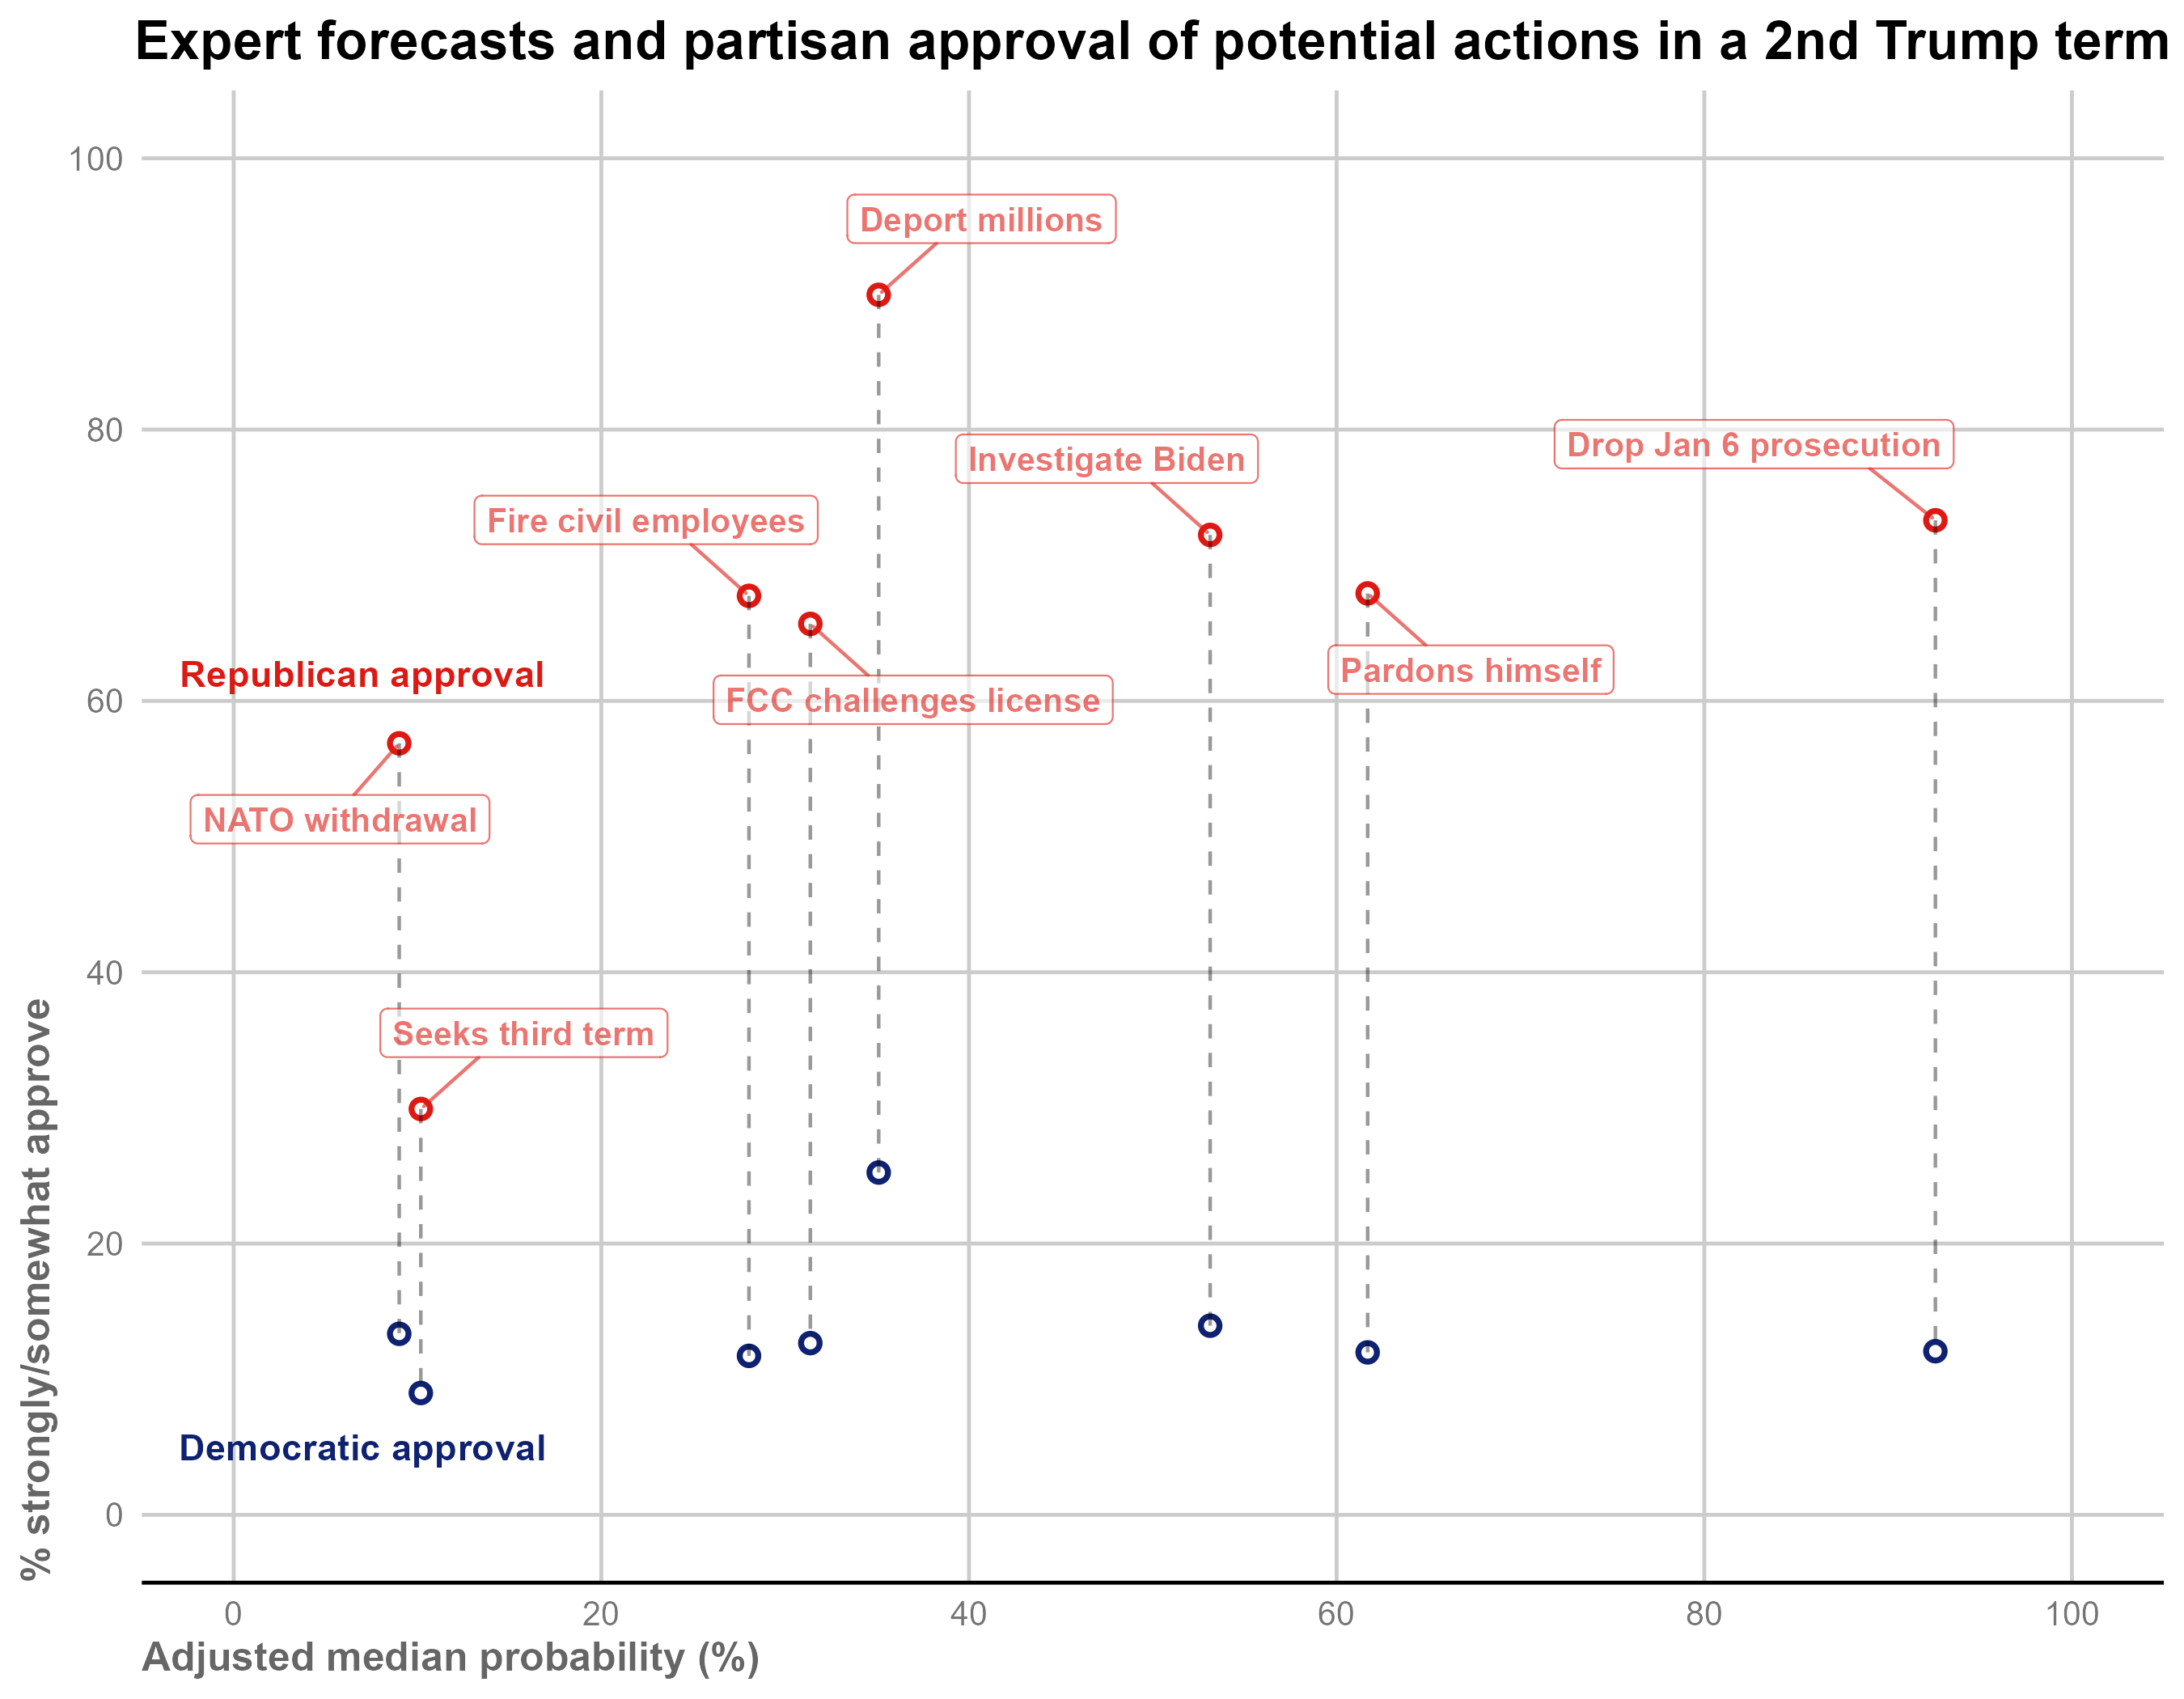
As the figure above shows, Trump’s party is highly supportive of the actions in question, including the ones rated as probable by experts (we found similar results in July 2024). Among the acts experts rated as most threatening, Republicans largely approve of the Trump administration directing the DOJ to suspend the prosecution of January 6 rioters (84%), investigating Joe Biden or other leading Democrats (73%, down from 83% in February), Trump pardoning himself (68%), firing tens of thousands of federal civil servants (68%), and challenging broadcast licenses (62%). The only action that is unpopular among Republicans is Trump trying to stay in office after his term (30%). (Not surprisingly, Democrats overwhelmingly disapprove of almost all of the actions in question.)
Ratings of the state of U.S. democracy
As in each Bright Line Watch survey, we asked both expert and public respondents to rate the overall performance of U.S. democracy on a 0–100 scale.
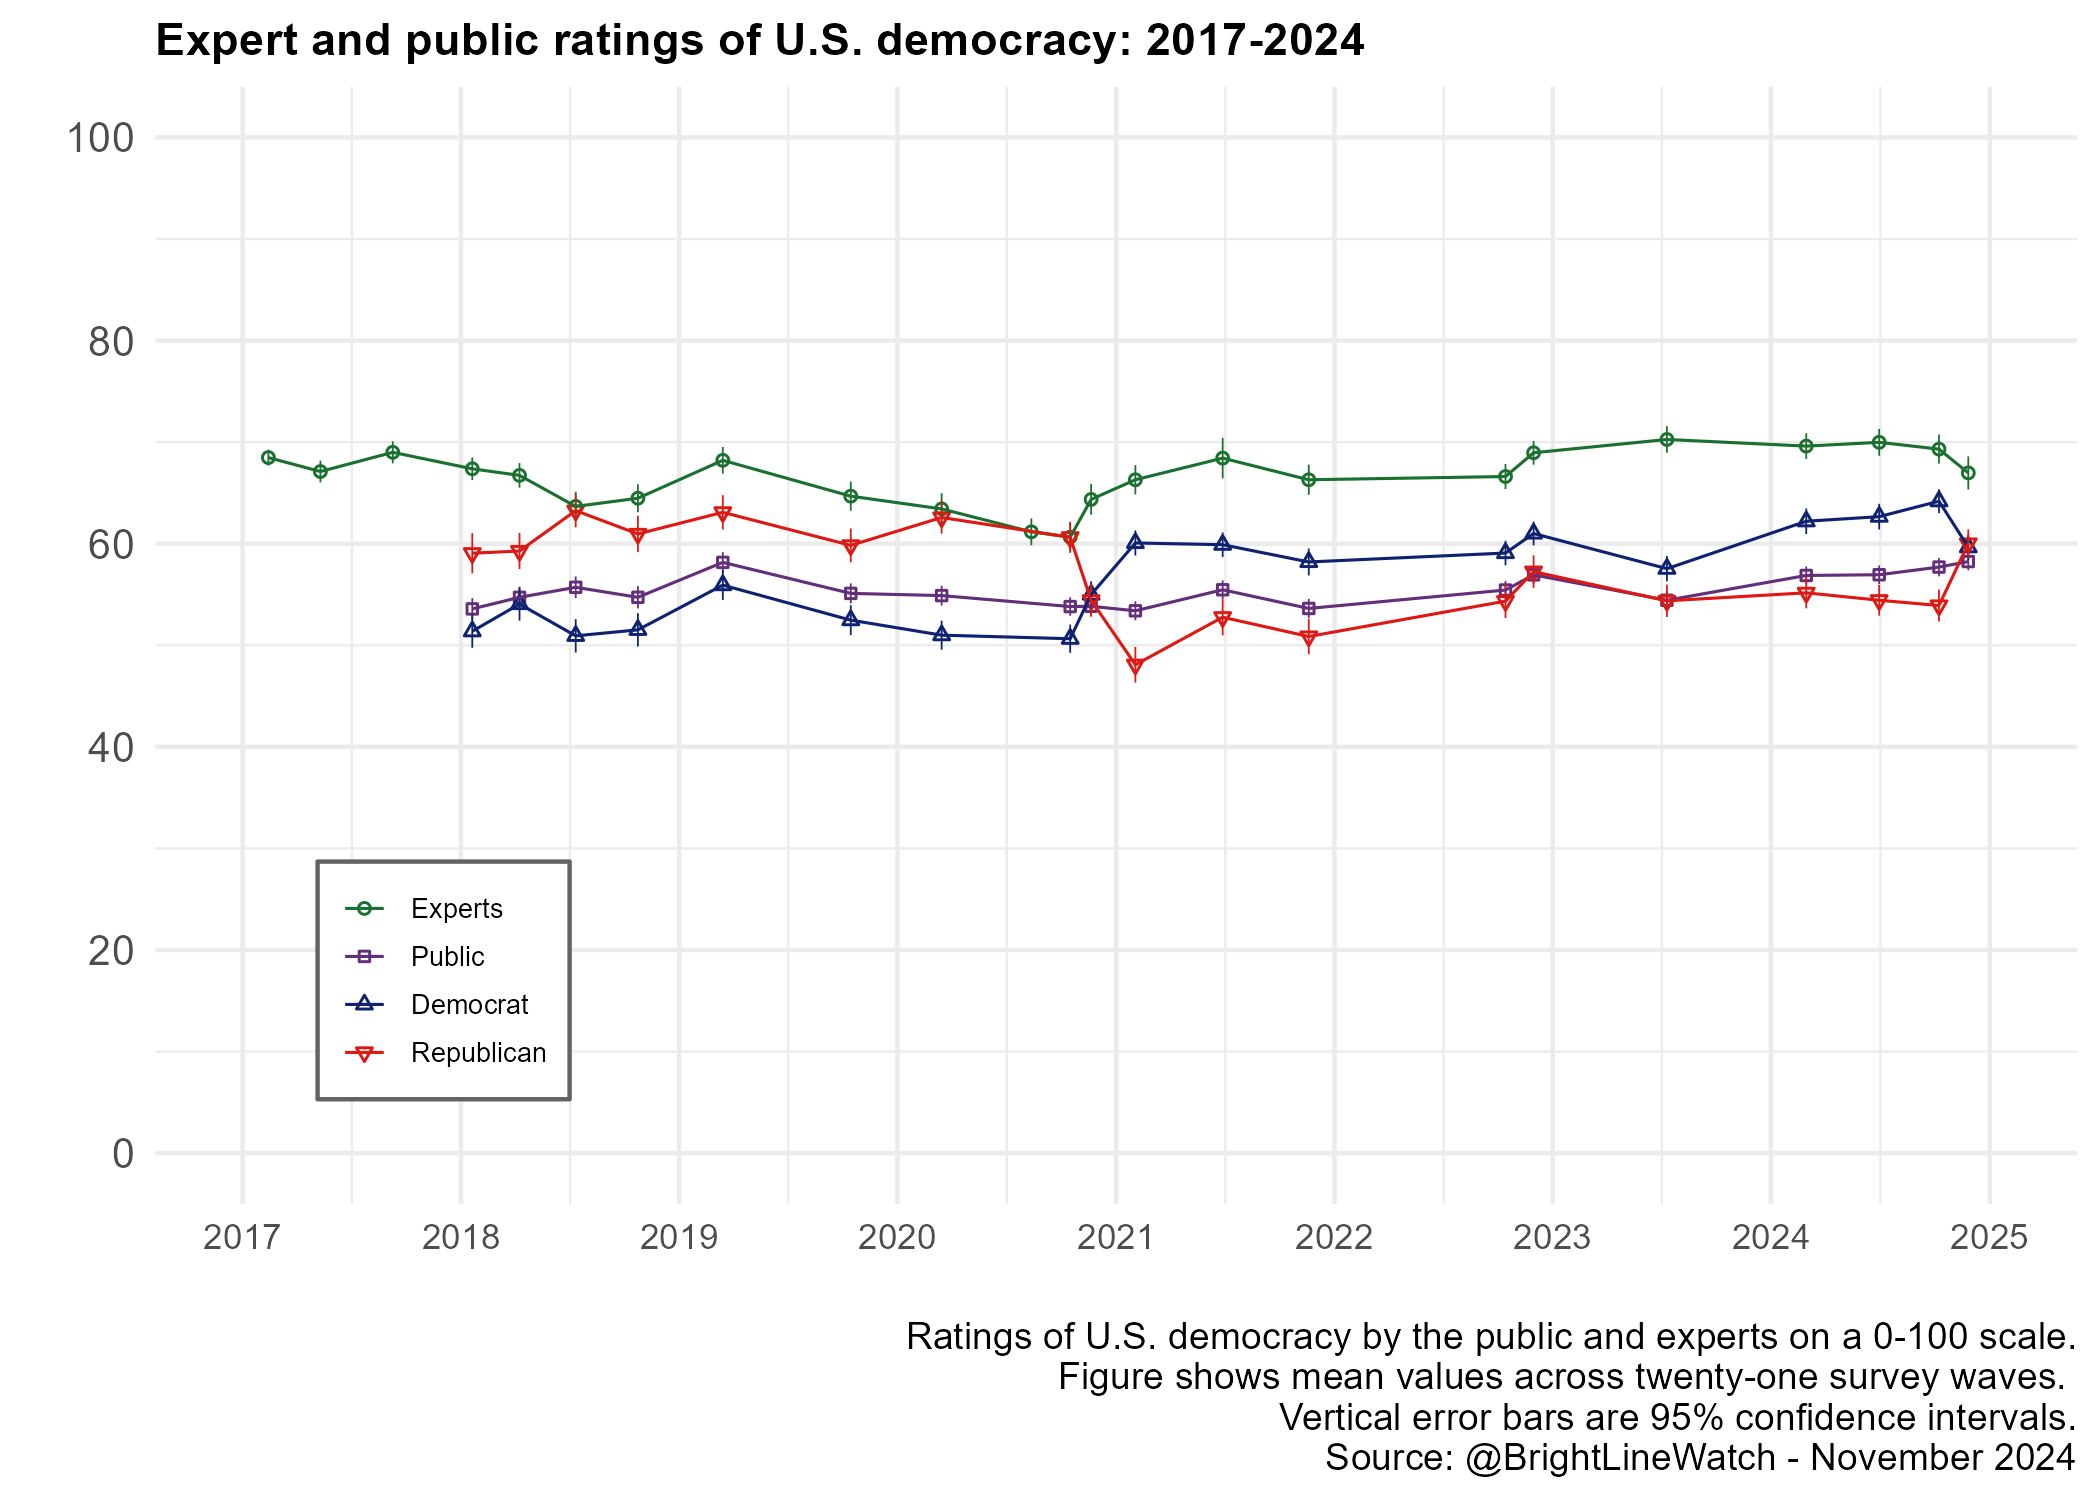
Expert ratings declined from our September pre-election survey, but only slightly, decreasing from 70 to 67. The outcome of the election also produced the expected pattern of increased optimism among the winners and pessimism among the losers, although the increase among the former was larger than the decline among the latter. As a result, Democrats and Republicans converged, with Republicans increasing from 54 to 60 and Democrats decreasing from 63 to 60 — a trend that resembles what we saw in November 2020. In that case, ratings of U.S. democracy among Trump approvers (the losing side) decreased from 60 to 55 and ratings among disapprovers (the winning side) increased from 48 to 53. (These trends continued afterward. By the time of our January-February 2021 survey, ratings among Trump disapprovers had increased to 58 and those among approvers had decreased to 47.)
We also asked participants to report the rating they would expect to give the U.S. on the same scale in 2027. It is instructive to compare those ratings from our post-election survey in November (when it was known Trump had won) with those they provided in our pre-election survey in October (when we asked the rating they expected to give in 2027 assuming a Trump win).5 We present both quantities in the figure below, disaggregating the public by party.

Across each group, projected 2027 democracy ratings are more positive after the election than before. The expert projection nudged upward by 5 points on the 100-point scale, from 48 to 53. The increase for the public is larger, at 10 points – 48 to 58 – and is driven by Democrats, whose projection for 2027 under a Trump administration was 32 in the October survey but rose to 51 in November. This shift may reflect Democrats’ worst fears about a Trump victory not being realized as well as people’s general difficulty in accurately predicting how they will feel in the future.
Appendix
Bright Line Watch conducted its twenty-third survey of academic experts and its twentieth survey of the general public from November 13–November 27, 2024. Our public sample consisted of 2750 participants from the YouGov panel who were selected and weighted to be representative of the U.S. adult population. We also surveyed 539 political science experts across a diverse range of subfields. Our email list was constructed from the faculty list of U.S. institutions represented in the online program of the 2016 American Political Science Association conference and updated by reviewing department websites and job placement records from Ph.D. programs in the period since.
All estimates shown in the report used weights provided by YouGov. Our expert sample is unweighted because we do not collect demographic data to protect anonymity. Error bars in our graphs represent 95% confidence intervals. Data are available here.
The figure below shows how perceptions that Joe Biden was the rightful winner of the 2020 election have changed over time overall and by respondent partisanship.
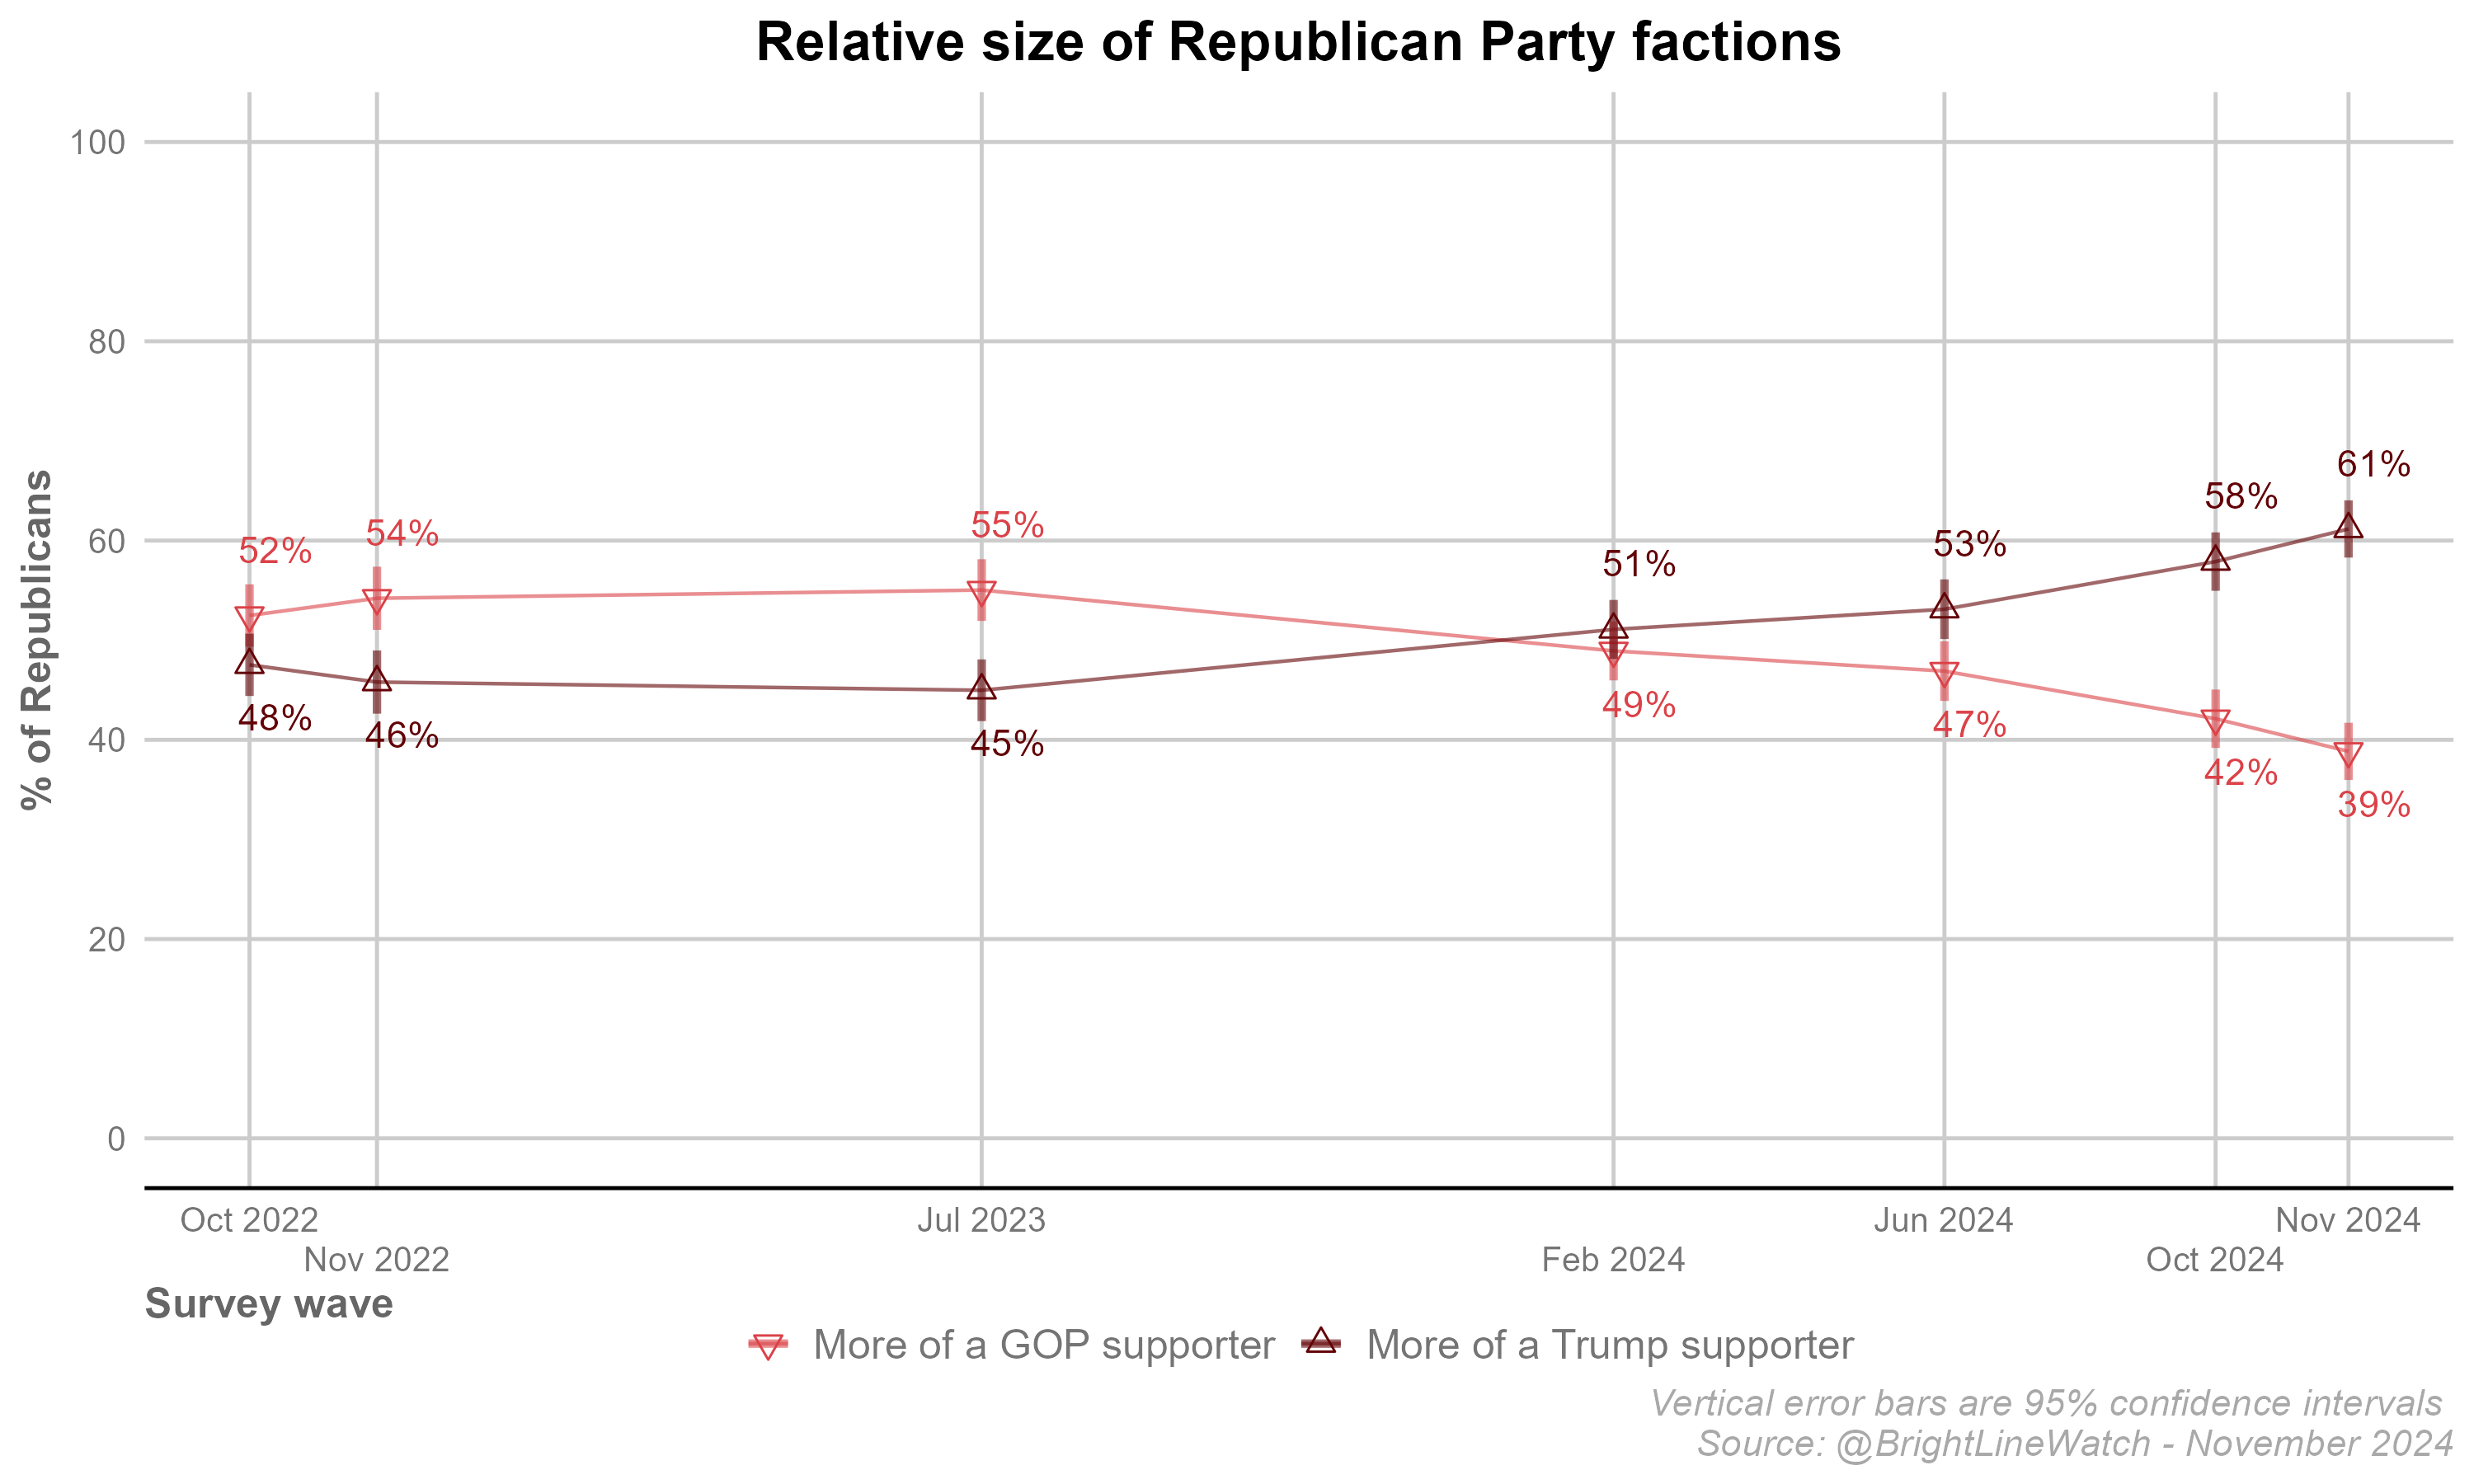
We report below the share of Republicans over time who identify as more of a supporter of the Republican Party versus more of a supporter of Donald Trump.
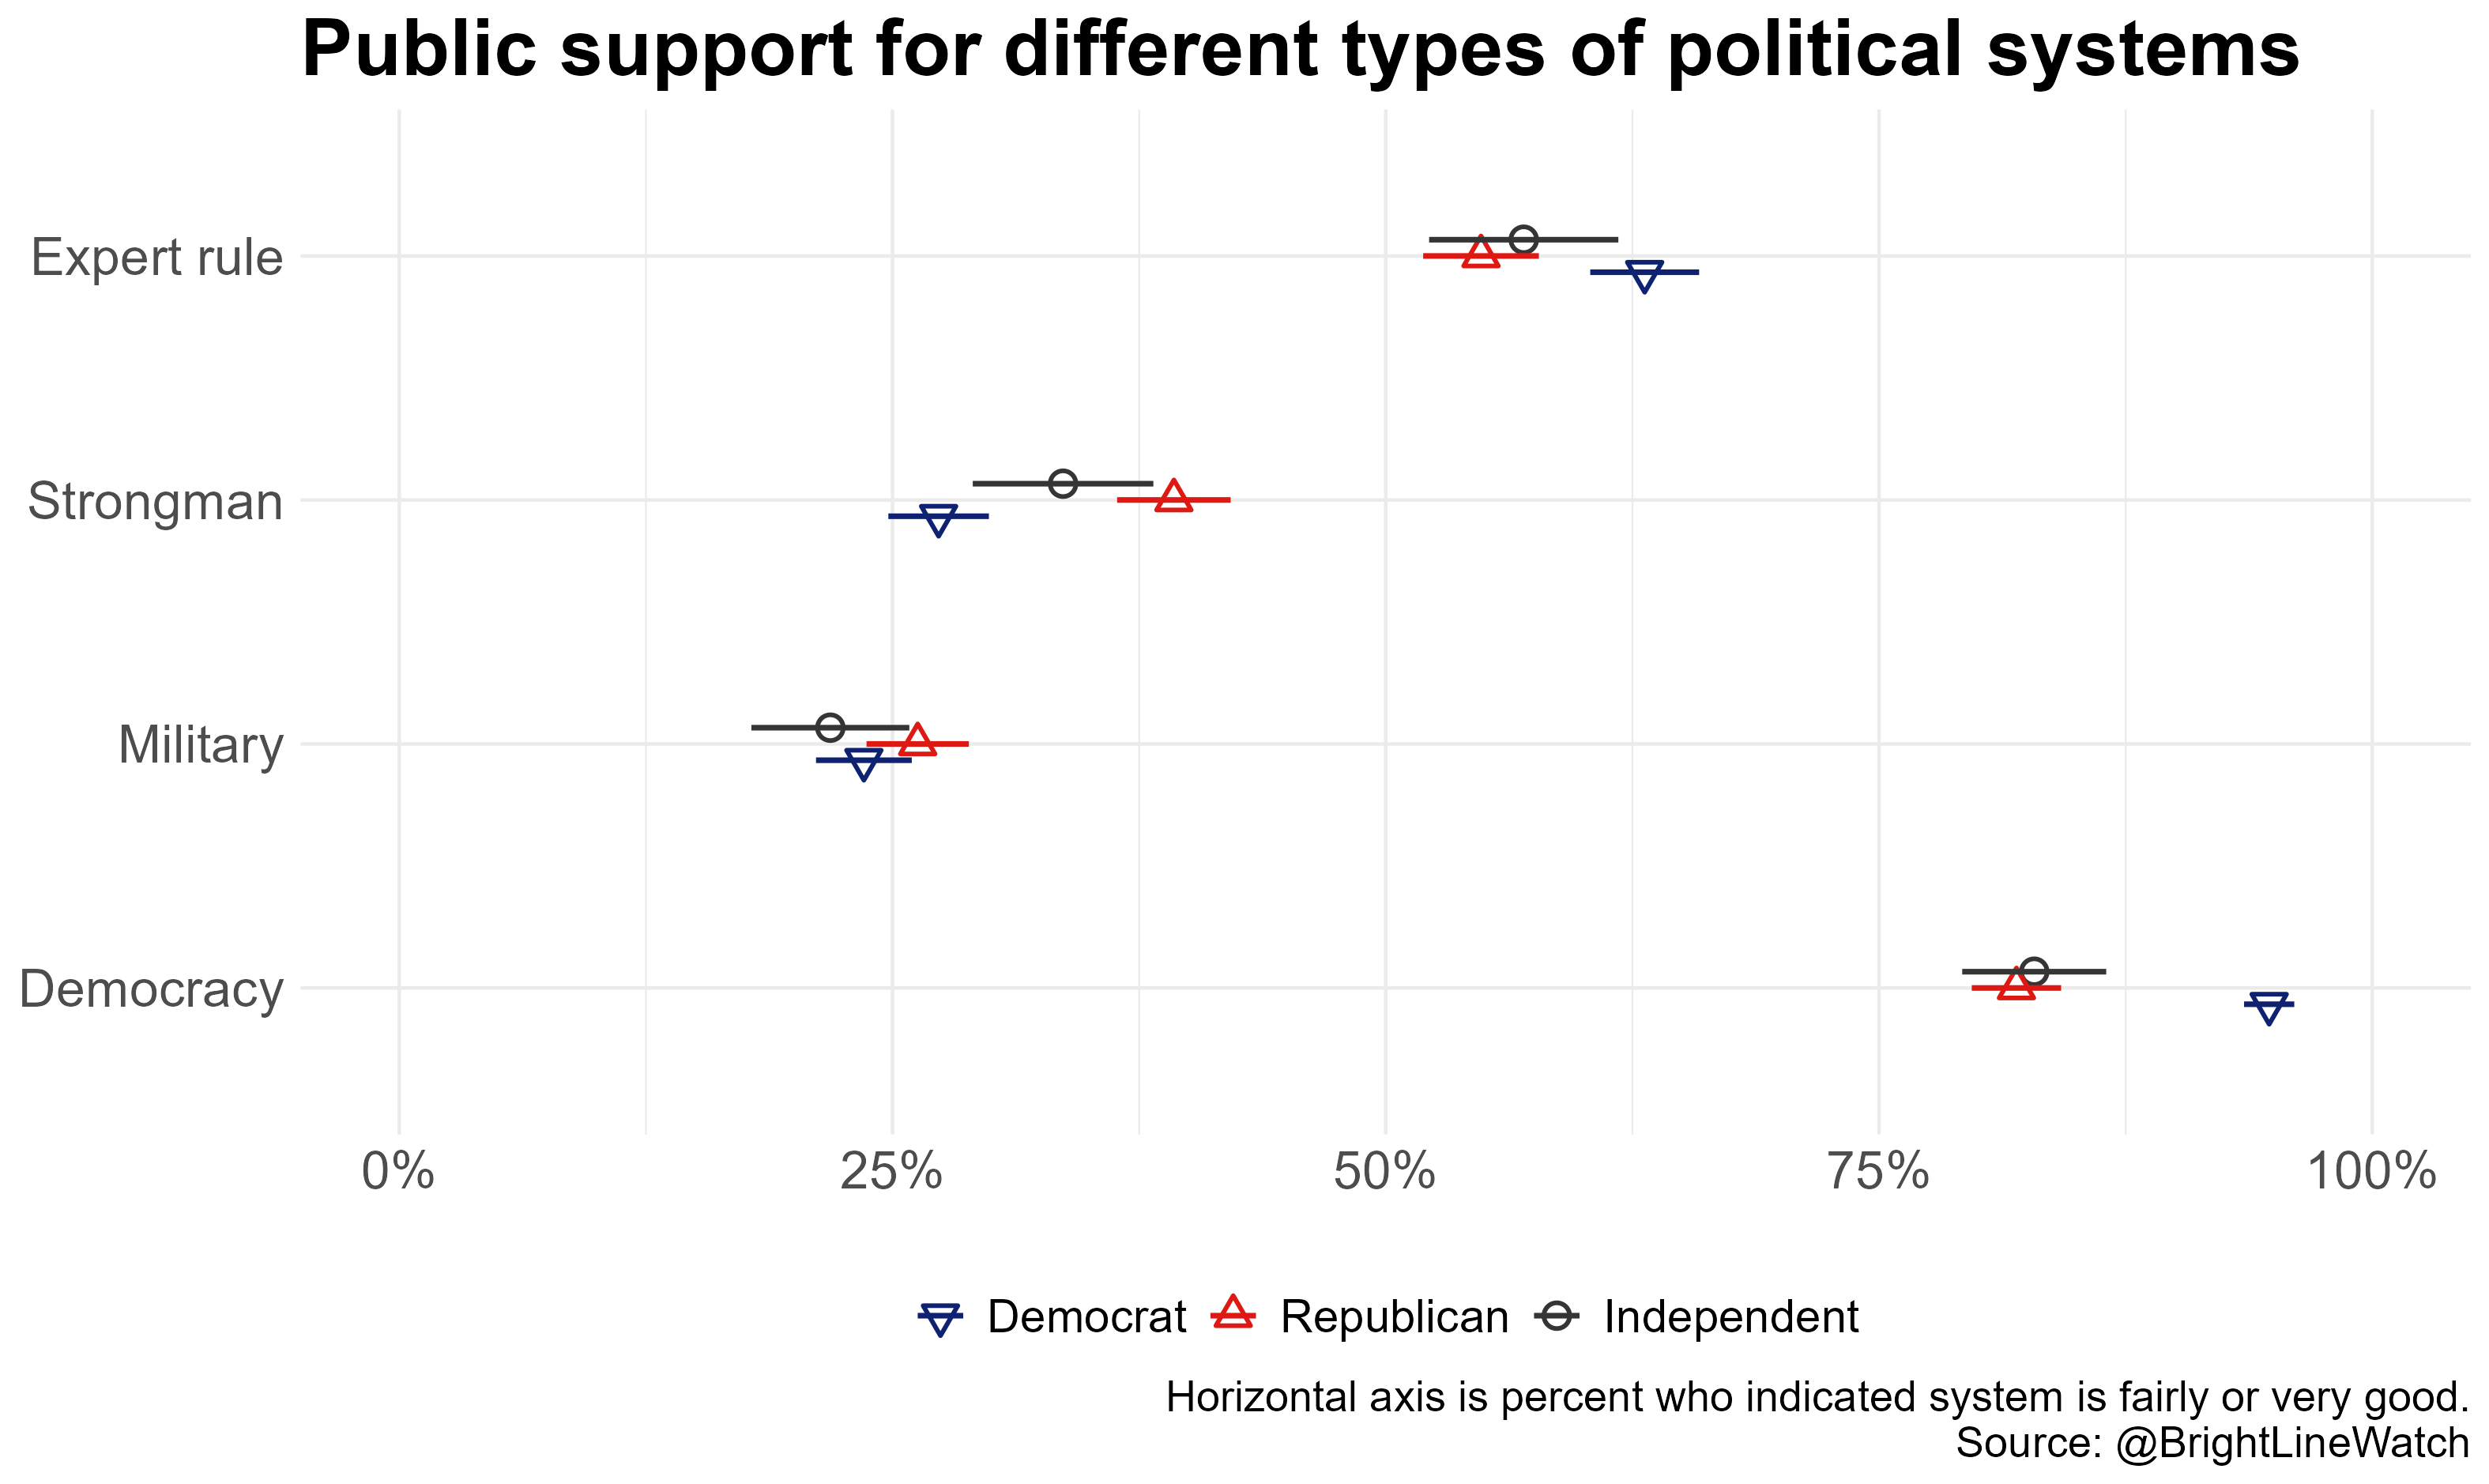
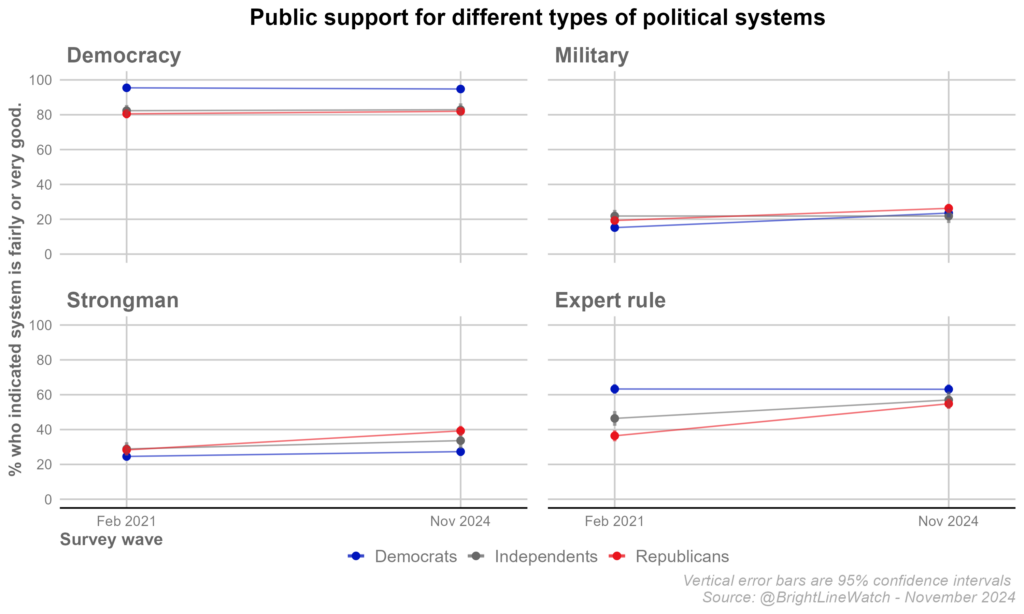
We report below public support for different kinds of political systems and how the responses compare to the last time we measured these quantities.
- The appendix to this report shows a time series of responses to that question among the public overall and separated by respondent partisanship.
- As we have noted in previous reports, no credible evidence supports the claim that any of these types of fraud occur thousands of times in a given election. Scholars find election fraud to be vanishingly rare in general, including in the 2020 election, when Trump and his surrogates claimed it was widespread and pivotal to the presidential outcome. In this sense, even many Democrats hold beliefs that are inconsistent with empirical evidence.
- The paired choice results were transformed into latent estimates using a Bayesian hierarchical logistic model. The model was constructed to estimate latent scores for each explanation and coder-specific reliability factors, which scaled the impact of respondent preferences across sets. Priors were applied to ensure that the latent scores followed a normal distribution. The model was implemented in Stan, utilizing Markov Chain Monte Carlo sampling to estimate the posterior distributions for all parameters. The mean and 95% confidence intervals for the latent scores of each explanation were extracted from the posterior distributions.
- Three items whose probability was rated by experts were not included in the public survey and are therefore not shown in the figure: replacement of the Senate parliamentarian, a large anti-Trump rally being held in Washington, DC, and establishing a review board for military leaders.
- In the October survey, we split the sample, asking half for a projected 2027 rating conditional on a Harris win and half for a projected 2027 rating conditional on a Trump win. The figure here shows the projected ratings conditional on a Trump win only, comparing those with the projected ratings for 2027 from our November, post-election survey, when Trump was known to have won.
