Refusing to admit defeat?
Concessions and non-concessions in the 2020 and 2022 elections for Congress
Concession statements by defeated candidates are an important political ritual. They signal the candidate’s adherence to the democratic rules of the game, which depend on parties to settle who holds power via elections and to respect the legitimacy of the system in both victory and defeat.
Donald Trump’s attempt to overturn his defeat in the 2020 U.S. presidential election flagrantly violated this norm, raising concerns about a potential wave of non-concessions among like-minded election deniers running for office in 2022. After hedging as to whether they would accept the results, some prominent statewide candidates did refuse to acknowledge the results but the feared avalanche of election denialism never materialized. Still, experts currently forecast that former President Trump will again refuse to concede if he loses the November 2024 presidential election (median forecast: 93%) and that one or more statewide candidates in 2024 will refuse to concede (75%).
This report offers the most comprehensive account of concessions and explicit refusals to concede in elections for federal office since Trump’s landmark election denial. We measure the frequency of these statements among runners-up in the 2020 and 2022 congressional elections from both parties and also identify candidates for whom no public statement on the outcome of the election can be found. Our key findings are as follows:
-
Defeated Republican candidates for Congress were more likely to make public statements explicitly refusing to concede (14%) than were Democrats (1%).
-
The problem was worse with Trump at the top of the ticket. In 2020, only 45% of defeated Republicans acknowledged defeat and 20% explicitly refused to concede (the remainder made no identifiable public statement). By contrast, in the 2022 midterms, 59% of defeated Republicans conceded, though 8% still refused to concede.
-
Those Republicans who conceded in 2020 also took longer to do so on average than did Democrats after the race was called by the Associated Press, although the difference between parties was smaller and not statistically significant in 2022.
-
Refusals to concede by defeated Democrats were vanishingly rare (2% in 2020, none in 2022). 76% of defeated Democratic candidates in 2020 and 73% of those who ran in 2022 conceded.
Data collection
We identified all second-place candidates in the contested races for the U.S. Senate and House of Representatives in the 2020 and 2022 general elections. In total, there were 884 such contests – 449 in 2020 and 436 in 2022. We gathered information on each losing candidate including their partisanship (we excluded the 31 cases in which the runner-up was not a Democrat or Republican), whether they had previously held elected office, the vote margin by which they lost, and the precise time when the Associated Press (AP) called their race. For each race, three research assistants searched independently for evidence of a public statement by the defeated major-party candidate about the outcome of the race in social and mainstream media. When possible, we identify the time at which the statement was made to determine how long the candidate waited to make a statement after the race was called. Finally, we classify the statements as a concession or an explicit refusal to concede. Some candidates made one or more additional statements after initially refusing to concede; in those cases, we measure whether a concession was ultimately made and, if so, how long it took for the concession to take place. We describe the data collection process further in the Appendix below.
Concessions by party and election
A majority of defeated major-party candidates in 2020 and 2022 – 65% overall (77% of senatorial candidates, 62% of house) – released a statement acknowledging their defeat, which we call a concession. Three in ten defeated major-party candidates (31%) did not make a statement publicly acknowledging the results of the election. However, 8% of losing candidates across both elections issued public statements explicitly refusing to concede or denying their defeat.
The frequency of concession statements increased slightly from 63% in 2020 to 68% in 2022. Conversely, non-concessions decreased from 11% in 2020 to 4% in 2022. In total, 47 runners-up in 2020 refused to concede compared to 18 in 2022. (The share of races in which no statement was made slightly increased from 29% to 32%.)
However, concession behavior differs dramatically by party. Trump’s effort to overturn the 2020 election was emulated by many Republicans, who echoed his false claims of widespread voter fraud. By contrast, Democrats overwhelmingly attested to the integrity of the electoral system.
The figure below summarizes concession behavior by party (between losing Democratic and Republican candidates) and by election (comparing the 2020 presidential and 2022 midterm elections).
Losing Democrats consistently conceded when they lost (76% in 2020 and 73% in 2022); only 2% (4 candidates) explicitly refused to concede in 2020 and none did so in 2022, though about a quarter did not release a concession statement in each cycle (22% in 2020 and 27% in 2022).
By contrast, losing Republicans conceded at lower rates, especially in 2020, when only 45% issued a public concession. In that year, one in five Republicans publicly denied the results of their election (43 candidates), the highest of any year/party group. Defeated Republicans also made no public statement on the results at higher rates than did Democrats – 34% in 2020 and 32% in 2022. However, the rate of GOP concessions increased significantly from 2020, when Trump himself refused to concede, to 2022, when the most prominent election denier was Arizona gubernatorial candidate Kari Lake. In 2022, concessions among defeated Republicans increased to 59% and explicit refusals to concede decreased to 8%.
Concession timing
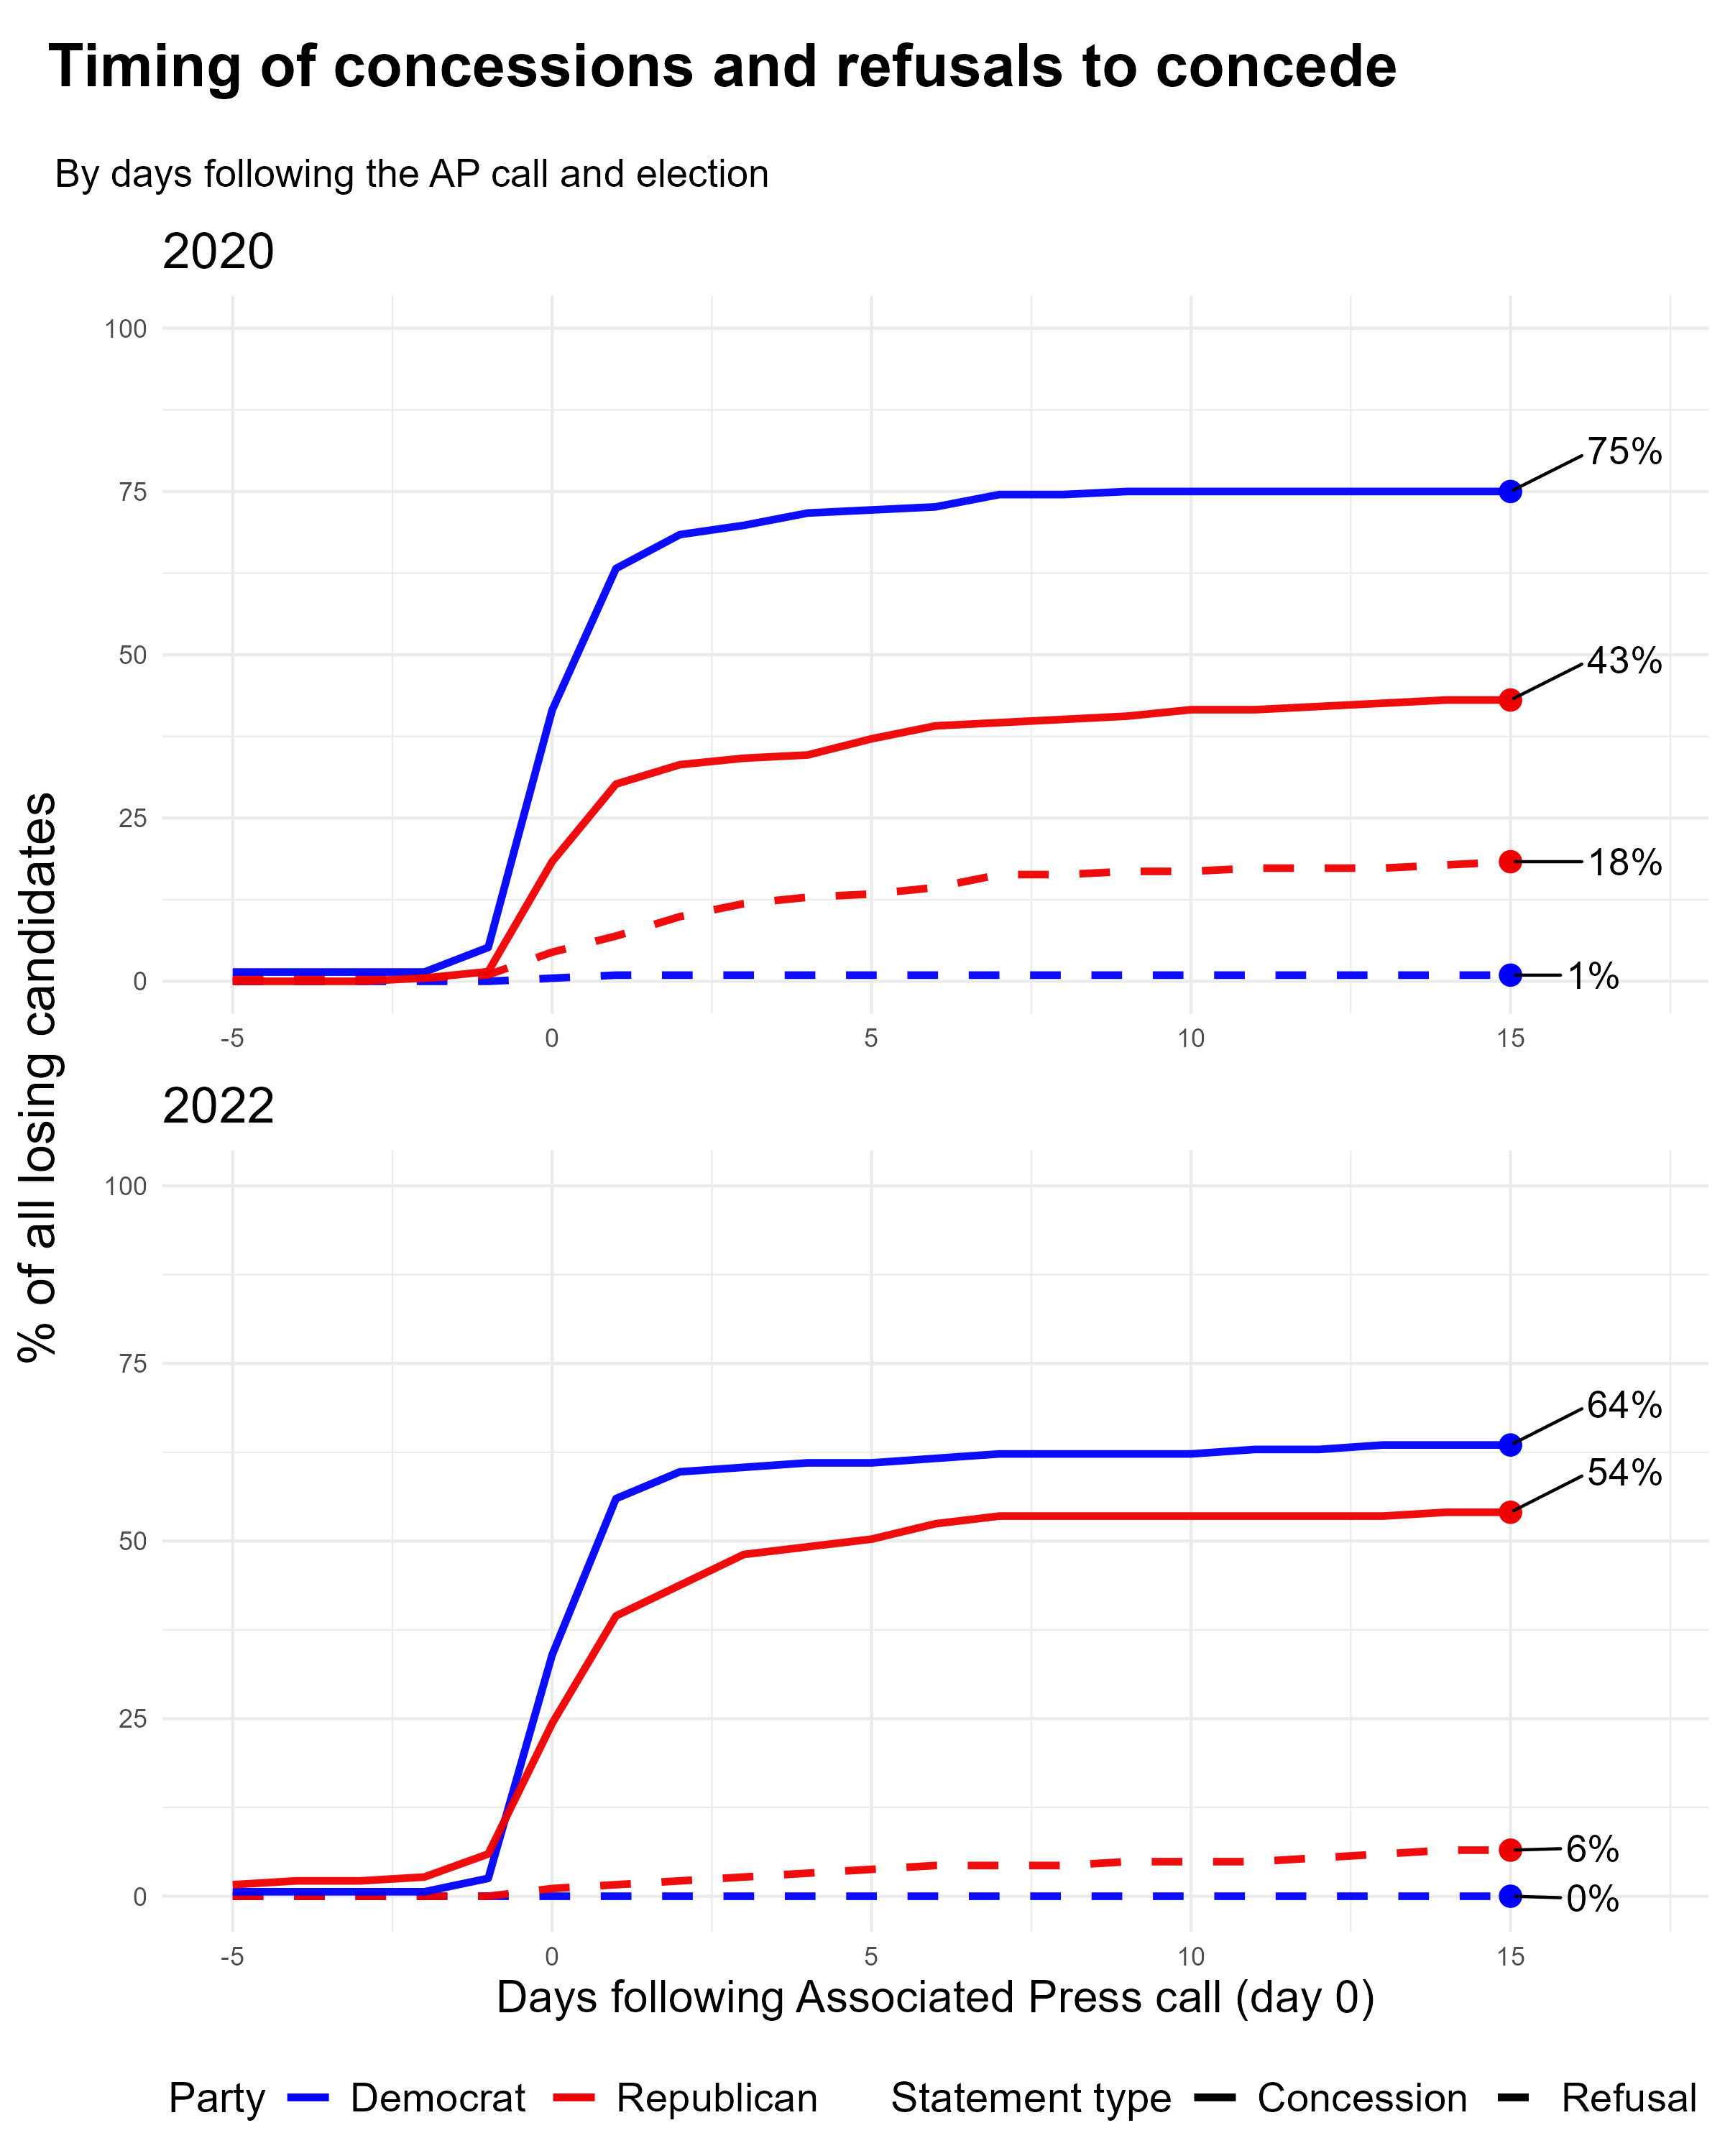
Concessions followed more quickly on the Associated Press’s announcement of a race than did refusals to concede in both the 2020 and 2022 elections. On average, major-party runners-up conceded 1.2 days after the AP call in 2020 and 1.6 days after in 2022. Runners-up who contested the results took on average 4.7 days after the AP call in 2020 compared to 5.7 days in 2022.
The figure below summarizes how soon candidates conceded after the race was called by party or election. (These results are limited to races for which the time of concession can be established.)

Democrats not only concede more frequently than Republicans but do so more quickly after the race is decided — averaging 14 hours after the Associated Press called the outcome of the race in 2020 compared to 2.3 days among Republicans. In 2022, by contrast, the difference between parties was smaller and not statistically significant (1.1 days for Democrats versus 2.1 days among Republicans).
Notably, 80% of Democratic concessions in 2020 took place within one day of the AP election call compared to 61% for Republicans. The partisan gap in day one concessions also held in 2022 (83% of Democrats compared to 66% of Republicans). Refusals took longer on average; only 33% of explicit refusals to concede by Republicans took place within a day of the AP call in 2020 (25% in 2022).
Margin of loss
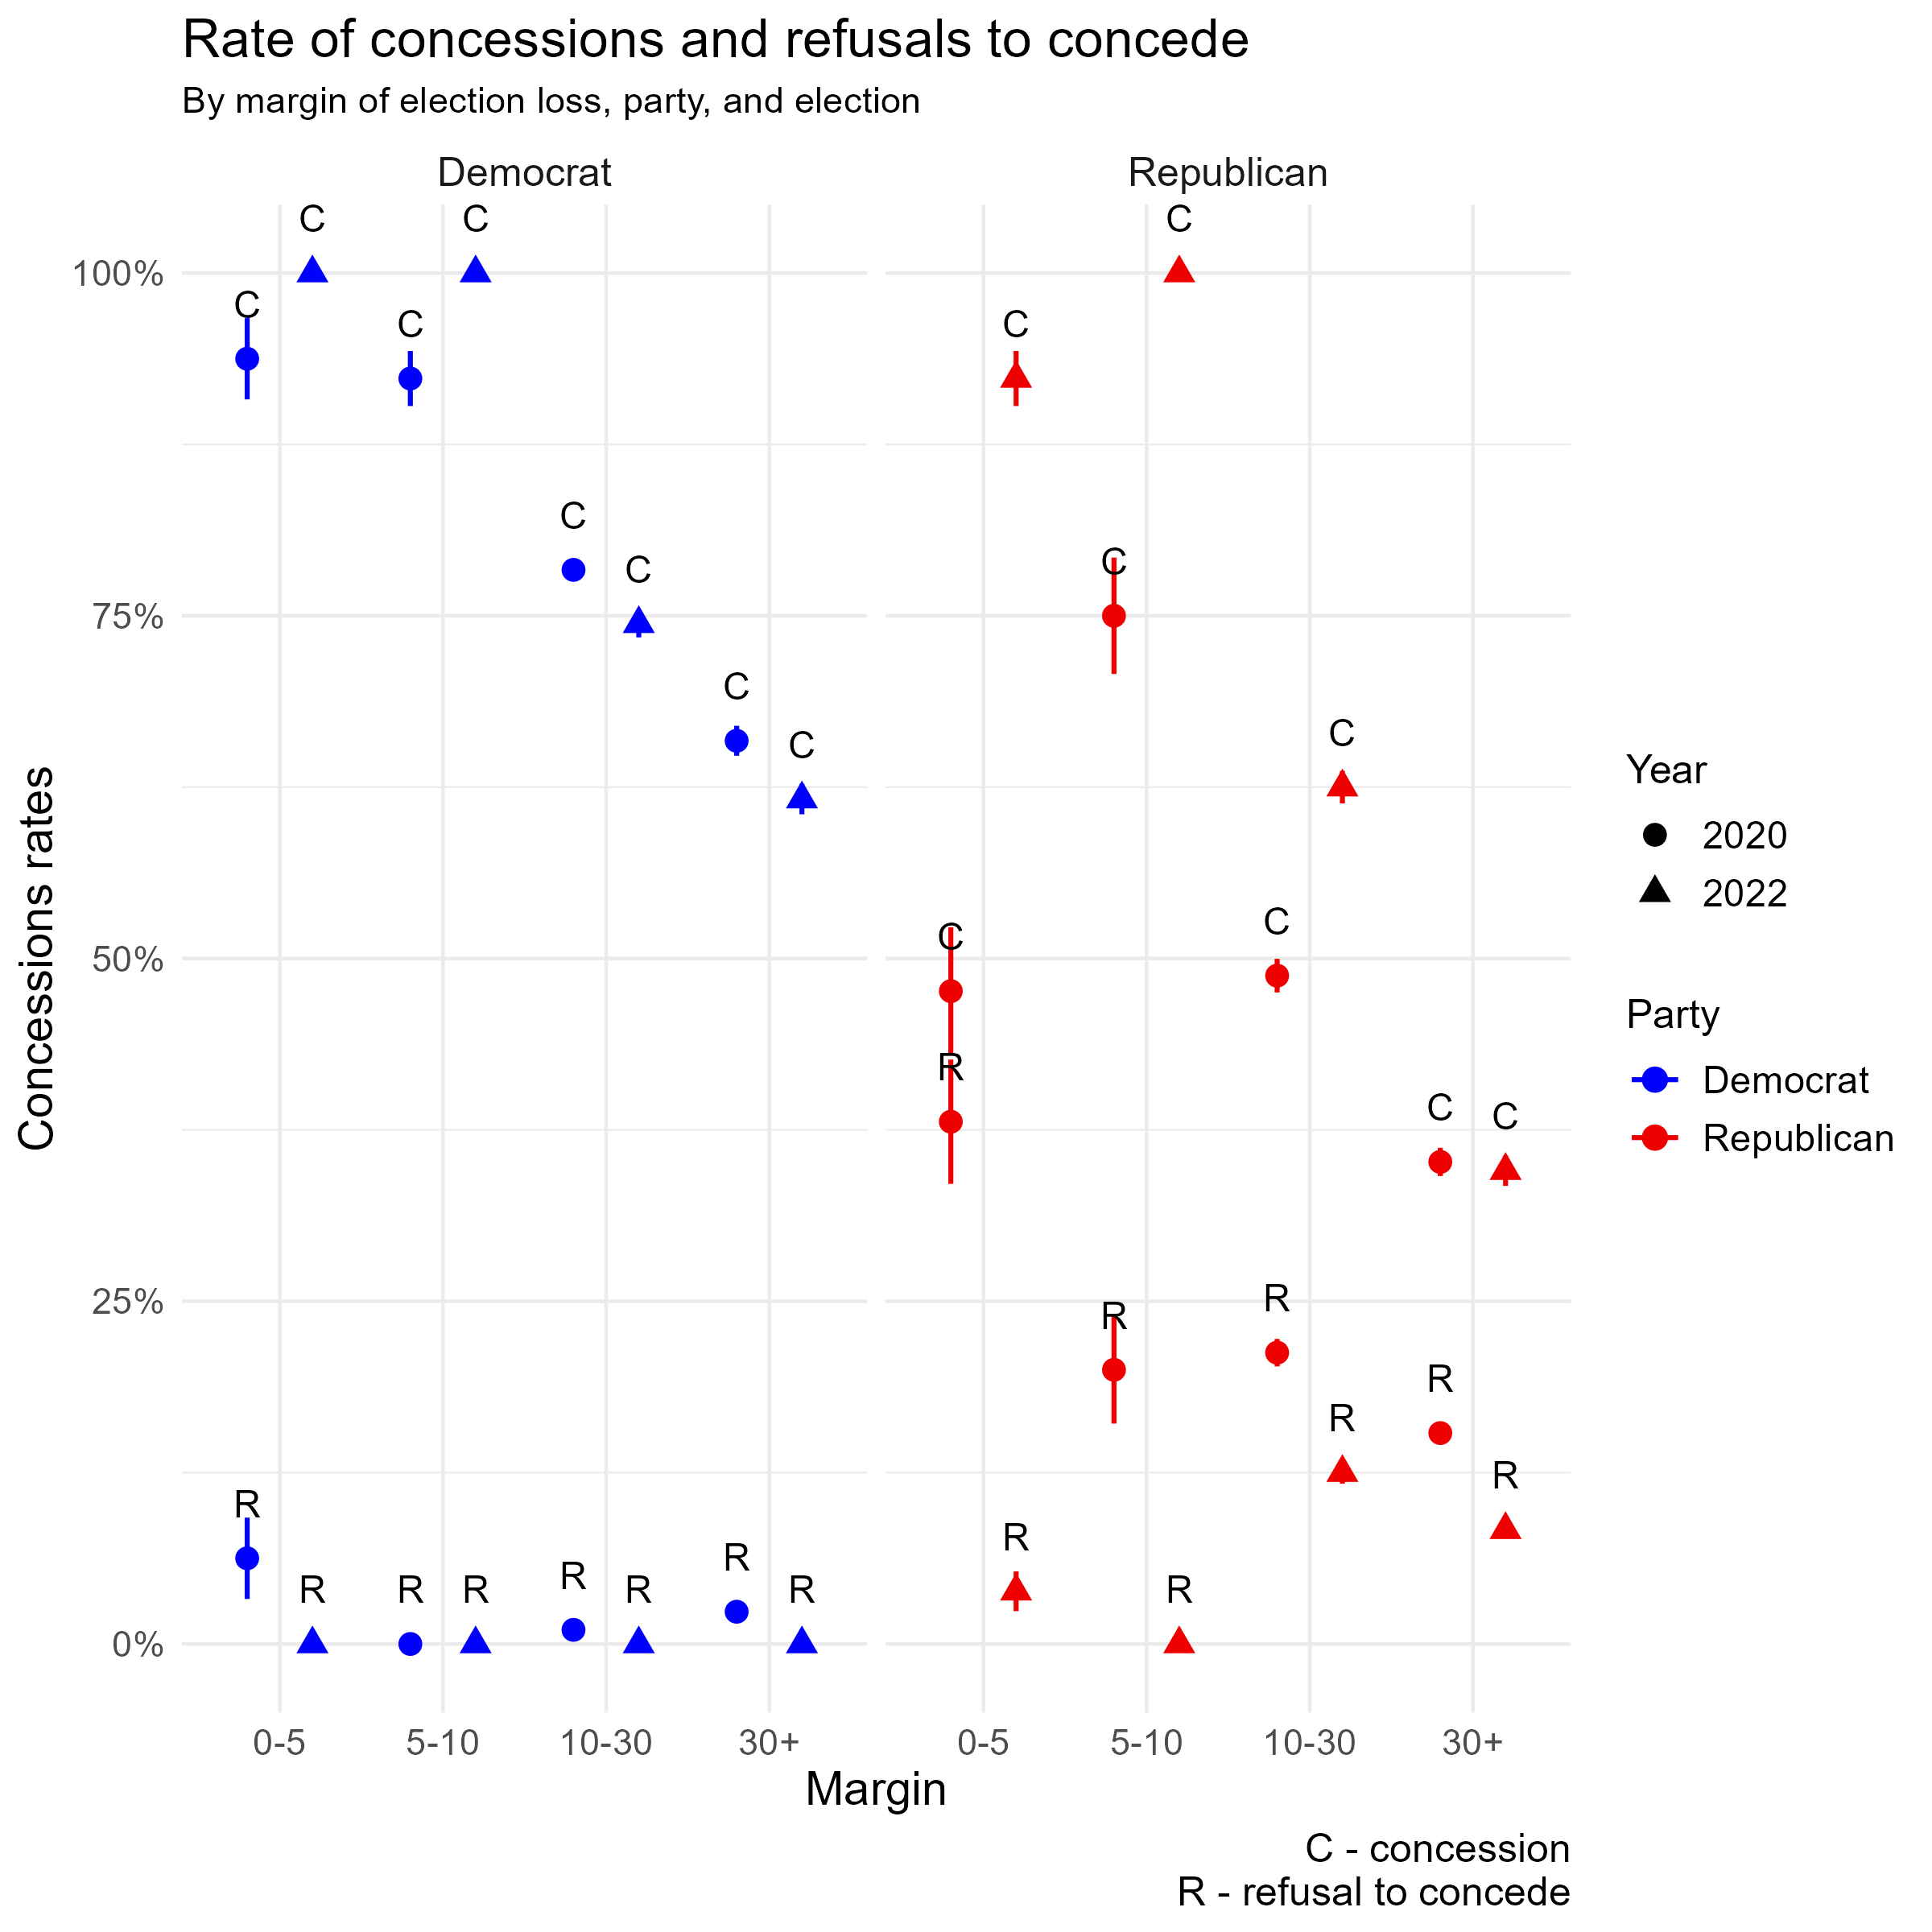
One might expect that candidates would be most motivated to dispute the results of close elections, but support for this expectation is mixed. We divided races into four categories – the most closely contested races (with vote margins of 0% to 5%), competitive races (margins 5%-10%), uncompetitive races (10%-30%), and landslides (margins greater than 30%). In 2020, there were 38 closely contested races, 46 competitive races, 116 uncompetitive races, and 93 landslides. In 2022, these numbers shifted to 46, 35, 171, and 184, respectively. While the overall concession rate was lower in 2020, the relative trends across different margin categories were consistent with those in 2022. Losing major-party candidates in competitive races had the highest concession rates (85% in 2020, 100% in 2022), followed by those in closely contested races (69% in 2020, 96% in 2022), uncompetitive races (65% in 2020, 69% in 2022), and landslides (50% in 2020, 48% in 2022). This trend was more pronounced among Republicans than Democrats.
Among losing Democrats, concession statements were most frequent in the closest races in both elections (94% in 2020 and 100% in 2022). We then observe a steady drop-off in the likelihood of a public concession as margins widen. The incidence of refusals to concede (shown at the bottom of the graph) is close to flat for Democrats, with 6% refusals in the closest races in 2020, then only a handful in uncompetitive races (1%) and landslides (2%) that election, and none at any loss margin in 2022.
By contrast, among Republicans in the closest 2020 races, the share of runners-up who refused to concede (38%) rivaled that who did (48%). In general, the shares of refusals generally declined as margin of loss increased — 20%, 21%, and 15% in competitive, uncompetitive, and landslide races, respectively. In 2022, Republican refusals were less common overall in the closest (4%) and competitive (0%) races compared to uncompetitive (13%) and landslide losses (8%).
(In the figure, the omitted category of behavior is not making a public statement on the results of the election, which becomes more likely for both parties as loss margins grow.)
Experience in elected office
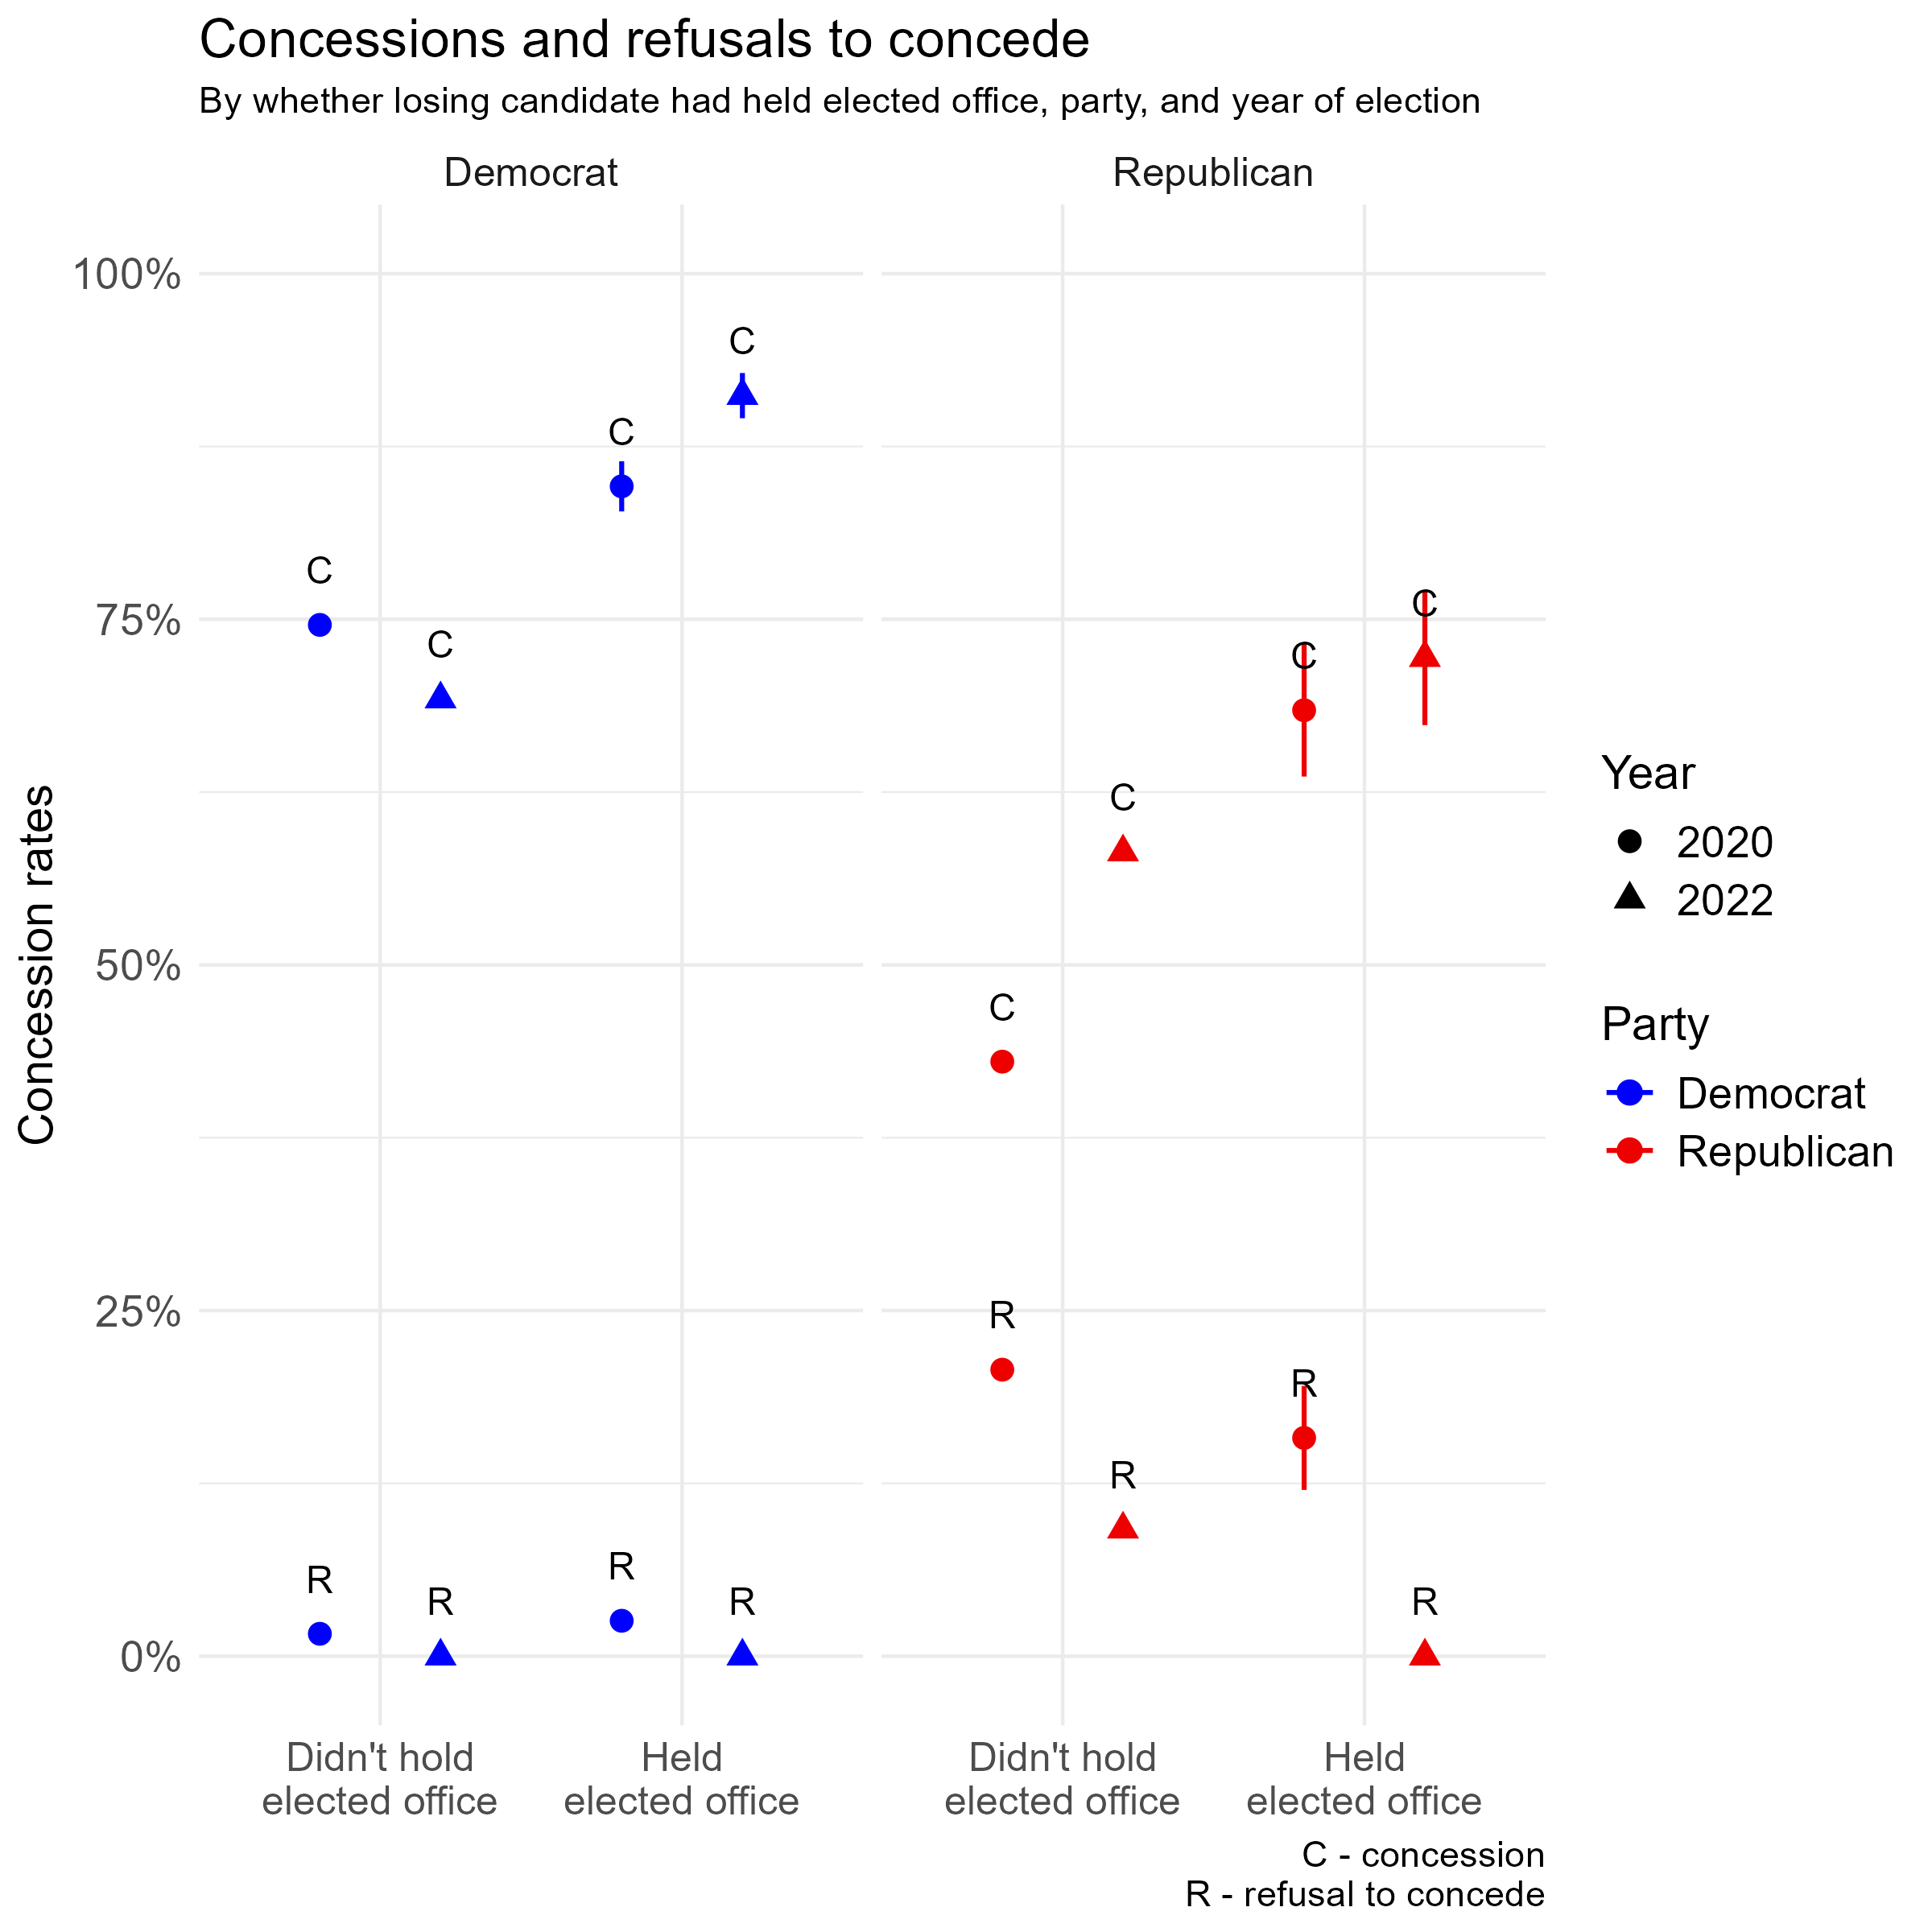
We measured whether a candidate previously held elected office, a common measure of amateur status. In total, 91% (193) of defeated Republicans in 2020 and 92% (196) in 2022 had not previously held office compared to 83% (185) of defeated Democrats in 2020 and 83% (169) in 2022. In total, 70% of candidates for Senate were amateurs as well as 89% of candidates for the House of Representatives (these figures were nearly identical across elections).
In both parties, concessions are more common among candidates who previously held elected office. Among Democrats, in 2020, 75% of candidates who had not previously held elected office conceded compared with 85% among those who had. In 2022, the gap was 69% to 91%, respectively. Similarly among Republicans, only 43% of amateurs conceded in 2020 compared to 68% of runners-up who had held office, though the rate of refusal to concede was similar across groups (21% to 16%, respectively). In 2022, 58% of amateur Republicans conceded and 9% refused to concede, whereas 72% conceded and none refused among those with prior experience in elected office.
In races decided by fewer than 10 percentage points, amateurs refuse to concede at a slightly higher rate (5%) than do non-amateurs (3%). As margins widen, amateurs are differentially more likely than prior office holders to contest the results rather than concede. For races decided by margins of 10 percentage points or more, 8% of amateurs refuse to concede and only 57% concede compared to 0% and 71%, respectively, among non-amateurs.
Appendix
We followed the steps below to collect the data in this report:
-
Scraped Ballotpedia to identify congressional runners-up in 2020 and 2022, including results for all House and Senate seats and the vote share and social media handles of the top two vote-getters. (Uncontested races and those in which the runner-up candidate was not a Democrat or Republican were excluded.)
-
We then scraped data on each runner-up, including whether they previously held elected office.
-
Data on the timing of Associated Press calls was provided to us by the AP.
-
Using only social media accounts created before November 30th of the election year in question, we gathered each tweet from the runner-up candidate.
-
Research assistants (RAs) searched the social media accounts of runners-up for text or video concession statements. Each candidate was assigned to three RAs.
-
All identified statements were coded as a concession, a refusal to concede, or neither. Disagreements between RAs were resolved by discussion with the supervising researcher. The timestamp is recorded where possible for each concession statement identified. All candidates for whom no concession or refusal to concede could be identified were coded as not having made a statement about the results of the election.
-
Some candidates made multiple statements regarding the election results. We then classified each of them and made a judgment about the candidate’s behavior. In cases like these, we sought to give candidates the benefit of the doubt and minimize false positives for refusal. For instance, if a candidate refused to concede immediately after the AP call but later conceded, we would typically classify the candidate as having conceded based on the second statement and use the timing of that statement to measure when they conceded.


